Introduction
Mouse embryonic fibroblasts (MEFs) are cells isolated from mice embryos during the mid-gestation stage and cultured ex vivo. Because of the ease of extraction and isolation of the cells from different mice models, MEFs are widely used for studies of cell growth control, response to DNA damage response and genetic functions (Lengner et al., Reference Lengner, Lepper, Van Wijnen, Stein, Stein and Lian2004). MEFs are a valuable resource for analyzing genetic changes at the cell level. Because of their unique properties, MEFs are particularly useful in cancer research (Durkin et al., Reference Durkin, Qian, Popescu and Lowy2013). MEFs have been used to produce iPS cells (Takahashi and Yamanaka, Reference Takahashi and Yamanaka2006). They are mainly used for stem cell cultures, including embryonic stem cells (ESCs) and iPS of mice (Evans and Kaufman, Reference Evans and Kaufman1981; Martin, Reference Martin1981; Rajarajan et al., Reference Rajarajan, Engels and Wu2012), humans (Thomson et al., Reference Thomson, Itskovitz-Eldor, Shapiro, Waknitz, Swiergiel, Marshall and Jones1998; Rajarajan et al., Reference Rajarajan, Engels and Wu2012), pigs, dogs, cattle, horses, cow (Rajarajan et al., Reference Rajarajan, Engels and Wu2012; Ezashi et al., Reference Ezashi, Yuan and Roberts2016), monkeys (Fang et al., Reference Fang, Liu, Zhao, Li, Zhu, Du, Xiang, Li, Liu, Miao, Zhang, Shi, Yang, Xu and Deng2014), rabbits (Honda, Reference Honda2013) and rat (Ueda et al., Reference Ueda, Kawamata, Teratani, Shimizu, Tamai, Ogawa, Hayashi, Tsuda and Ochiya2008; Rajarajan et al., Reference Rajarajan, Engels and Wu2012) ESCs. In addition, MEFs are also used to culture EpiSCs (Brons et al., Reference Brons, Smithers, Trotter, Rugg-Gunn, Sun, Chuva de Sousa Lopes, Howlett, Clarkson, Ährlund-Richter, Pedersen and Vallier2007; Tesar et al., Reference Tesar, Chenoweth, Brook, Davies, Evans, Mack, Gardner and McKay2007), spermatogonial stem cells (Kanatsu-Shinohara et al., Reference Kanatsu-Shinohara, Ogonuki, Inoue, Miki, Ogura, Toyokuni and Shinohara2003; Kubota et al., Reference Kubota, Avarbock and Brinster2004; Azizi et al., Reference Azizi, Conrad, Hinz, Asgari, Nanus, Peterziel, Hajizadeh Moghaddam, Baharvand and Skutella2016, Reference Azizi, Hamidabadi and Skutella2019) and human dental pulp cells (Liu et al., Reference Liu, Peng, Xu, Huang and Wei2018). These cells support stem cells by producing growth factors and cytokines (Chen et al., 2012). In addition, they provide adhesion molecules and ECM components to bind the stem cells to each other and maintain these stem cells in an undifferentiated state (Llames et al., Reference Llames, García-Pérez, Meana, Larcher and del Río2015).
MEFs, also called feeder cells, can secrete 136 specific and unique proteins into the culture medium (Lim and Bodnar, Reference Lim and Bodnar2002). These growth factors are divided into three groups based on differentiation effects on stem cells. The first group (Activin A and Tgfb1) seems to inhibit the differentiation of stem cells into the endoderm and ectoderm, but allows these cells to differentiate into mesoderm (muscle). The second group (Fgf2 and Bmp4) includes growth factors that induce differentiation into the ectoderm as well as the mesoderm in stem cells. The third group (Ngf and Hgf) induces differentiation into the three embryonic lineages (endoderm, ectoderm and mesoderm) (Schuldiner et al., Reference Schuldiner, Yanuka, Itskovitz-Eldor, Melton and Benvenisty2000). One of the cytokines secreted by feeder cells is Lif, which is a key factor in the maintenance of stem cells in various animal species (Ohtsuka et al., Reference Ohtsuka, Nakai-Futatsugi and Niwa2015).
The unique features of pluripotent stem cells (ESCs and iPSCs) make these cells suitable for research in developmental biology, developmental genetics, cell therapy, tissue engineering and drug testing (Assadollahi et al., Reference Assadollahi, Fathi, Abdi, Khadem Erfan, Soleimani and Banafshi2019a, 2019b, 2019c; Soleimani et al., Reference Soleimani, Babaei, Feizi and Fathi2020). To maintain both self-renewal and pluripotency, these cells are usually cultured on a substrate of cells (feeder layer) (Zou et al., Reference Zou, Wu, Zhong, Fan, Zhang, Chen and Ma2016). The most common feeder layer used for culturing these cells is MEFs (Chen et al., 2012). Other cell lines, such as an immortal line of mice fibroblasts (STO lineage), human bladder carcinoma cell line 5637, an immortal Chinese hamster ovary line (CHO) and 3T3 cells are also used to culture ESCs and iPS. In addition to these cells, many human cells have been used as feeder layers to produce and cultivate stem cells, especially pluripotent stem cells (Eiselleova et al., 2004). The results of studies have shown that MEFs support stem cell growth under undifferentiated conditions better than other feeder cells. For this purpose, they are inactivated by radiation or mitomycin C and used as a protective layer (Eiselleova et al., 2004). However, studies have shown that inactivation of MEFs with mitomycin C and/or radiation may change the synthesis of growth regulator proteins, including several signalling proteins such as Wnt-3 (Xie et al., Reference Xie, Lin, Luo, Luo and Lu2004).
Given that mechanisms of self-renewal maintenance in stem cells are unknown, it is not easy to optimize an appropriate culture system that can effectively support the isolation and maintenance of specific stem cell properties (Niwa, Reference Niwa2001). It has been shown that providing PSCs depends on the type, source and quality of the feeder layer (Richards et al., Reference Richards, Tan, Fong, Biswas, Chan and Bongso2003; Eiselleova et al., 2004; Pekkanen-Mattila et al., Reference Pekkanen-Mattila, Ojala, Kerkelä, Rajala, Skottman and Aalto-Setälä2012). The potential for pluripotency and differentiation of these cells depends on the type and level of environmental factors secreted by the feeder cells encountered by these stem cells (Eiselleova et al., 2004; Pekkanen-Mattila et al., Reference Pekkanen-Mattila, Ojala, Kerkelä, Rajala, Skottman and Aalto-Setälä2012). Various studies have used different MEF passages as feeder layers. MEFs at greater than 4–6 passages could not retain ESCs under undifferentiated, pluripotent and self-renewal conditions in some studies (Li et al., Reference Li, Zhang, Hou, Jiao, Zheng and Wang2003). MEFs at than five passages could not support ESC proliferation (Li et al., Reference Li, Ma, Hou, Sun, Sun and Wang2004).
The purpose of this study was to evaluate the expression levels of Fgf2, Bmp4, ActivinA, Lif and Tgfb1 genes in MEFs isolated from 13.5-day-old and 15.5-day-old embryos at passages one, three and five in two mice strains, C57BL/6 and NMRI. We also evaluated the secretions of cytokine Lif and Fgf2 proteins in the culture medium.
Materials and methods
Preparation of MEFs and collection of conditioned medium
MEFs were derived from the NMRI and C57BL/6 mouse strains. Pregnant females were sacrificed by cervical dislocation at days 13.5 and 15.5 of gestation and embryonic fibroblasts were prepared by the most common protocol using trypsin–EDTA (Behringer et al., Reference Behringer, Gertsenstein, Nagy and Nagy2014). Primary mouse fibroblasts were expanded overnight in DMEM-LG supplemented with 10% FBS and 1% penicillin–streptomycin. For all experiments, we used the first, third and fifth passages of the mouse fibroblasts.
The timeline for collection of the conditioned medium was 24 h after the first, third and fifth passages. Briefly, NMRI and C57BL/6 feeder cells were plated on 25 cm2 gelatin-coated flasks at a density of 104 cells cm–2. Cell viability and cell counts were determined using trypan blue staining. Passage one, three and five fibroblasts were mitotically inactivated using mitomycin C treatment for 3 h, Sigma-Aldrich). Samples from the conditioned medium were collected from these cultures after 24 h.
We collected 500-µl aliquots of conditioned medium from each 25-cm flask that contained 5 ml of medium. The aliquots were centrifuged and stored at −80°C until use.
Detection of Fgf2 and Lif secreted by feeder layers
We evaluated the amount of Lif and Fgf2 in the conditioned medium with commercially available enzyme-linked immunosorbent assay (ELISA) kits: Mouse LIF DuoSet (DY449; R&D Systems) and Mouse FGF basic DuoSet ELISA (DY3139-05; R&D Systems). All samples were measured at least in quadruplicate and the culture experiments were repeated twice with similar results.
Quantitative real-time polymerase chain reaction (qRT-PCR)
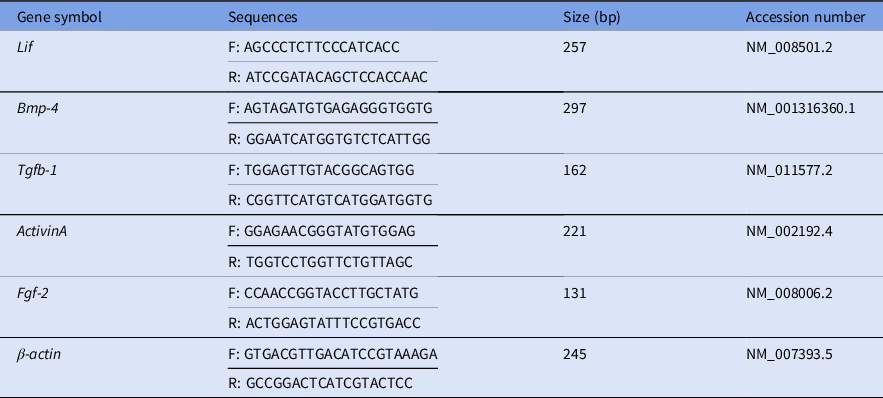
We extracted total RNA from the MEFs using a Cultured Cell Total RNA Mini Kit (Favorgen Biotech Corp., Pingung, Taiwan). cDNA synthesis was performed using the Revert Aid First Strand cDNA Synthesis Kit (SinaClon, Tehran, Iran). Quantitative real-time polymerase chain reaction (qRT-PCR) was carried out using a SYBR Premix Ex Taq Kit (TaKaRa, Kyoto, Japan). Mouse β-actin was the reference gene for normalization of the relative qRT-PCR data. Data were calculated using the ΔΔCt method. Table 1 lists the PCR primers used in this study.
Primer sequences used in the present study

Statistical analysis
All experiments were repeated at least three times. The SPSS 21.0 software package (SPSS Inc., Chicago, IL, USA) was used for the statistical tests. All the data were prepared using one-way analysis of variance and a P-value < 0.05 was considered to be statistically significant.
Results
Expression of Bmp4, Fgf2, ActivinA, Lif and Tgfb1 in passages 1, 3 and 5 of MEFs from 13.5-day-old and 15.5-day-old C57BL/6 embryos
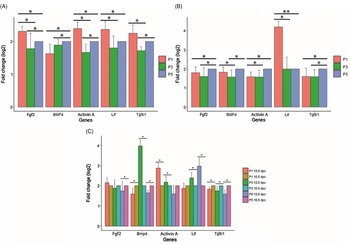
Figure 1(A) compares the expression levels of Bmp4, Fgf2, ActivinA, Lif and Tgfb1 genes in the assessed passages of MEFs from 13.5-day-old C57BLl/6 embryos. The highest expression levels of the Fgf2, ActivinA, Lif and Tgfb1 genes were observed in passage 1 (P < 0.05). There was no significant difference in expression observed between passages 1 and 5 for the Tgfb1 gene. Also, the expression levels of Fgf2, ActivinA, Lif and Tgfb1 genes in passage 3 were greater than those in passage 5. This difference was not significant for the Lif gene and significant for the other genes (P < 0.05). The highest expression of Bmp4 was observed in passage 5, which was significantly higher than passages 1 and 3 (P < 0.05). The difference in the expression level of Bmp4 in passages 1 and 3 was not significant.
Bmp4, Fgf2, Activin A, Lif and Tgfb1 expression levels in passages 1, 3 and 5 of MEFs from 13.5-day-old and 15.5-day-old C57BL/6 embryos determined using qPCR. (A) Comparison of the relative expression levels of Bmp4, Fgf2, Activin A, Lif and Tgfb1 in passages 1, 3 and 5 of MEFs from 13.5-day-old C57BL/6 embryos. (B) Comparison of Bmp4, Fgf2, Activin A, Lif and Tgfb1 expression levels in passages 1, 3 and 5 of MEFs from 15.5-day-old C57BL/6 embryos. (C) Comparison of the expression levels of Bmp4, Fgf2, ActivinA, Lif and Tgfb1 genes in assessed passages of MEFs from 13.5-day-old between 15.5-day-old C57BL/6 embryos. (*) and (**) represents significant differences (P < 0.05) and (P < 0.001) in gene expression level respectively. The experiments were replicated three times.

Figure 1(B) compares the expression levels of Bmp4, Fgf2, ActivinA, Lif and Tgfb1 genes in passages 1, 3 and 5 of MEFs from 15.5-day-old C57BL/6 embryos. The highest expression levels of Fgf2, Bmp4, ActivinA and Tgfb1 genes were observed in passage 5 MEFs. For the Bmp4 gene, the expression of this gene in passage 5 was not significant compared with passage 1; in other cases, the level of significance was equal to P < 0.05. There was no significant difference found in Fgf2 gene expression between passages 1 and 3. Expression levels of ActivinA and Tgfb1 were not significant between passages 1 and 3. The highest expression of the Lif gene was related to passage 1. The difference in Lif expression between passages 3 and 5 was not significant.
Expression levels of Bmp4, Fgf2, ActivinA, Lif and Tgfb1 genes in different passages of MEFs from 13.5-day-old and 15.5-day-old C57BL/6 embryos showed that Fgf2 expression increased in passage 1 in MEFs from 13.5-day-old embryos compared with those from 15.5-day-old embryos and increased during passages 3 and 5 in MEFs from the 15.5-day-old embryos compared with the same passage number MEFs in 13.5-day-old embryos. This increase was only significant in passage 5 (P < 0.05). The Bmp4 gene showed greater expression in passages 1 and 5 in MEFs from 15.5-day-old embryos compared with passages 1 and 5 in MEFs from 13.5-day-old embryos; however, in passage 3, the gene expression was higher in the MEFs from 13.5-day-old embryos compared with those from 15.5-day-old embryos (P < 0.05). In passages 1 and 3, there was greater ActivinA gene expression in the MEFs from 13.5-day-old embryos compared with the same passages from 15.5-day-old embryos (P < 0.05). However, passage 5 of the MEFs from 15.5-day-old embryos had greater ActivinA gene expression compared with those from 13.5-day-old embryos. The expression pattern of Lif was greater in passage 1 of the MEFs from 15.5-day-old embryos compared with the ones from 13.5-day-old embryos, whereas Lif expression in passages 3 and 5 of the MEFs from 13.5-day-old embryos was greater than its expression in the same passages of MEFs from 15.5-day-old embryos (P < 0.05). Tgfb1 gene expression in all three passages of MEFs from 15.5-day-old embryos was higher than MEFs of 13.5-day-old embryos (P < 0.05) (Fig. 1C).
Expression of Bmp4, Fgf2, ActivinA, Lif and Tgfb1 in passages 1, 3 and 5 of MEFs from 13.5-day-old and 15.5-day-old NMRI embryos
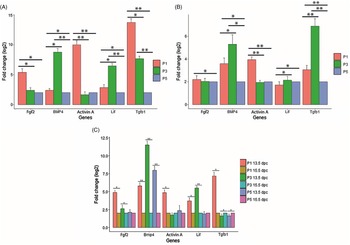
Figure 2(A) shows a comparison of the expression levels of Bmp4, Fgf2, ActivinA, Lif and Tgfb1 genes in the assessed passages from MEFs of 13.5-day-old NMRI embryos. The Fgf2 gene had a significantly higher expression in passage 1 MEFs compared with passages 3 and 5 (P < 0.05). Although Fgf2 expression was higher in passage 3 compared with passage 5, this difference was not significant. Both Bmp4 and Lif genes had the highest expression levels at passage 3 compared with the other two passages (P < 0.05, P < 0.001). Expression of these genes in passage 1 was greater than passage 5 (P < 0.05). ActivinA had the highest expression in passage 1 followed by passage 5 (P < 0.001). There was no significant difference in expression of this gene between passages 3 and 5. The expression pattern of Tgfb1 was similar to Fgf2, except that its expression was significant between passages 3 and 5 and the level of significance between passages 1 and 3 and passages 1 and 5 was P < 0.05 and P < 0.001, respectively.
The relative expression levels of Bmp4, Fgf2, Activin A, Lif and Tgfb1 in passages 1, 3 and 5 of MEFs from 13.5-day-old and 15.5-day-old NMRI embryos determined by qPCR. (A) Comparison of Bmp4, Fgf2, Activin A, Lif and Tgfb1 expression levels in passages 1, 3 and 5 of MEFs from 13.5-day-old NMRI embryos. (B) Comparison of the relative expression levels of Bmp4, Fgf2, Activin A, Lif and Tgfb1 in passages 1, 3 and 5 of MEFs from 15.5-day-old NMRI embryos. (C) Comparison of the expression levels of Bmp4, Fgf2, ActivinA, Lif and Tgfb1 genes in assessed passages of MEFs from 13.5-day-old between 15.5-day-old NMRI embryos. (*) and (**) represent significant differences (P < 0.05) and (P < 0.001) in gene expression levels, respectively. The experiments were replicated three times.

Figure 2(B) compares the expression levels of Bmp4, Fgf2, ActivinA, Lif and Tgfb1 genes in passages 1, 3 and 5 of MEFs from 15.5-day-old NMRI embryos. The highest expression of Bfgf2 was observed in passage 1 and this increase was only significant for passage 1 compared with passage 5 (P < 0.05).The highest expression levels of the Bmp4 and Tgfb1 genes were observed in passage 3 (P < 0.05, P < 0.001). The expression levels of these two genes in passage 1 were greater than those in passage 5 (P < 0.05, P < 0.001). The ActivinA gene had the highest expression in passage 1 (P < 0.001). The difference in ActivinA expression between passages 3 and 5 was not significant. The highest LIF expression, such as the Bmp4 and Tgfb1 genes, was observed in passage 3, but this increase was only significant compared with passage 1 (P < 0.05). In addition, Lif expression in passage 5 was higher than passage 1 (P < 0.05).
Bmp4, Fgf2, ActivinA, Lif and Tgfb1 gene expression levels in the assessed passages of MEFs from 13.5-day-old and 15.5-day-old embryos of NMRI mice were compared. The Fgf2 gene had higher expression in all three passages of MEFs from 13.5-day-old embryos compared with MEFs from 15.5-day-old embryos. This increase was significant in passages 1 and 3 (P < 0.05). Bmp4 expression increased in all passages of MEFs from 13.5-day-old embryos compared with the ones from 15.5-day-old embryos (P < 0.001). ActivinA expression increased in passages 1 and 5 of the MEFs from 13.5-day-old embryos and in passage 3 of the MEFs from 15.5-day-old embryos. This increase was only significant for passage 1 (P < 0.05). The Lif gene had higher expression levels in passages 1 (P < 0.05) and 3 (P < 0.001) of MEFs from 13.5-day-old embryos compared with the ones from 15.5-day-old embryos. Lif had greater expression in passage 5 of the MEF from 15.5-day-old embryos compared with MEFs from 13.5-day-old embryos. This increase in expression was not significant. The Tgfb1 gene had increased expression in passage 1 of the MEFs from 13.5-day-old embryos and in passages 3 and 5 of MEFs from15.5-day-old embryos (P < 0.05) (Fig. 2C).
Comparison of the expression levels of Bmp4, Fgf2, ActivinA, Lif and Tgfb1 genes in passages 1, 3 and 5 of MEFs from 15.5-day-old NMRI and C57BL/6 embryos
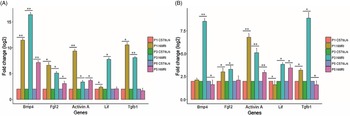
We compared the expression levels of Bmp4, Fgf2, ActivinA, Lif and Tgfb1 genes in different passages of MEFs taken from 13.5-day-old embryos of NMRI and C57BL/6 mice. The results showed that expression levels of Bmp4, Fgf2, ActivinA and Lif genes in passages 1, 3 and 5 MEF from NMRI embryos were greater than those from C57BL/6 embryos. This increase was significant for all of the genes (P < 0.05, P < 0.001), except for Lif in passage 5. Tgfb1 gene expression in passages 1 and 3 MEF from NMRI mice embryos was greater than in C57BL/6 embryos (P < 0.05, P < 0.001). However, the increase in Tgfb1 gene expression at passage 5 in MEF from C57BL/6 embryos compared with NMRI embryos was not significant (Fig. 3A).
Comparison of the expression levels of Bmp4, Fgf2, ActivinA, Lif and Tgfb1 genes in passages 1, 3 and 5 of MEFs from 13.5-day-old and 15.5-day-old NMRI between 13.5-day-old and 15.5-day-old C57BL/6 embryos determined using qPCR. (A) Comparison of Bmp4, Fgf2, ActivinA, Lif and Tgfb1 expression levels in assessed passages of MEFs from 13.5-day-old C57BL/6 between 13.5-day-old NMRI embryos. (B) Comparison of the relative expression levels of Bmp4, Fgf2, Activin A, Lif and Tgfb1 in passages 1, 3 and 5 of MEFs from 15.5-day-old C57BL/6 embryos between 15.5-day-old NMRI. (*) and (**) represent significant differences (P < 0.05) and (P < 0.001) in gene expression levels, respectively. The experiments were replicated three times.

A comparison of the expression levels of Bmp4, Fgf2, ActivinA, Lif and Tgfb1 genes in the assessed passages of MEFs from 15.5-day-old NMRI and C57BL/6 embryos showed that the Bmp4 gene in the NMRI compared with C57BL/6 MEFs increased in passages 1 and 3. This increase was only significant in passage 3 (P < 0.001). Bmp4 gene expression in passage 5 MEF from C57BL/6 mice embryos was greater than in NMRI embryos (P < 0.05). Fgf2 also had an increase in MEFs from NMRI embryos compared with C57BL/6 embryos for all three passages. This increase was significant only in passages 1 and 3 (P < 0.05). In all three passages, we noted more expression of ActivinA in NMRI compared with C57BL/6 MEFs (P < 0.001). The Lif gene was expressed more in passages 3 and 5 MEFs from NMRI compared with C57BL/6 embryos (P < 0.05), whereas Lif expression in passage 1 of MEFs from C57BL/6 embryos was higher than in NMRI MEFs (P < 0.05). The Tgfb1 gene had higher expression in passage 5 MEFs from C57BL/6 embryos than NMRI embryos, whereas expression of this gene increased in passages 1 and 3 in MEFs from NMRI compared with C57BL/6 embryos (P < 0.05) (Fig. 3B).
Secretion of Lif and Fgf2 by MEFs from 13.5-day-old and 15.5-day-old NMRI embryos in passages 1, 3 and 5
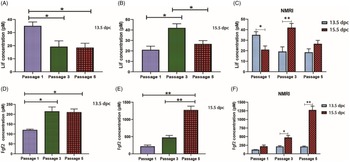
Figure 4(A) compares the levels of Lif secretion between 1, 3 and 5 passages of MEFs of 13.5-day-old NMRI embryos. The highest level of cytokine secretion was observed in passage 1. Lif secretion showed a significant reduction in passages 3 and 5 compared with passage 1 (P < 0.05). No significant difference was found between the levels of Lif secretion in passages 3 and 5.
Lif and Fgf2 secretion by MEFs from 13.5-day-old and 15.5-day-old NMRI embryos. (A) Panel shows Lif concentrations, as measured using ELISA, in medium from feeder cells from 13.5-day-old embryos in passages 1, 3 and 5. (B) Panel shows Lif medium concentrations from feeder cells from 15.5-day-old embryos in passages 1, 3 and 5. (C) Panel shows a comparison of Lif secretion between 13.5-day-old and 15.5-day-old NMRI embryos in passages 1, 3 and 5. (D) Panel shows Fgf2 concentrations, as measured using ELISA, in medium from feeder cells from 13.5-day-old embryos in passages 1, 3 and 5. (E) Panel shows Fgf2 medium concentrations from feeder cells from 15.5-day-old embryos in passages 1, 3 and 5. (F) Panel shows a comparison of Fgf2 secretion between 13.5-day-old and 15.5-day-old NMRI embryos in passages 1, 3 and 5. The results are presented as the mean ± standard deviation (SD) of three independent experiments; *P < 0.05, **P < 0.001.

As shown in Fig. 4(B), Lif was secreted most in passage 3 MEFs from 15.5-day-old NMRI embryos. The difference between the levels of secretion of this cytokine in passages 1 and 5 compared with passage 3 was significant (P < 0.05). The difference between the levels of Lif secretion between passages 1 and 5 was not significant.
A comparison of Lif secretion between passage 1 MEFs from 13.5-day-old and 15.5-day-old NMRI embryos showed greater secretion in MEFs from the 13.5-day-old embryos (P < 0.05). The highest level of Lif secretion between passage-3 MEFs from 13.5-day-old and 15.5-day-old was observed in passage 3 from the 15.5-day-old MEFs. However, there was higher Lif secretion in passage 5 of 15.5-day-old MEFs compared with 13.5-day-old MEFs (P < 0.001). The difference between the levels of Lif secretion between passage 5 MEFs from 13.5-day-old and 15.5-day-old NMRI embryos was not significant (Fig. 4C).
The lowest level of secretion of Fgf2 in MEFs isolated from 13.5-day-old NMRI embryos was observed in passage 1, which significantly differed from passages 3 and 5 MEFs (P < 0.05). There was no significant difference between passages 3 and 5 MEFs in Fgf2 protein secretion (Fig. 4D).
The highest level of Fgf2 secretion was observed in passage 5 MEFs of 15.5-day-old NMRI embryos, which was significantly different from passages 1 and 3 MEFs (P < 0.001). Although the secretion level of Fgf2 in passage 3 MEFs was more than that in passage 1, this increase was not significant (Fig. 4E).
As shown in Fig. 4(F), the expression levels of Fgf2 in passages 1, 3 and 5 of MEFs from 15.5-day-old NMRI embryos was higher than in the MEFs from 13.5-day-old embryos. This difference was not significant in passage 1; however, these differences were significant in passages 3 (P < 0.05) and 5 (P < 0.001).
Secretion of Lif and Fgf2 by MEFs from 13.5-day-old and 15.5-day-old C57BL/6 embryos in passages 1, 3 and 5
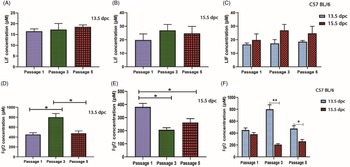
Although Lif secretion in MEFs from 13.5-day-old C57BL/6 embryos was highest for passage 5 MEFs, followed by passage 3 and passage 1, the difference between groups was not significant (Fig. 5A).
Lif and Fgf2 secretion by MEFs from 13.5-day-old and 15.5-day-old C57BL/6 embryos. (A) Panel shows Lif concentrations, as measured using ELISA, in medium from feeder cells from 13.5-day-old embryos in passages 1, 3 and 5. (B) Panel shows Lif medium concentrations from feeder cells from 15.5-day-old embryos in passages 1, 3 and 5. (C) Panel shows comparison of Lif secretion between 13.5-day-old and 15.5-day-old NMRI embryos in passages 1, 3 and 5. (D) Panel shows Fgf2 concentrations, as measured using ELISA, in medium from feeder cells from 13.5-day-old embryos in passages 1, 3 and 5. (E) Panel shows Fgf2 medium concentrations from feeder cells from 15.5-day-old embryos in passages 1, 3 and 5. (F) Panel shows a comparison of Fgf2 secretion between 13.5-day-old and 15.5-day-old NMRI embryos in passages 1, 3 and 5. The results are presented as the mean ± standard deviation (SD) of three independent experiments; *P < 0.05, **P < 0.001.

Lif secretion in 15.5-day-old MEFs from C57BL/6 embryos was higher in passage 3, followed by passage 5, then passage 1. However, no significant difference was observed between the studied groups (Fig. 5B).
A comparison of Lif secretion between passage 1 of MEFs from 13.5- and 15.5-day-old embryos showed that passage 3 of 13.5-day-old and 15.5-day-old MEFs and passage 5 of 13.5-day-old and 15.5-day-old MEFs of NMRI mice showed that the secretion level of this factor in all three passages in the 15.5-day-old MEFs was higher than the 13.5-day-old MEFs, but the difference between groups was not significant (Fig. 5C).
The highest secretion of Fgf2 was observed in passage 3 MEFs from 13.5-day-old C57BL/6 embryos, which was significant when compared with passages 1 and 5 (P < 0.05). The difference between the levels of secretion of this factor between passages 1 and 5 was not significant (Fig. 5D).
Figure 5(E) compares the level of Fgf2 secretion between passages 1, 3 and 5 of MEFs from 15.5-day-old C57BL/6 embryos. The highest expression of this cytokine was seen in passage 1, which was significantly different from passages 3 and 5 in the two MEF groups (P < 0.05). Despite the elevated secretion of Fgf2 in passage 5 compared with passage 3, this increase was not significant.
As shown in Fig. 5(F), Fgf2 secretion in passage 1 MEFs of the 13.5-day-old C57BL/6 embryos was greater than passage 1 MEFs of the 15.5-day-old, but this difference was not significant. The level of Fgf2 secretion was significantly higher in passage 3 MEFs of the 13.5-day-old embryos compared with the ones from 15.5-day-old embryos (P < 0.001). The level of Fgf2 secretion was higher in passage 5 MEFs of the 13.5-day-old embryos and showed a significant difference with 15.5-day-old MEFs (P < 0.05).
Comparison of the secretion Fgf2 and Lif by MEFs from 15.5-day-old NMRI and C57BL/6 embryos in passages 1, 3 and 5
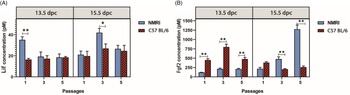
Figure 6(A) compares Lif cytokine secretion between passages 1, 3 and 5 of MEFs from 13.5-day-old and 15.5-day-old NMRI and C57BL/6 embryos. Lif secretion in the MEFs from 13.5-day-old embryos was only significant in passage 1 and higher in MEFs from NMRI embryos compared with C57BL/6 embryos (P < 0.001). No significant difference was observed between the levels of Lif secretion in passages 3 and 5 of the MEFs from 13.5-day-old NMRI and C57BL/6 embryos.
Comparison of Lif and Fgf2 secretions by MEFs from 13.5-day-old and 15.5-day-old C57BL/6 embryos between 13.5-day-old and 15.5-day-old NMRI embryos. (A) Panel shows the comparison of Lif concentration levels in assessed passages of MEFs from 13.5-day-old C57BL/6 embryos between 13.5-day-old NMRI embryos, as measured using ELISA, in medium from feeder cells from 13.5-day-old embryos in passages 1, 3 and 5. (B) Panel shows the comparison of Fgf2 medium concentration levels from feeder cells from 15.5-day-old embryos in passages 1, 3 and 5. The results are presented as the mean ± standard deviation (SD) of three independent experiments; *P < 0.05, **P < 0.001.

A comparison of Lif secretion in the studied passages of MEFs in 15.5-day-old NMRI and C57BL/6 embryos showed that Lif had higher expression in all three passages of MEFs from NMRI embryos compared with C57BL/6 embryos. The difference in secretion levels was significant only in passage 3 of the two groups (P < 0.05).
A comparison of the levels of Fgf2 secretion in passages 1, 3 and 5 of MEFs from 13.5-day-old NMRI embryos with those from 13.5-day-old embryos of C57BL/6 mice showed that Fgf2 secretion was significantly more in all three passages in the C57BL/6 MEFs than NMRI MEFs (P < 0.001). The secretion level of Fgf2 in passage 1 MEFs of 15.5-day-old C57BL/6 embryos was higher than in the NMRI embryo MEFs, but the difference between the two groups was not significant. The secretion of Fgf2 in passages 3 and 5 MEFs of the 15.5-day-old NMRI embryos was higher than the C57BL/6 MEFs and was significant for passages 3 and 5 (P < 0.001) (Fig. 6B).
Discussion
We investigated the expression levels of Fgf2, Bmp4, ActivinA, Lif and Tgfb genes as well as secretion levels of the Fgf2 protein and Lif cytokine in passages 1, 3 and 5 MEFs isolated from 13.5-day-old and 15.5-day-old embryos from NMRI and C57BL/6 mice. These strains of mice are commonly used for culturing ESCs and iPS cells. The study results were analyzed using mRNA extracted from cultured MEFs as well as standard culture medium for feeder cells. These results could be used as a basis for the development and optimization of cell cultures of different species.
Lif is a polypeptide cytokine that belongs to the interleukin-6 family in terms of structure and mechanism of action. This cytokine is one of the factors secreted by MEFs. The Lif receptor, called gp130, is phosphorylated and activated using the transcription factor STAT3 that regulates the transcription of genes involved in pluripotency by entering the nucleus (Ohtsuka et al., Reference Ohtsuka, Nakai-Futatsugi and Niwa2015).
Although MEFs have been used to isolate and culture PSCs from zebrafish (Sun et al., Reference Sun, Bradford, Ghosh, Collodi and Barnes1995), chickens (Pain et al., Reference Pain, Chenevier and Samarut1999), rabbits (Honda et al., Reference Honda, Hirose, Hatori, Matoba, Miyoshi, Inoue and Ogura2010; Honda, Reference Honda2013), rats (Ueda et al., Reference Ueda, Kawamata, Teratani, Shimizu, Tamai, Ogawa, Hayashi, Tsuda and Ochiya2008; Rajarajan et al., Reference Rajarajan, Engels and Wu2012), hamsters (Doetschman et al., Reference Doetschman, Williams and Maeda1988; Pei et al., Reference Pei, Fu, Hirai, Cho, O’Brien, Dutton, Verfaillie and Hu2017), goats (Ezashi et al., Reference Ezashi, Yuan and Roberts2016), sheep (Liu et al., Reference Liu, Balehosur, Murray, Kelly, Sumer and Verma2012), pigs (Rajarajan et al., Reference Rajarajan, Engels and Wu2012; Ezashi et al., Reference Ezashi, Yuan and Roberts2016), miniature pigs (Li et al., Reference Li, Ma, Hou, Sun, Sun and Wang2004), cattle (Ezashi et al., Reference Ezashi, Yuan and Roberts2016), horses (Ezashi et al., Reference Ezashi, Yuan and Roberts2016), mice (Evans and Kaufman, Reference Evans and Kaufman1981; Martin, Reference Martin1981; Rajarajan et al., Reference Rajarajan, Engels and Wu2012) and humans (Thomson et al., Reference Thomson, Itskovitz-Eldor, Shapiro, Waknitz, Swiergiel, Marshall and Jones1998; Rajarajan et al., Reference Rajarajan, Engels and Wu2012), studies have shown that in mice (Evans and Kaufman, Reference Evans and Kaufman1981; Martin, Reference Martin1981; Rajarajan et al., Reference Rajarajan, Engels and Wu2012), chickens (Park and Han, Reference Park and Han2000; Fuet and Pain, Reference Fuet and Pain2017), pigs (Ezashi et al., Reference Ezashi, Yuan and Roberts2016), dogs (Ezashi et al., Reference Ezashi, Yuan and Roberts2016), goats (Ezashi et al., Reference Ezashi, Yuan and Roberts2016), sheep (Liu et al., Reference Liu, Balehosur, Murray, Kelly, Sumer and Verma2012), hamsters (Pei et al., Reference Pei, Fu, Hirai, Cho, O’Brien, Dutton, Verfaillie and Hu2017), bovine (Ezashi et al., Reference Ezashi, Yuan and Roberts2016), buffalo (Sharma et al., Reference Sharma, George, Kamble, Singh, Chauhan, Singla, Manik and Palta2011) and rabbits (Honda et al., Reference Honda, Hirose, Hatori, Matoba, Miyoshi, Inoue and Ogura2010; Honda, Reference Honda2013), Lif secreted from feeder cell MEFs had positive effects on the isolation and culture of ESCs and iPS. Several studies have explicitly stated that this factor showed no effect on the isolation of PSCs from humans (Thomson et al., Reference Thomson, Itskovitz-Eldor, Shapiro, Waknitz, Swiergiel, Marshall and Jones1998; Rajarajan et al., Reference Rajarajan, Engels and Wu2012), ovine (Ezashi et al., Reference Ezashi, Yuan and Roberts2016), horses (Li et al., Reference Li, Zhou, Imreh, Ährlund-Richter and Allen2006), cattle (Gómez et al., Reference Gómez, Serrano, Pope, Jenkins, Biancardi, López, Dumas, Galiguis and Dresser2010; Dutton et al., Reference Dutton, Dudhia, Guest and Connolly2019), monkeys (Pau and Wolf, Reference Pau and Wolf2004; Shimozawa et al., Reference Shimozawa, Ono, Shimada, Shibata, Takahashi, Inada, Takada, Nosaka and Yasutomi2013) and mice EpiSCs (Tesar et al., Reference Tesar, Chenoweth, Brook, Davies, Evans, Mack, Gardner and McKay2007).
In our results, we observed inconsistencies in the expression levels of Lif mRNA and protein in feeder cells and condition medium. Studies have shown that no direct correlation has been found between protein concentration and mRNA and this difference between mRNA and protein concentration was due to factors such as the differences in half-life of mRNA and protein in the cell (protein half-life is higher than mRNA), translation regulation, mRNA degradation, regulation of post-transcription protein, translation and degradation of the resulting protein (Vogel and Marcotte, Reference Vogel and Marcotte2012).
As for Lif, Fgf2 is secreted using MEFs (Li et al., Reference Li, Zhang, Hou, Jiao, Zheng and Wang2003). Fgf2 inhibits spontaneous differentiation and enhances the proliferation and viability of ESCs through receptors that activate the protein tyrosine kinase (Schmitt et al., Reference Schmitt, Bruyns and Snodgrass1991). While Fgf2 can effectively preserve monkey (Pau and Wolf, Reference Pau and Wolf2004; Shimozawa et al., Reference Shimozawa, Ono, Shimada, Shibata, Takahashi, Inada, Takada, Nosaka and Yasutomi2013), rat (Li et al., Reference Li, Yang, Gu, Ma and Jin2009), sheep iPS (Liu et al., Reference Liu, Balehosur, Murray, Kelly, Sumer and Verma2012), cattle iPS (Ezashi et al., Reference Ezashi, Yuan and Roberts2016) and rabbit (Honda et al., Reference Honda, Hirose and Ogura2009) stem cells, it induces differentiation in mice stem cells (Ginis et al., Reference Ginis, Luo, Miura, Thies, Brandenberger, Gerecht-Nir, Amit, Hoke, Carpenter, Itskovitz-Eldor and Rao2004). In buffalo ESCs, it results in survival (Sharma et al., Reference Sharma, George, Kamble, Singh, Chauhan, Singla, Manik and Palta2011) and has shown negative impacts on horse ESCs (Abavisani et al., Reference Abavisani, McKinnon, Tecirlioglu, Trounson and Guo2010). Fgf2 can stimulate the proliferation of ESCs in pigs (Li et al., Reference Li, Ma, Hou, Sun, Sun and Wang2004) and cows (Gjørret and Maddox-Hyttel, 2004). The results of a study have indicated that Fgf2 enhances the ability to bind and form colonies of human ESCs (hESCs) (Xu et al., Reference Xu, Peck, Li, Feng, Ludwig and Thomson2005; Rajarajan et al., Reference Rajarajan, Engels and Wu2012) and mouse EpiSCs (Tesar et al., Reference Tesar, Chenoweth, Brook, Davies, Evans, Mack, Gardner and McKay2007) at the early stages of development, which supports proliferation and maintenance of hESCs and mouse EpiSCs self-renewal. It has been shown that Fgf2 content was moderately increased during the initial period of hESC inoculation in the MEF (Yang et al., Reference Yang, Qiu, Zeng, Ding, Zeng, Lu and Li2016).
In studies conducted by Eisellova and colleagues (Eiselleova et al., 2004) and Dvorak et al. (Reference Dvorak, Dvorakova, Koskova, Vodinska, Najvirtova, Krekac and Hampl2005) it was shown that, despite the expression of the Fgf2 gene in MEFs, there was no Fgf2 protein found in the condition medium isolated from these cells, which was inconsistent with the present study results. A study also has shown that Fgf2 content from feeders cells derived mouse is not significant (Teotia et al., Reference Teotia, Sharma, Airan and Mohanty2016). This difference in protein expression was probably due to the use of different mice strains in their study.
Our results showed inconsistencies in the expression of Fgf2 RNA and protein in feeder cells and condition medium. This finding might be due to the antisense of Fgf2 mRNA involved in post-transcriptional regulation of Fgf2 expression (Barclay et al., Reference Barclay, Li, Geldenhuys, Baguma-Nibasheka, Porter, Veugelers, Murphy and Casson2005).
In the present study, levels of Lif and Fgf2 secretion were different between assessed passages. In explaining the different behaviour of these groups, it can be said that the wide distribution and number of microtubules in the feeder layer may determine their cell function and behaviour. In other words, the secretory activity of cells is related to cell microtubules. The cells with more microtubules have higher secretory activity and microtubules are needed by cells to transfer secretory cytokines to the extracellular fluid and finally to the culture medium (Li et al., Reference Li, Ma, Hou, Sun, Sun and Wang2004). It seems that amount of microtubules in feeder cells of passages 1, 3 and 5 may be different, but this requires further investigation at the cell molecular level.
Members of the TGF-β superfamily such as Tgfb1, ActivinA and Bmp4 have been identified as regulators of some of the most important developmental interactions. Specifically, Bmp4 plays important roles in a variety of biological processes such as proliferation, apoptosis, differentiation and morphogenesis (Zarei Fard et al., Reference Zarei Fard, Talaei-Khozani, Bahmanpour and Esmaeilpour2015). One of the mechanisms of the Bmp4 effect is through phosphorylation of Smad proteins. However, Bmp4 may also play a role in mitosis and cell survival by induction of some protein kinase-dependent genes (Zarei Fard et al., Reference Zarei Fard, Talaei-Khozani, Bahmanpour and Esmaeilpour2015). Studies have shown that the effects of Bmp4 on the function of stem cell types are culture method (Tilgner et al., Reference Tilgner, Atkinson, Golebiewska, Stojković, Lako and Armstrong2008), and dose and time dependent (Zarei Fard et al., Reference Zarei Fard, Talaei-Khozani, Bahmanpour and Esmaeilpour2015) and different species show different behaviours against Bmp4. Bmp4 plays an essential role in the maintenance of mouse and rat ESCs pluripotency (Zarei Fard et al., Reference Zarei Fard, Talaei-Khozani, Bahmanpour and Esmaeilpour2015), but in rabbit ESCs differentiates these cells into trophoblasts (Tao et al., Reference Tao, Yang, Zhang, Wang, Tang and Ji2008). The short-term effect of this factor on hESCs causes these cells to differentiate into mesoderm (Zhang et al., Reference Zhang, Li, Tan, Wang, Liu, Chen, Yong, Jiang, Sun, Du, Ding and Deng2008), whereas the long-term effect of Bmp4 on hESCs induces trophectoderm differentiation in these cells (Xu et al., Reference Xu, Chen, Li, Li, Addicks, Glennon, Zwaka and Thomson2002). A study has shown that Bmp4 induces differentiation to the primary ectoderm in monkey ESCs (Kobayashi et al., Reference Kobayashi, Takada, Takahashi, Noda and Torii2008). The suppression of Bmp4 in ESCs and iPS of pigs has been shown to increase the pluripotency properties of these cells (Choi et al., Reference Choi, Lee, Kim, Woo, Kim and Lee2019).
Activin A is one of the important factors involved in growth and maintenance of the pluripotency state of hESCs. This factor is largely secreted by MEFs (Beattie et al., Reference Beattie, Lopez, Bucay, Hinton, Firpo, King and Hayek2005). ActivinA stimulates the transcription factors of OCT4 and NANOG in hESCs and mouse EpiSCs. Activin A in these cells stimulates the expression of growth factors such as Nodal, Wnt3, Bfgf and Fgf8 (Xiao et al., Reference Xiao, Yuan and Sharkis2006). Activin A in murine ESCs clearly induced differentiation into mesendoderm, endoderm (Sulzbacher et al., Reference Sulzbacher, Schroeder, Truong and Wobus2009). Studies have also shown that one of the most important factors that affects the differentiation efficiency of hESCs is Activin A (Beattie et al., Reference Beattie, Lopez, Bucay, Hinton, Firpo, King and Hayek2005), which may play a role in enhancing cell proliferation by enhancing Activin A levels to increase cell proliferation. Activin A inhibits neural differentiation (Hashimoto et al., Reference Hashimoto, Kondo, Sakurai, Etoh, Shibai and Muramatsu1990). The secretion of low levels of Activin A by MEF accelerates the differentiation of hESCs into retinal pigment epithelial cells (Hongisto et al., Reference Hongisto, Mikhailova, Hiidenmaa, Ilmarinen and Skottman2012). Activin A also helps to preserve pluripotency and the proliferative potential of hiPS cells (Tomizawa et al., Reference Tomizawa, Shinozaki, Sugiyama, Yamamoto, Sueishi and Yoshida2011). It is also required for the separation and maintenance of pig (Yang et al., Reference Yang, Wang, Wang, Yu and Wang2017) and rat ESCs (Li et al., Reference Li, Yang, Gu, Ma and Jin2009) as well as self-renewal and reprogramming of pig cells to produce pluripotent cells (Yang et al., Reference Yang, Wang, Wang, Yu and Wang2017). However, this factor has no effect on the growth of pig ESCs but is strongly needed to maintain the cell’s undifferentiated state (Choi et al., Reference Choi, Lee, Kim, Woo, Kim and Lee2019).
As for Activin A, Tgfb1 is one of several growth factors that helps to maintain hESCs and mouse EpiSCs in the undifferentiated state (Saha et al., Reference Saha, Ji, De Pablo and Palecek2008). A study has shown that the combination of Tgfb1 and Activin A suppresses spontaneous differentiation of hESCs (Saha et al., Reference Saha, Ji, De Pablo and Palecek2008). Both of these factors inhibit the differentiation of embryonic bodies derived from hESCs into endoderm and ectoderm cells, but stimulates differentiation into mesoderm (muscle) cells (Schuldiner et al., Reference Schuldiner, Yanuka, Itskovitz-Eldor, Melton and Benvenisty2000).
This study showed that the expression levels of Fgf2, Bmp4, ActivinA, Lif and Tgfb genes, as well as the level of the Fgf2 protein and Lif cytokine secretion in the passages, for mice of similar ages, between the two mice strains were different. Schnabel and colleagues showed that the genetic background of mice affected the efficiency of producing iPS from MEFs, the pluripotency stability of isolated cells, the efficiency of iPS cell production and the pluripotent stability of fibroblasts with a different genetic background. This was due to differences in the proliferation of parent MEFs with different genetic backgrounds (Schnabel et al., Reference Schnabel, Abratte, Schimenti, Southard and Fortier2012). In another study, feeder cells isolated from different mice strains had different effects on the proliferation and colony formation of spermatogonial cells cultured on these cells (Azizi et al., Reference Azizi, Hamidabadi and Skutella2019). On the one hand, it has been shown that the treatment of MEFs with mitomycin C could change the expressions and concentrations of growth factors in the culture medium (Xie et al., Reference Xie, Lin, Luo, Luo and Lu2004). On the other hand, previous studies have shown that cells from different mice strains showed different behaviours to toxins and medications (Assadollahi et al., Reference Assadollahi, Mohammadi, Fathi, Hassanzadeh, Erfan, Soleimani, Banafshi, Yosefi and Allahvaisi2019c). According to these studies, it seems that the differences in expression levels of the studied genes and the secretion of Fgf2 and Lif factors in the similar groups between the two strains was related to the genetic background of these two strains.
In summary, the present study showed that expression levels of Fgf2, Bmp4, ActivinA, Lif and Tgfb genes and secretion of Fgf2 and Lif factors were affected by age of embryo, MEF cell passage number and genetic background of mice and also showed different results. According to the study results, we suggest that researchers use mice embryos that have different genetic backgrounds, in addition to different MEF passages, when producing MEFs based on the application and type of their study.
Ethical standards
All animal procedures were conducted according to the Guidelines approved by the Ethics committee of Kurdistan University of Medical Sciences.
Acknowledgements
This study, as an MSc thesis, was funded by grants provided from Kurdistan University of Medical Sciences (No. IR.MUK.REC.1396/311). We express our appreciation to all members of the Cellular and Molecular Research Center for their helpful consultation and deliberation during this work.
Funding
Kurdistan University of Medical Sciences (No. IR.MUK.REC.1396/311).
Conflicts of interest
The authors declare they have no competing financial interests.