Small ruminants are often used as models for cows to study basic aspects of Ca homoeostasis. However, there are differences in homeostatic mechanisms between goats and sheep that need to be considered before any results can be extrapolated to dairy cows, especially with respect to the transition period.
On a body weight basis the milk yield of dairy goats is comparable to that of dairy cows and hypocalcaemia occurs in both species usually at the onset of lactation, while sheep develop hypocalcaemia more often during late gestation (Oetzel, Reference Oetzel1988). But when comparing feeding behaviour, cattle and sheep can be regarded as grazers, while goats in their natural habitat select high energy (concentrate) feed (Hofmann, Reference Hofmann1989). These differences in feed type might influence gastrointestinal mineral absorption as it has been shown that goats adapt more efficiently to dietary Ca restriction by up-regulating intestinal Ca transport than sheep (Wilkens et al. Reference Wilkens, Mrochen, Breves and Schroder2011, Reference Wilkens, Richter, Fraser, Liesegang, Breves and Schröder2012b). Interestingly, it has also been reported that a reduction in Ca supply did not lead to an increase in apparent digestibility of Ca in lactating cows (Taylor et al. Reference Taylor, Knowlton, McGilliard, Swecker, Ferguson, Wu and Hanigan2009).
Comparative data on the response of different ruminant species to the challenge to Ca homeostatic mechanisms at the onset of lactation are limited. In studies investigating bone metabolism in goats and sheep it has been demonstrated that around parturition sheep tend to have greater concentrations of bone resorption markers and more pronounced depression of bone formation markers in blood compared with goats (Liesegang et al. Reference Liesegang, Risteli and Wanner2006, Reference Liesegang, Risteli and Wanner2007).
As milk fever in dairy cows is associated very closely with parturition, it was the aim of the present study to investigate changes in plasma parameters of Ca homeostasis during the peripartal period in sheep and goats by taking samples at shorter intervals than was done in the studies mentioned above, and to compare them with respective data from cows. Based on our former studies we hypothesised that there would be differences in the response to the peripartal challenge of Ca homeostasis which cannot be simply explained by the higher milk yield usually observed in goats and cows.
Besides ionised and total Ca and phosphate in plasma, concentrations of calcitriol, the biologically active metabolite of vitamin D, were determined. Furthermore, the bone markers were addressed. Bone turnover or remodelling means concurrent bone formation and resorption (Allen, Reference Allen2003). As absolute values of biochemical markers of bone metabolism are influenced by various factors such as age, circadian rhythms and season (Hannon & Eastell, Reference Hannon and Eastell2000) the ratio of osteocalcin to CrossLaps® was used to assess bone turnover. The ratio of bone formation markers to bone resorption markers has been used before to estimate the status of bone remodelling in horses and cows (Lepage et al. Reference Lepage, Hartmann, Eicher, Uebelhart, Tschudi and Uebelhart1998; Liesegang et al. Reference Liesegang, Eicher, Sassi, Risteli, Kraenzlin, Riond and Wanner2000).
Material and methods
Animals, diets, milking pattern and blood sampling
The study was carried out with 5–6 multiparous animals of each species (sheep, goats and cows) aged between 2 and 5 years. All animals were of breeds used for milk production in Central Europe: East Friesian dairy sheep, Saanen type goats and Holstein-Friesian cows. Average body weights were 66·3±1·6 kg (sheep), 49·1±1·7 kg (goats) and 679±25 kg (cows).
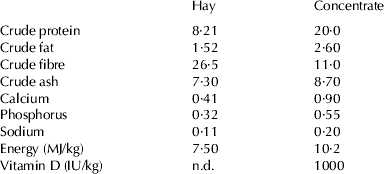
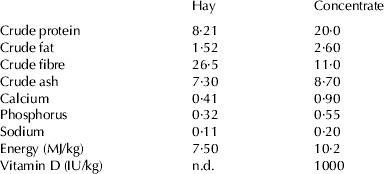
Sheep and goats were housed in a free-stall barn at the Department of Physiology of the University of Veterinary Medicine, Foundation, Hanover, Germany. During the entire observation period, the animals had access to hay (Table 1), minerals and water ad libitum. The animals were group-fed prepartum, receiving 75 g concentrate (Table 1) per 10 kg body weight per day.
Composition of hay and concentrate fed to sheep and goats expressed as percentage of original substance; n.d.: not detectable using standard procedures
Immediately after parturition, the kids and lambs were removed and milk yield was recorded for 20 consecutive days. Ewes and does were milked and provided with concentrate three times daily at 8.00, 14.00 and 20.00. The amount of concentrate was calculated for each individual animal according to the milk yield of the previous milking (800 g/kg milk) to meet the requirements for dairy sheep and goats recommended by the Society of Nutrition Physiology (GfE).
Data from cows were obtained from a previous study (Wilkens et al. Reference Wilkens, Oberheide, Schroder, Azem, Steinberg and Breves2012a). The cows were kept on a commercial dairy farm located in Saxony, Germany. They were fed a total mixed ration ad libitum before and after parturition [Ca content a.p.: 7·8 g/kg dry matter (DM); Ca content p.p.: 10·0 g/kg DM]. Calves were removed within 24 h post partum, after which milking was done twice daily. In the present study, the peripartal plasma parameters of 6 cows of the former control group were compared with respective values from the small ruminants.
From calculated gestational day 140 (sheep and goats) or day 175 (cows), two blood samples (lithium heparin and EDTA) were collected from the jugular (sheep and goats) or coccygeal vein (cows), every other day at 9·00 until day 10 post partum. Additional samples were taken immediately after parturition and at 6, 12 and 24 h post partum. The prepartum samples were re-classified according to the exact day of parturition. Samples taken on days 2 and 1 prepartum were classified as sample day −2, samples taken on days 4 and 3 as sample day −4, etc.
A further 6 goats and 5 sheep, of the same age and breed were sampled after 3 months of lactation. They were then dried off and sampled again 6 weeks later.
The protocol of animal treatment was approved by the Animal Welfare Commissioner of the University of Veterinary Medicine, Foundation, Hanover, Germany, and its conduct was supervised according to German Animal Welfare Law.
Sample analysis
After measuring ionised Ca in whole blood with a blood gas analyser (Chiron Diagnostics, RapidLab™ 348), samples were centrifuged at 2000 g at ambient temperature for 15 min and plasma was collected and stored at −18 °C.
Concentrations of phosphate and total Ca in plasma of sheep and goats were measured colourimetrically by standard spectrometric techniques (Sarkar & Chauhan, Reference Sarkar and Chauhan1967; Kruse-Jarres, Reference Kruse-Jarres1979) while total Ca and phosphate concentrations in the plasma samples from cows were determined by standard diagnostic methods in the laboratory of the Clinic for Cattle of the University of Veterinary Medicine, Foundation, in Hannover.
Plasma calcitriol of sheep and goats was measured with a commercial radioreceptor assay (Immundiagnostik AG, Bensheim, Germany). Quantification of the bone formation marker osteocalcin and the bone resorption marker CrossLaps® was done using commercial enzyme-linked immunosorbent assay kits according to the manufacturer's instructions (MicroVueTM Osteocalcin EIA Kit, Quidel® Corporation, Santa Clara, USA; Serum CrossLaps®, IDS Ltd, Frankfurt am Main, Germany).
Data presentation and statistical analysis
Data are presented as mean±sem. The daily milk yield of sheep and goats is corrected for the animals’ body weights (BW).
All statistical analyses were performed using GraphPad Prism® 5.0 (GraphPad Software, San Diego CA, USA). Gaussian distribution according to Kolmogorov–Smirnov was confirmed for all data. Comparison of peripartal ionised and total Ca, phosphate, CrossLaps® and osteocalcin plasma concentrations was carried out by analysis of variance (ANOVA) for repeated measurements with a saturated model of the fixed factor species. Bonferroni post-test was applied to reveal species differences at each time point and differences over time within each species. In all cases, P values <0·05 were considered statistically significant.
Results
Milk yield
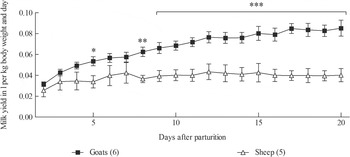
Three of the 5 ewes and 5 of the 6 does produced twins, while the remaining small ruminants and all the cows had single offspring. Milk yield was not affected by the number of offspring. There was no significant difference in milk yield between the sheep and goats over the first few days after parturition. However, daily milk production of the goats then increased to a maximum of 0·085 l/kg BW, whereas that of the ewes remained more or less constant at a level of 0·04 l/kg BW (Fig. 1).
Daily milk yield of goats and sheep normalised to the animals’ body weight. RM ANOVA revealed significant effects of time (P<0·001), species (P<0·001) and an interaction of time and species (P<0·001). Significant differences between species revealed by Bonferroni post-test for each day are marked with asterisks (P<0·05: *; P<0·01: **; P<0·001: ***). Values are means±sem.

Macro minerals in blood and plasma
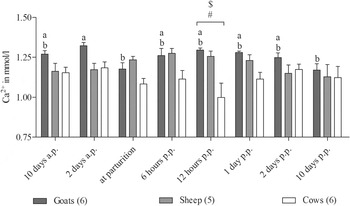
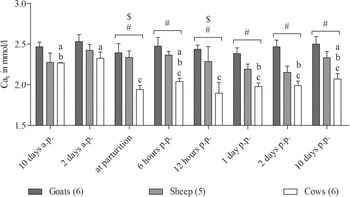
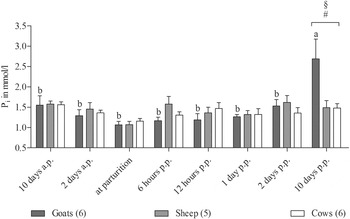
Whole blood and plasma concentrations of ionised and total Ca and phosphate measured in sheep, goats and cows around parturition are given in Figs. 2–4.
Blood concentrations of ionised calcium measured in goats, sheep and cows around parturition. RM ANOVA revealed significant effects of species (P<0·01) and an interaction of time and species (P<0·05). Different letters represent significant differences within one species. The symbols # and $ indicate significant differences between cows and goats (#) or sheep ($), respectively. Values are means±sem.

Plasma concentrations of total calcium measured in goats, sheep and cows around parturition. RM ANOVA revealed significant effects of time (P<0·001) and species (P<0·001). Different letters represent significant differences within one species. The symbols # and $ indicate significant differences between cows and goats (#) or sheep ($), respectively. Values are means±sem.

Plasma concentrations of phosphate measured in goats, sheep and cows around parturition. RM ANOVA revealed significant effects of time (P<0·001) and an interaction of time and species (P<0·001). Different letters represent significant differences within one species. The symbols # and § indicate significant differences between goats and cows (#) or sheep (§), respectively. Values are means±sem.

Compared with day 2 prepartum, ionised Ca measured in whole blood of goats showed a significant decrease at parturition and also on the day 10 post partum. There was no similar change in ionised Ca associated with lambing in ewes. The transient decrease observed in cows with a minimum at 12 h post partum was not statistically significant because of high individual variances, but compared with sheep and goats postpartum ionised Ca in cows was significantly lower.
However, the great challenge of Ca homeostasis in cows at parturition becomes obvious when the plasma concentrations of total Ca are considered.
In all species, a small, but not statistically significant decrease in plasma phosphate was observed at parturition. Intriguingly, a pronounced increase in plasma phosphate was found on the day 10 post partum in goats.
Calcitriol
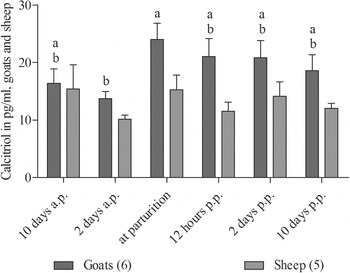
The profile of plasma concentrations showed that in goats, calcitriol was highest at parturition while sheep showed no significant changes and cows showed the highest calcitriol levels on the day 2 post partum (Fig. 5).
Plasma concentrations of calcitriol measured in goats and sheep around parturition. RM ANOVA revealed significant effects of time (P<0·05) and species (P<0·05). Different letters represent significant differences within one species. Values are means±sem.

Markers of bone formation and resorption
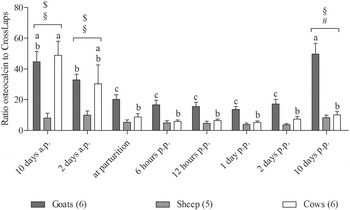
The ratio of the bone formation marker osteocalcin to the bone resorption marker CrossLaps® is given in Fig. 6. In sheep plasma, a very low ratio was found throughout the entire observation period, while goats and cows had significantly greater ratios during the last gestational days which then decreased at parturition. On the day 10 post partum basal values were found again in goats, while in cows osteocalcin to Crosslaps® ratios remained as low as those of sheep.
Ratio between plasma concentrations of osteocalcin and CrossLaps® measured in goats, sheep and cows around parturition. RM ANOVA revealed significant effects of time (P<0·001), species (P<0·001) and an interaction of time and species (P<0·001). Different letters represent significant differences within one species. The symbols #, $ and § indicate significant differences between goats and cows (#), sheep and cows ($) or sheep and goats (§), respectively. Values are means±sem.

Effects of terminating lactation
Comparisons of plasma concentrations of total Ca, phosphate, calcitriol and the ratio of osteocalcin to CrossLaps® in ewes and does after 3 months of lactation and 6 weeks after the end of lactation are presented in Table 2.
Total calcium (mmol/l), phosphate (mmol/l), calcitriol (pg/ml) and the ration between osteocalcin (ng/ml) and Crosslaps® (ng/ml) in plasma of goats and sheep measured after 3 months in milk and 6 weeks after having been dried-off, respectively. Results of two-way ANOVA (species, effect of lactation and interaction)

Values are means±sem
† n.s. not significant (P>0·05)
Plasma concentrations of total Ca were not affected by lactation status. However, lower concentrations were found in both groups of sheep compared with goats. Both species showed a small increase in plasma phosphate after lactation had ceased. While no effects of lactation status were found on calcitriol concentrations, the ratio of osteocalcin to CrossLaps® increased markedly in both species after lactation had ceased. In contrast to peripartal values, there were no species differences in these bone marker ratios in non-lactating animals.
Discussion
There is a sudden increase in the outflow of Ca from blood at the onset of lactation compared with the last days of gestation (Horst et al. Reference Horst, Goff and Reinhardt2005). The resulting transient decrease in plasma Ca at parturition and shortly after has been described for cows in numerous studies (Reinhardt et al. Reference Reinhardt, Lippolis, McCluskey, Goff and Horst2011).
The discrepancy between ionised and total Ca in cows after parturition in the present study could be explained by factors caused by the negative energy balance almost always reported for cows in early lactation (Butler & Smith, Reference Butler and Smith1989). For example, alterations of plasma albumin or pH might have affected the ratio between ionised and total Ca. In contrast to the group-fed dairy cows, the small ruminants were fed individually according to their milk yield.
The absence of such a depression of Ca at parturition in sheep has already been reported (Liesegang, Reference Liesegang2008). This might suggest that in contrast to goats and cows there is no particular challenge to the mechanisms of Ca homeostasis at lambing due to the secretion of Ca in milk. However, as there were only minor differences in milk production between sheep and goats immediately after parturition, it is unlikely that the Ca demand for milk production during the first 24 h p.p. was very much higher in goats compared with sheep. The daily placental transfer in ewes between days 133 and 140 of gestation has been shown to amount for 255 mg/kg fetal BW (Durand et al. Reference Durand, Braithwaite and Barlet1983). Assuming a Ca concentration of 2·5 g/l in colostrum (Liesegang, Reference Liesegang2008), for the sheep in the present study the loss of Ca into the milk was approximately 4 g on the first day p.p. compared with an estimated daily demand of 2 g for late gestation.
But in contrast to does and cows, the osteocalcin to CrossLaps® ratio in ewes was already very low at the end of gestation. Since in non-lactating animals there were no differences between goats and sheep, this low formation to resorption marker ratio is most probably not characteristic for sheep in general nor caused by variations in the sensitivities of the ELISA kits. The time course of the osteocalcin to CrossLaps® ratio around parturition more probably suggests that in ewes the Ca homeostatic mechanisms have already been challenged before lambing and there may have been a greater contribution of the skeleton to maintenance of Ca homeostasis than in the other two ruminant species. This is in line with the clinical observation that ewes often develop hypocalcaemia during the last days before lambing when the fetal skeleton is mineralised (Oetzel, Reference Oetzel1988) and that the peripartal plasma Ca concentrations are lower in twin-bearing than in single-bearing ewes (Raoofi et al. Reference Raoofi, Jafarian, Safi and Vatankhah2013).
However, all of the goats except one in the present study also produced twins. As it has already been demonstrated that goats have a greater ability to adapt to dietary Ca restriction than sheep (Wilkens et al. Reference Wilkens, Richter, Fraser, Liesegang, Breves and Schröder2012b), it may be that the does were better adapted than sheep to the enhanced Ca demand of fetal bone growth in late pregnancy. The onset of lactation induced a small decrease in ionised Ca accompanied by a concurrent increase in calcitriol in does. A decrease in ionised Ca leads to a secretion of parathyroid hormone (PTH) which than stimulates the renal 1α-hydroxylase, the enzyme needed for the transformation of 25-hydroxyvitamin D to 1,25-dihydroxyvitamin D, the active hormone calcitriol (Fraser & Kodicek, Reference Fraser and Kodicek1970).
Assuming that Ca homeostasis in ewes had already been severely challenged before parturition, one would expect a calcitriol response occurring even earlier in these animals. However, this was not the case. Lower calcitriol concentrations in sheep compared with goats experiencing the same dietary Ca restriction have already been demonstrated (Wilkens et al. Reference Wilkens, Mrochen, Breves and Schroder2010, Reference Wilkens, Richter, Fraser, Liesegang, Breves and Schröder2012b). As there is no suitable assay available for the determination of PTH in small ruminant species, it is difficult to uncover the reasons for this phenomenon.
In cows and goats bone resorption seemed to be induced not before parturition. But while goats reached pre-kidding values on day 10 post partum again, osteocalcin to CrossLaps® ratios remained very low in cows and sheep. This might point to are more rapid stimulation of gastrointestinal Ca absorption in goats allowing the animals do reduce bone mobilisation again. For sheep it has been shown that the maximal efficiency of gastrointestinal Ca absorption was reached 2 months after parturition, although bone resorption had already been stimulated before lambing (Braithwaite et al. Reference Braithwaite, Glascock and Riazuddin1970). Comparable balance studies carried out with goats are not available. In cows a significant increase of gastrointestinal Ca absorption was found to take place 1 week post partum (van´t Klooster, Reference Van´t Klooster1976) or between days 10 and 20 after parturition, respectively (Ramberg et al. Reference Ramberg, Mayer, Kronfeld, Phang and Berman1970). It should be taken into account that these data were obtained some time ago when milk production in dairy cows was not as high as nowadays. Against the background of the low osteocalcin to CrossLaps® ratios found in cows on the day 10 post partum it might be speculated that bone mobilisation was more prolonged in cows of the present study.
The reason for the slight decrease in plasma phosphate observed in all species is usually assumed to represent a loss of phosphate to the milk (Robertson et al. Reference Robertson, Marr and Moodie1956). Furthermore, it has been shown that a decrease in plasma Ca induces a concurrent increase in cortisol. Cortisol was demonstrated to have an impact on plasma phosphate (Horst & Jorgensen, Reference Horst and Jorgensen1982). No satisfying explanation could be found for the increase in plasma phosphate concentrations on day 10 post partum in goats. As the blood concentration of ionised Ca showed a second decrease on day 10 also, these alterations might be associated with the steep rise in milk production observed in does between days 7 and 12 after parturition. The role of phosphate in lactating animals is not yet fully understood. In contrast to Ca, plasma concentrations of phosphate are not that strictly controlled and the exchange between the different pools is more complicated. Phosphate is not only mobilised from bone, but also from soft tissues and in ruminants large amounts of phosphate secreted via the salivary glands and reabsorbed again in the gastrointestinal tract have to be taken into account (Braithwaite, Reference Braithwaite1983). However, the effect of drying-off on plasma phosphate underlines that it might be influenced by the hormonal regulation mechanisms involved in lactation and bone metabolism.
Conclusion
We could demonstrate that, in line with former studies, sheep seem not to respond with an adequate stimulation of calcitriol synthesis to challenges of Ca homeostasis. Furthermore, striking differences regarding peripartal bone metabolism were observed between the three ruminant species investigated. To evaluate whether sheep or goats are the better model for studying Ca homeostasis in the dairy cow, further studies under more controlled feeding regimes of the cows and a larger number of animals are needed.
The financial support of the Deutsche Forschungsgemeinschaft (SCHR 342/8-2) is gratefully acknowledged.