Introduction
‘The RMI, I tell you, really it is crumbs, one cannot live with that. I don't
know how such things can be done, you know? What more can I say? Me, I didn't
even think things like this were possible, I didn't even think they existed.’
(Author's translation; 61-year-old French woman, minimum income benefit
beneficiary for the last two years; quoted in Duvoux, Reference Duvoux2009: 166)
Childless working-age adults who are deemed able to work and rely on social assistance for an income are among the poorest persons in advanced democracies. In most countries, their disposable income falls well below the poverty line, sometimes giving them not even half of what it takes to escape poverty. In the early days of the welfare state, welfare incomes tended to be associated with some definition of needs, to give these persons an access to the basic necessities but, over time, this connection with needs has receded. Welfare incomes have evolved haltingly and incrementally, as they were, or were not, adjusted for the evolution of consumption norms and for inflation, and as successive governments worried more about work incentives than needs (Walker, Reference Walker1993: 41–56; Van Mechelen and Marchal, Reference Van Mechelen, Marchal, Marx and Nelson2013: 38–40). The general trend after 1990 was downward, with increasingly inadequate benefits (Nelson, Reference Nelson2013). In most countries, sanctions were also introduced to further reduce benefits for claimants who failed to comply with behavioral rules, usually associated with activation measures (Immervoll, Reference Immervoll2009: 32).
We do not know much, however, about the politics of welfare incomes. We may presume that it is congruent with the general politics of the welfare state, or with the left-right politics of redistribution, but we do not really know. Like poverty, welfare incomes have remained on the edge of welfare state research, because scholars focused on the social insurance programmes that covered the majority of citizens. They assumed that these broad transfers defined the welfare state and that, over time, they would make social assistance and poverty increasingly marginal (Marx and Nelson, Reference Marx, Nelson, Marx and Nelson2013: 7). In his seminal book on welfare regimes, for instance, Gøsta Esping-Andersen paid little attention to social assistance (Reference Esping-Andersen1990). By his standards, these programmes were all alike, everywhere residual and means-tested.
This article seeks to demonstrate that there is indeed a politics of social assistance in advanced welfare states, and that this politics is an instance of the broader conflict between the left and the right over the market, the state and social justice. In other words, the democratic class struggle over the welfare state reaches out to the poorest, protecting them better in countries where solidarity among citizens is better achieved.
To build this demonstration, the article focuses not on social assistance per se, but on minimum income protection (MIP), that is to say the disposable income a person obtains when on social assistance, including the programme's benefits but also other cash or in-kind benefits that may be allocated directly or through the tax system. Minimum income protection data provide a more reliable comparative picture, because they encompass all transfers aimed at social assistance recipients. The study also concentrates on single adults considered able to work, to better isolate minimum income protection from other considerations, related in particular to family policy or national approaches toward disability.Footnote 1 Able-to-work single adults without market income or assets – and not eligible for unemployment insurance – are the arch-typical ‘undeserving’ poor, the least favoured of all social transfers beneficiaries. As such, they constitute the best case to test a society's commitment to redistribution.
Comparative data on minimum income protection remain relatively scarce. This article relies on the most encompassing and reliable source, the Social Assistance and Minimum Income Protection Interim Dataset, or SaMip, developed by Kenneth Nelson (Reference Nelson2013). Even though data are available for the new EU members from Eastern and Southern Europe, the analysis covers only the eighteen ‘classical’ welfare states for which we have complete series, assuming their longer experience with democracy and higher level of economic development makes a difference for minimum income protection.Footnote 2 In their book on social policy in Latin America, Evelyne Huber and John Stephens suggest it takes about 20 years of democracy for the influence on income distribution to become durable (2012: 109). The period considered here starts precisely at the moment Eastern European countries democratised, and it runs for twenty years, from 1990 to 2010.
The first two parts of the article review the literature on minimum income protection and outline the theoretical argument. The third part presents the methodological approach and the data. The fourth discusses trends and basic measures of association. The last part introduces multivariate models and discusses the results and their implications.
Literature review
Almost every advanced democracy has some form of minimum income protection (MIP). In their Handbook of Minimum Income Protection in Europe, Bahle et al. define MIP as ‘a social minimum based on a means test’ (Reference Bahle, Hubl and Pfeifer2011: 13). The two elements are important in this definition: the reference to a social minimum means that minimum income protection very much defines a social protection floor for citizens, an income below which nobody should fall; and the means test element specifies the manner in which this income is attributed, not as a universal right or as a function of past contributions, but as a last resort for those below a certain income (usually with little or no assets, and no family support). For unemployed and uninsured working-age adults, the MIP basically corresponds to social assistance and related transfers.
For many years, it was considered impossible to compare minimum incomes across countries, because social assistance regimes appeared as a maze of categorical programmes with arcane rules, abundant exceptions, local variations and numerous in-kind advantages. In a landmark report released in 1996, Tony Eardley and his co-authors used the family-type approach to estimate in purchasing power parities the social assistance benefits offered to various types of households by the different OECD countries. With data for 1992 only, they established important differences in minimum income protection across countries, with Switzerland, the Netherlands, the Nordic countries and Australia standing among the most generous (Eardley et al., Reference Eardley, Bradshaw, Ditch, Gough and Whiteford1996: 137). Their conclusions, however, pointed to numerous variations in rules and regulations, which led them to classify countries in a range of categories, each one containing only a few cases. It appeared difficult to rank countries along a single monetary continuum, let alone connect them to characteristics of the broader welfare state.
A year later, Ivar Lødemel published a thorough comparative analysis of social assistance policies in Norway and Britain, which also concluded that the general configuration of the welfare state was a poor predictor of social assistance arrangements (1997). Lødemel even identified a welfare paradox whereby social assistance generosity appeared contrary to a country's welfare state regime. In Norway's universalist welfare state, social insurance was so extensive that social assistance became ‘relegated to obscurity and expected to vanish,’ and remained anchored in the Poor Law tradition. In Britain's liberal welfare state, on the contrary, the prevalence of means-tested programmes gave importance to social assistance and made the ‘alleviation of poverty’ a ‘main social policy objective’ (1997: 261–66). Hence, the paradox: the most encompassing welfare state became less engaged in the expansion and modernisation of social assistance.
The first effort to test these conclusions comparatively came with the early work of Nelson. In his Ph.D. dissertation, he paired the minimum income protection data of Eardley et al., with the welfare state indicators gathered in Stockholm for the Social Citizenship Indicators Program (SCIP). Using qualitative comparative analysis (QCA) and ordinary least squares (OLS) regression, he found, contrary to Lødemel, a positive relationship between the protection offered to the middle class by social insurance programmes and the generosity of minimum income protection, confirming an important implication of the power resources theory of the welfare state (Nelson, Reference Nelson2003: 125). There were limits, however, to what could be concluded from a set of 18 country cases at one point in time. In later works, Nelson developed his dataset to cover the years 1990–2002, and used time-series cross-sectional analysis to assess the connection between welfare state regimes and minimum income protection. It did not seem possible, it turned out, ‘to distinguish any clear cross-national patterns or groups of countries that correspond neatly with previous attempts to cluster welfare states into certain institutional types’ (Nelson, Reference Nelson2008: 114). These findings, Nelson contended, did ‘not at least contradict previous claims about potential institutional relationships between minimum income protection policies and first-tier benefits, such as social insurance’, but the relationship remained difficult to establish. In later works, Nelson found much diversity in minimum income protection, but no clear correspondence between income adequacy and types of welfare states (Montanari et al., Reference Montanari, Nelson and Palme2008).
In a dissertation presented in 2009 at the University of Antwerp, Natascha Van Mechelen took up Nelson's initial project of elucidating the socio-economic determinants of minimum income protection. Using both fuzzy set and time-series cross-sectional analysis, she found no clear relationship between benefits generosity and socio-economic conditions such as the government's financial liabilities, the unemployment rate or the proportion of social assistance recipients, for an average of benefits estimated for four types of households. Like Nelson in his later work, Van Mechelen failed to corroborate a relationship between the broader welfare state, measured by the structure of social insurance programmes, and MIP adequacy (Reference Van Mechelen2009: 164). She found, however, that strong trade unions proved favourable to social assistance recipients, a conclusion consistent with power resources theory (2009: 189–91). Van Mechelen's findings, like those of Nelson before her, suggested that the adequacy of minimum income protection resisted the neat theories or classifications that prevailed in the study of the welfare state.
The early findings of Eardley and his collaborators about the complex and sui generis character of social assistance programmes thus seemed to stand (1996). As Lødemel suggested, the general configuration of the welfare state appeared to be a poor predictor of social assistance arrangements (1997). In a recent book on minimum income protection, Ive Marx, Kenneth Nelson and their co-authors focus on general trends and do not address determinants (Reference Marx, Nelson, Marx and Nelson2013). ‘Most large-scale comparative investigations on social assistance and other forms of minimum income benefits’, concur Birnbaum et al. in a new book, ‘[remain. . .] descriptive in nature, with little or no reference to political dynamics or wider policy contexts’ (Reference Birnbaum, Ferrarini, Nelson and Palme2017: 61).
Theory
To account for the lack of connection between social insurance programmes and the adequacy of minimum income protection, Van Mechelen refers to the Matthew effect argument, whereby mainstream programmes benefit primarily the middle-class and barely reach the poor (2009: 130). Universal programmes may boost middle class support for social spending, as the power resources approach suggests, but this support does not necessarily extend to programmes aimed at the poor. In fact, programmes designed for the middle class could even crowd out income support for the poor (2009: 131–32). There is, of course, a classical reply to this Matthew effect/crowding-out argument, best articulated by Walter Korpi and Joakim Palme in their ‘Paradox of Redistribution’ article (Reference Korpi and Palme1998). Encompassing insurance programmes, they argue, broaden the basis of support for welfare state expansion and enlarge the size of the redistributive budget, two factors that facilitate improvements in income support for the poor (1998: 672). Van Mechelen acknowledges this possibility but notes that a number of studies have challenged the validity of the paradox of redistribution argument (Van Mechelen, Reference Van Mechelen2009: 140; for recent demonstrations along these lines, see Kenworthy, Reference Kenworthy2011; Brady and Bostic, Reference Brady and Bostic2015; Marx et al., Reference Marx, Salanauskaite and Verbist2016). At best, the connection between the welfare state and minimum income protection appears uncertain.
This connection, however, may simply have been inadequately assessed. There are indeed good theoretical reasons to think there are links between the welfare state and minimum income protection. First, the institutional configuration argument at the heart of welfare state literature remains highly plausible. Second, the related political argument drawn from the power resources approach also seems credible, and it is partially validated by Van Mechelen's own findings on the impact of union density.
Consider, first, the institutional argument. As Esping-Andersen argued, the very purpose of the early fights for the welfare state was to provide citizens with ‘a socially acceptable standard of living independently of market participation’. Decommodification, he contended, was ‘the alpha and omega’ of welfare state politics (Reference Esping-Andersen1990: 37). Social assistance incomes may not be the top priority of socialist parties and trade unions but these incomes were inevitably pushed up by the decommodification of social relations. In addition, as Korpi and Palme explained, the ‘size of the budget available for redistribution is not fixed’ and it is greatly conditioned by the institutional characteristics of the welfare state (1998: 663). An encompassing welfare state should thus have a positive impact on MIP adequacy in two ways: through the logic of decommodification, which makes generous social assistance benefits more acceptable, and through the size of the redistribution budget, which makes generous social assistance benefits more feasible.Footnote 3 Two hypotheses capture these welfare state effects:
H1a: Welfare state decommodification has a positive impact on MIP adequacy.
H1b: The size of the redistribution budget has a positive impact on MIP adequacy.
Beyond institutional determinants, the politics of the welfare state should also influence MIP adequacy. In this case, two contrary arguments appear plausible. The first line of reasoning stems from power resources theory, which presents politics as the democratic expression of class conflicts, where workers and their allies are represented by parties of the left and trade unions favourable to generous social insurance and transfer programmes (Van Kersbergen and Vis, Reference Van Kersbergen and Vis2014: 48–50). In this perspective, the predominance of leftist parties in government and a high level of union density should favour MIP adequacy. David Rueda raises doubts about this argument and contends instead that leftist parties and trade unions mostly defend the interest of labour market insiders, and neglect the preferences of outsiders for passive income protection (2007: 68). If this is true, the power resources argument should not apply to minimum income protection, social assistance recipients being the perfect outsiders. Rueda's standpoint, however, may be overly rationalistic. In his study on the politics of poverty, David Brady acknowledges that leftist electoral coalitions are primarily composed of voters ‘not vulnerable to falling into poverty’ and rarely make poverty alleviation a core objective (2009: 103). These coalitions, however, are bound by ‘ideological motivations’ that cannot be reduced to ‘strict material interests’. They constitute what Brady calls ‘latent coalitions for egalitarianism’, broadly favourable to redistribution (Reference Brady2009: 103–104). In his own work, Brady finds the cumulative power of the left and union density to be negatively related to poverty (109–15). Qualitative evidence also suggests that leftist governments are more likely to improve benefits for those who do not work (Larocque and Noël, Reference Larocque and Noël2014). Hence, even though MIP adequacy may never be a top priority of leftist parties and trade unions, we can nevertheless hypothesize, in line with power resources theory, that the power of the left influences social assistance incomes:
H2a: The cumulative presence in power of leftist parties has a positive impact on MIP adequacy.
H2b: Union density has a positive impact on MIP adequacy.
These effects may be weaker than those of welfare institutions and, as Brady finds for poverty, they may be mediated by institutional variables. They should nevertheless play a role, in the expected direction.
Budgetary constraints should also matter. In her work on minimum income protection, Van Mechelen considers the influence of the size of the public debt as a proportion of GDP, the unemployment rate and the social assistance rate; the latter two measuring indirectly the demand for public support. She finds no significant relationship for the public debt variable, and weak relationships for unemployment (negative) and the social assistance rate (positive). In this article, we consider only the public debt and unemployment variables because there are no reliable OECD data on the social assistance rate. In any case, the unemployment and the social assistance rates are likely to be strongly correlated. With respect to budgetary constraints, we thus have two hypotheses:
H3a: Public debt as a proportion of GDP has a negative impact on MIP adequacy.
H3b: The unemployment rate has a negative impact on MIP adequacy.
Methodological approach and data
The study of minimum income protection has lagged behind that of social insurance programmes in part because social assistance appears less salient and less central to the politics of the welfare state, and in part for lack of good, reliable comparative data. Measuring social assistance benefits is notoriously difficult. These benefits:
• often mix standard and ad hoc transfers
• may or may not include in-kind complements
• vary according to household type, and
• are often determined locally, within rather broad national parameters.
In these circumstances, the best approach consists in comparing the formal rules and transfers that apply, in specific cities, to typical households. This is the model family approach (Van Mechelen, Reference Van Mechelen2009: 35). The advantage of this approach is that it takes into consideration most benefits obtained by households, without requiring access to extensive individual data. The main disadvantage is that it is a formal, rules-based approach that does not consider, for instance, that for some targeted measures the real take-up rate may well be low. Like most measures of benefits, the model family approach also does not take into account all in-kind benefits or services available through the welfare state. The most vexing problem concerns the part of social assistance benefits that covers housing costs, which is important in some countries. In real life, this component is adjusted to the rent actually paid by beneficiaries, which creates important variations and implies that the model family approach must assume a rent for a given household. To go around this problem, the OECD posits a housing cost equivalent to 20 per cent of a country's average earnings. The problem with this solution is that it aligns the poor's housing costs on the norm for average families, which is not a realistic evaluation. The 20 per cent rule does not even vary by family type, making it even more misleading for single person households (Van Mechelen, Reference Van Mechelen2009: 39). The OECD acknowledges that this method generates a ‘high but not unreasonably high’ upper bound for welfare incomes, and it also publishes benefits without housing costs, as a lower bound (Immervoll, Reference Immervoll2009: 12). In some cases, however, this OECD upper bound does appear unreasonable. For the United Kingdom and a number of other countries, observe Jonathan Bradshaw and Fran Bennett, this estimation ‘is wrong, and might seriously mislead policy makers’ (Reference Bradshaw and Bennett2009: 18). At the same time, using the lower bound would disregard the housing component of benefits, which is important in some countries.
To solve this problem, Nelson based his estimates of housing benefits on the actual rent paid by households relying on social assistance, as established by Eardley et al., who surveyed national informants to build their 1992 series. For subsequent years, Nelson adjusted for rent inflation (Van Mechelen, Reference Van Mechelen2009: 101; Nelson, Reference Nelson2013: 391). Nelson's SaMip results remain estimates but they nevertheless constitute the best evaluation of MIP benefits (Van Mechelen, Reference Van Mechelen2009: 100).
In some countries, benefits are set at the municipal or regional level. In such cases, Nelson uses the rates in the largest city or jurisdiction. In Austria, for instance, the benefits are those that apply in Vienna. In Canada and the United States, Ontario and Michigan rates are used. In Italy, where there is no national social assistance scheme, the benefits are those that prevail in Milan (Nelson, Reference Nelson2008: 109).
Once benefits are established, the next step consists in determining adequacy, which is done by dividing minimum income benefits for a given household by the country's equivalised median income and then multiplying by 100 (Nelson, Reference Nelson2013: 391). For the years between 1990 and the beginning of the 2000s, we relied on adequacy estimates computed by Nelson and compiled in a file entitled SaMip 2.5 Beta Data (full) (obtained from Nelson). For subsequent years, we used the SaMip benefits data provided in the Social Policy Indicators (SPIN) database (http://www.sofi.su.se/spin/), and followed the same procedure to establish adequacy, using OECD data for the equivalised median disposable income (OECD, 2016).
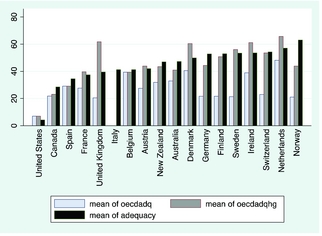
Figure 1 suggests the SaMip adequacy rates (in black), which were used to rank the cases, are relatively reliable. These rates avoid the extreme values obtained with the two OECD measures and they tend to reduce the differences between countries, while showing nevertheless a clear ordering, going from the United States at the bottom to Norway at the top. Norway is the only country providing MIP above the European Union at-risk-of-poverty threshold of 60 per cent of median income. With the OECD adequacy with housing benefits measure (oecdadqhg), the United Kingdom appears much more generous than Norway, an unlikely outcome. With the OECD adequacy without housing benefits (oecdadq), there is little difference between the United Kingdom, Germany and Sweden. All in all the SaMip adequacy measure (adequacy) appears more plausible.
Mean adequacy for OECD countries, 1990–2010, based on OECD MIP without housing benefits, OECD MIP with housing benefits, and SaMip benefits.

Sources for the other variables are more straightforward. For decommodification, we use the generosity index developed by Lyle Scruggs and his colleagues to update and improve upon Esping-Andersen's decommodification index. Available through the Comparative Welfare Entitlements Dataset (Scruggs et al., Reference Scruggs, Jahn and Kuitto2014), this index (totgen) integrates a number of information on social insurance programmes, concerning eligibility rules, coverage, and replacement rates, and it provides a widely recognised measure of a country's commitment to social insurance (Van Kersbergen and Vis, Reference Van Kersbergen and Vis2014: 85). Public social spending as a percentage of GDP (socex), trade union density (uniond), public debt as a percentage of GDP (debtgdp), and the unemployment rate (unempl) are taken from OECD databases. The cumulative presence of leftist parties in power is measured, as is usual, from the proportion of left cabinet portfolios in the government in a given year. The source for these cabinet scores is Duane Swank's Comparative Political Parties Dataset (Swank, Reference Swank2013). Every year a country gets a left power score between 0 and 100, and these scores are divided by 100 and added, to create a cumulative power of the left index. Traditionally, these cumulative scores started from 1946 (see, for instance, Brady et al., Reference Brady, Huber and Stephens2014). For a study of the 1990–2010 period, however, we considered that going back 20 years (to 1970) seemed more reasonable (leftcum70). Tests were conducted as well with a leftcum80 variable. Results were almost identical.
Each variable was assessed to verify the normal distribution assumption, and one – the unemployment rate – was transformed, in order to to be logged (lunempl). There was no problem of collinearity between the independent variables. Descriptive statistics are presented in the online supplementary material (Table SM1).
Trends and measures of association
Between 1990 and 2012, the adequacy of minimum income protection diminished almost everywhere. On average, as can be seen in Figure SM1 (in the online supplementary material), minimum incomes were relatively stable until 1995, not too far below 50 per cent of the national median income. They then decreased for ten years, to fall below 40 per cent by 2005. The average adequacy then stabilized, slightly above the 40 per cent of median income level (Marx et al., Reference Marx, Nolan and Olivera2014: 27). This decline of adequacy (12.9 per cent in 23 years) was largely due to the growth of median income or, more precisely, to the fact that benefits failed to follow the evolution of median income. Indeed, between the mid-1980s or early-1990s and the mid- or late-2000s, the real average annual growth in median household income for these countries (minus Switzerland) stood around 1.8 per cent (own calculations, based on the national averages provided in OECD, 2011: 43).
This common downward trend did not necessarily imply a convergence among countries. If anything, as Figure SM2 (online supplementary material) on the evolution of the coefficient of variation indicates, variation among countries increased over the years.
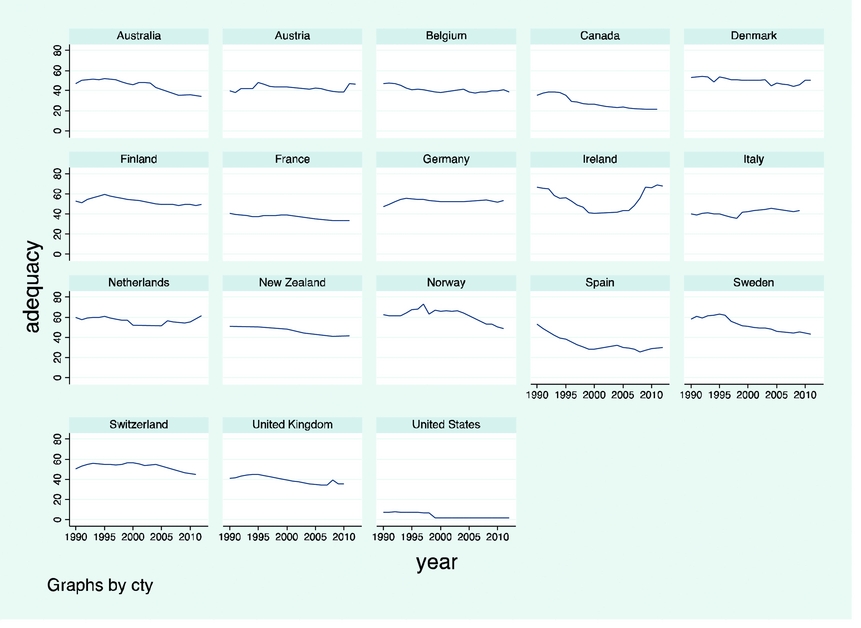
Most countries, however, moved in the same direction and became less generous. Figure 2 displays national trends over time. Starting and arriving points are different, and the pace and timing of change vary, but most countries went from better to worst adequacy, except perhaps Germany, Italy and the Netherlands. Ireland also stood out, with a U-shaped curve of regression and recovery.
Adequacy of minimum income protection, 18 OECD countries, 1990–2012.

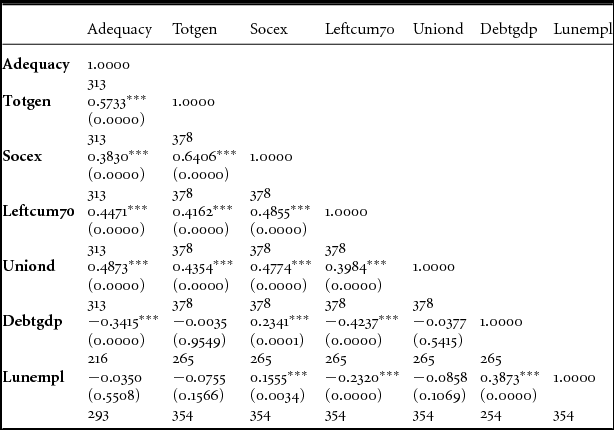
Consider, now, the bivariate relationships between the different variables, when data for the 18 countries are pooled over 20 years. The results are presented in Table 1.
Correlations between the different variables, 18 OECD countries, 1990–2010 (with p value and number of observations).

Note: ***significant at 0.01 level.
As expected, there are positive relationships between welfare state institutions and the level of adequacy. The index of generosity is strongly related to adequacy and so is the measure for social expenditures. The second set of hypotheses, about power resources, also seems validated. The left's cumulative power and union density are positively associated with adequacy, contrary to the idea of a social-democratic or union indifference to labour market outsiders. The strength of the left and of trade unions is also positively related to the index of generosity and the level of social expenditures, a finding in line with the literature (Van Kersbergen and Vis, Reference Van Kersbergen and Vis2014: 48–50). As expected, there is a negative relationship between adequacy and what is probably the main economic constraint, public debt as a percentage of GDP. The relationship with unemployment is negative as well, but not significant. Our hypothesis on unemployment as a constraint can be dropped (H3c).
To go beyond bivariate relationships and understand how the different variables interact, it is necessary to build a multivariate model. With a small number of cases over 20 years, the best approach consists in pooling country cases and years in a panel analysis, with a time-series cross-sectional regression model. For this model, we consider the variables that are significant in Table 1: namely, welfare state generosity, social expenditures, cumulative left power, union density and public debt. The general form of the model is:
 $$\begin{eqnarray*}
\hspace*{-5pt}&&{\textit MIP}\;{\textit Adequacy} = a + {b_1}\;{\it Welfare}\;State\;Generosity + {b_2}\;Social\;{\it Expenditures}\\
\hspace*{-5pt}&&+ {b_3}\;{\it Cumulative\;Left\;Power} + {b_4}\;{\textit Union\;Density} + {b_5}\;{\textit Public\;Debt }
\end{eqnarray*}$$
Time-series cross-sectional analysis
There are vigorous debates among scholars using time-series cross-sectional models over the merits of various strategies. One approach, long dominant in political science, consists in pooling all cases together, ignoring the heterogeneity among clusters (countries in our case). This is the approach proposed by Nathaniel Beck and Jonathan Katz with their Panel Corrected Standard Errors (PCSE) procedure (Reference Beck and Katz1995). This strategy has the advantage of being simple but it ignores unobserved heterogeneity and may induce an omitted variable bias. More precisely, it obscures the fact that variations between and within countries may not be alike (Bartels, Reference Bartels and Franzese2015). Such differences in variations are usually important and many scholars prefer to rely on a fixed effects (FE) model, which controls out the heterogeneity between cases to focus solely on change within them. Because it makes abstraction of the national context and solves the problem of unobserved variations, the fixed effects approach has become more or less the ‘gold standard’ in econometrics and political science (Bell and Jones, Reference Bell and Jones2015: 139). These models have problems of their own, however. Indeed, they make it impossible to assess the impact of time-invariant or slowly changing variables, often important in political science (Beck and Katz, Reference Beck and Katz2001; Plümper et al., Reference Plümper, Troeger and Manow2005; Bell and Jones, Reference Bell and Jones2015: 139). Welfare state generosity, trade union density, or the public debt do not move a lot in a given country over 10 or 20 years, but they may make a lot of difference across countries. Because it controls out variations across cases, the fixed-effects approach disqualifies at the outset the very type of variables that comparative political scientists consider most important. A third approach consists in using random effects (RE) models, or a ‘partial pooling’ approach which estimates a weighted average of the variations between and within cases. Theoretically satisfying, this approach also poses technical challenges, because time-varying variables risk being correlated with the random effects term, a problem that usually leads scholars back to fixed effects models, with their own limitations (Bartels, Reference Bartels and Franzese2015).
In recent contributions, Brandon Bartels (Reference Bartels and Franzese2015) and Andrew Bell and Kelvyn Jones (Reference Bell and Jones2015) propose to address this dilemma by modeling explicitly the between-cases and within-cases effects, to avoid confounding them (as in the complete or partial pooling approaches) or ignoring half of them (with fixed effects models). The idea is to generate cluster-specific variables to allow the modeling of distinct effects. We may expect, for instance, that the effects of political and institutional variables will be significant between cases, whereas budgetary constraints and social expenditures will be influential within cases. Because it is a new approach to time-series cross-sectional analysis, let us start by considering the results we would obtain with PCSE or with conventional fixed-effect models.
For our PCSE model, we follow the approach defended by Stephens and his collaborators, and consider a model without lagged dependent variable or fixed effects, with a Prais-Winsten correction (AR(1)) to correct for first-order auto-regression without misestimating other variables (Huo et al., Reference Huo, Nelson and Stephens2008; Huber and Stephens, Reference Huber and Stephens2012: 136). Our other FE models are a conventional robust regression with fixed effects and a fixed-effect model with AR(1) correction (Wilson and Butler, Reference Wilson and Butler2007). In all these instances, the New Zealand case is dropped for lack of data on public debt.
The results of the PCSE model, presented in Table SM2 (online supplementary material), seem to validate our main hypotheses. Welfare state institutions (H1a), social expenditures (H1b), and trade union density (H2b) have a significant positive impact, and public debt as a percentage of GDP (H3a) a negative impact on MIP adequacy. The left's cumulative power, however, is not significant (H2a). Many of these variables are slow-moving institutional characteristics unlikely to remain significant in fixed effects models. This is precisely what happens with the two FE models presented in Table SM2 (online supplementary material), where only social expenditures remain significant in both models, in the expected direction (H1b).
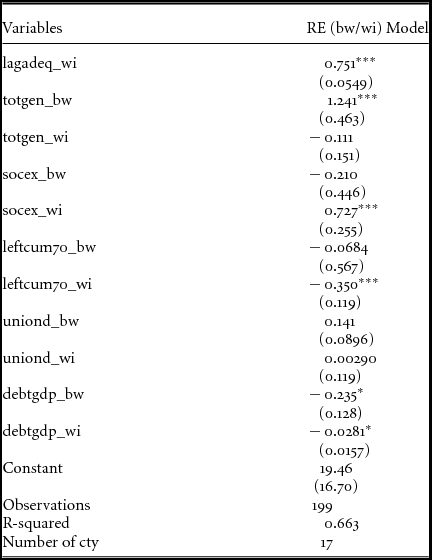
To clarify the relative importance of slowly moving and more incremental variables, the best option, as explained above, is to disentangle variations between and within cases. Table 2 presents results for a model constructed along the lines suggested by Bartels.Footnote 4 This model is a robust regression and includes a lagged dependent variable to account for dynamics (Bartels, Reference Bartels and Franzese2015).
Random-effect model separating between-country and within-country effects for the determinants of MIP adequacy, 17 OECD countries, 1990–2010.

Robust standard errors in parentheses.
***p < 0.01, **p < 0.05, *p < 0.1.
Results for this random effect, between-within model are consistent with those of the PCSE model, but carry more information about the specific effects of long-term and short-term variables. Indeed, it becomes clear with this model that the index of generosity explains differences between countries, whereas social expenditures account for change within cases. Political variables, however, fare less well. Trade union density is positively associated with adequacy across cases but it is not significant (p = 0.115). The cumulative power of the left is significant within cases but, surprisingly, the effect is negative, suggesting that countries where the left was successful in the 1990s and 2000s became less generous with social assistance incomes. It may be, as Jane Gingrich and Silja Häusermann suggest, that in recent years social-democratic parties have found themselves ‘under pressure to move away from policies supporting traditional income replacement and decommodification and towards new middle-class reform priorities’ (Reference Gingrich and Häusermann2015: 55). Before we reach this conclusion, however, it would be prudent to consider the importance of the observed effect. Finally, public debt works against adequacy, both between and within countries.
Since there is no national social assistance programme in Italy, we also tested the model without this country. We did the same with the United States, a clear outlier with respect to minimum income protection. The model was also tested for the 2000s only. The results, which are reported in the online supplementary material (Table SM3), proved consistent with those of the full model.
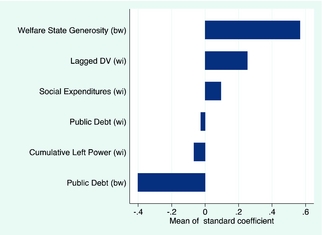
Standardised coefficients, presented in Figure 3, help make sense of these different effects by providing a standard measure of impact.
Standardised coefficients, random-effect model separating between-country and within-country effects for the determinants of MIP adequacy, 17 OECD countries, 1990–2010.

As can be seen in Figure 3, the most important effects on MIP adequacy are cross-sectional, with welfare state generosity and public debt as a proportion of GDP both exerting a strong influence. For one standard deviation in the generosity index, MIP adequacy goes up by about 0.57 standard deviations; for one standard deviation in public debt, adequacy is lowered by 0.40 standard deviations. By comparison, within effects appear modest. A one standard increase in social spending causes a 0.10 increase in adequacy, and a similar increase in public debt lowers adequacy by 0.03 standard deviations. The negative impact of the left's cumulative impact must be interpreted in this light: an increase of one standard deviation in leftcum70 only lowers adequacy by 0.07 standard deviations.
Substantively, these findings suggest that national differences matter more than change across time, which is not so surprising given the relative stability of MIP adequacy. A country's type of welfare state and comparative level of public debt weight more than its changing levels of social expenditures, cumulative left power, and public debt; three variables that are nevertheless significant to explain variations within countries. Overall, the outcome seems more consistent with the logic of decommodification identified by Esping-Andersen (Reference Esping-Andersen1990) than with Lødemel's welfare paradox (Reference Lødemel1997), and it lends support to hypothesis H1a. Our second welfare state hypothesis, H1b, about the size of the redistributive budget, also appears vindicated. The effect, in this case, plays over time. As predicted by Korpi and Palme (Reference Korpi and Palme1998), generous social insurance programmes favour the poor. These conclusions corroborate Nelson's early results (Reference Nelson2003), which were not confirmed by Nelson and Van Mechelen's later work (Nelson, Reference Nelson2008; Van Mechelen, Reference Van Mechelen2009). They also confirm the institutional and power resources theories, rather than the Matthew effect and crowding out hypotheses. All in all, for social assistance recipients, it appears preferable to live in an encompassing welfare state with a sizeable redistribution budget and a public debt under control.
The politics of social assistance appears trickier. In line with the power resources approach, with Van Mechelen's findings (Reference Van Mechelen2009), and with our fourth hypothesis (H2b), trade union density is a bivariate correlate of MIP adequacy but the effect disappears in a multivariate model including institutional variables. Contrary to the insiders/outsiders theory (Rueda, Reference Rueda2007), trade unions seem to participate in what Brady calls a ‘latent coalition for egalitarianism’ (Reference Brady2009: 102). Parties of the left, however, do not have the same impact. If anything, the consequences of social-democratic cumulative power are marginally negative, at least within countries, forcing us to reject hypothesis H2a. Perhaps, as Gingrich and Haüsermann suggest, social-democratic parties have moved away from traditional income-replacement policies (Reference Gingrich and Häusermann2015). Or, as Bea Cantillon suspects, their preference for social-investment policies worked against the poor, unable to take advantage of programmes meant to facilitate job integration and make work pay (Reference Cantillon, Cantillon and Vandenbroucke2014). In a recent article, Nelson concurs with this interpretation, and suggests public expenditures on active labour market policies (ALMP) have been negatively correlated with benefits adequacy (Reference Nelson2013: 393–4). Such a trade-off between activation and minimum income protection, however, is far from evident. In the late 1990s and early 2000s, the leftist politics of the Third Way often combined an emphasis on activation with a commitment to redistribute (Huo, Reference Huo2009; Larocque and Noël, Reference Larocque and Noël2014). One should keep in mind that the negative effect of leftcum70 is very small and that simple correlations between cumulative left power and MIP adequacy remain positive and rather strong. It may simply be, as Brady suggests, that the effects of leftist politics, like that of trade union density, disappear because they are ‘channeled through welfare generosity’ (Reference Brady2009: 114). Nevertheless, as Brady acknowledges, leftist electoral victories do not seem to bear promises of immediate improvements for the poorest (114).
Finally, as we expected, economic constraints matter. Contrary to the results obtained by Van Mechelen (Reference Van Mechelen2009), public debt as a proportion of GDP has a significant and negative impact on minimum income protection, and this is true within as well as across countries, lending strong support to hypothesis H3b. The general idea that financial constraints place the welfare state under stress seems vindicated (Van Kersbergen and Vis, Reference Van Kersbergen and Vis2014; Marchal et al., Reference Marchal, Marx and Van Mechelen2014).
Conclusion
As the effective social floor of advanced democracies, minimum income protection constitutes the rock-bottom foundation of citizenship rights, and it is a distinctive test of a country's commitment to social justice (Bahle et al., Reference Bahle, Hubl and Pfeifer2011: 2; Kenworthy, Reference Kenworthy2011: 4). Minimum incomes, however, are neglected by welfare state scholars, because they appear marginal, difficult to assess and poorly documented. Even the OECD maintains a sketchy representation of the amounts involved. Building on the work of Nelson, we estimated adequacy levels for 18 ‘classical’ welfare states, and used an innovative between/within cases time-series cross-sectional approach to account for their institutional, political and economic determinants.
The main theoretical conclusion that can be drawn from these results is that, contrary to what previous scholars found, the broader politics of the welfare state matters for minimum income protection. Encompassing welfare states with a sizeable redistribution budget are more likely to have generous minimum income protection. This finding is in line with recent work establishing with better measurements and operationalisation that the paradox of redistribution still operates in the twenty-first century (Jacques and Noël, Reference Jacques and Noël2018; see also Birnbaum et al., Reference Birnbaum, Ferrarini, Nelson and Palme2017).
Substantively, four observations can be outlined in conclusion. First, in the last two decades, minimum incomes as a proportion of median income have been going down. This trend was not the result of a convergence among countries, because variations across cases remained important, but most countries went from more to less redistributive.
Second, this downward trend was in part a consequence of economic difficulties. Governments with a higher public debt as a proportion of GDP and a growing debt over time proved more likely to let the adequacy of social assistance incomes decline.
Third, and most importantly, as goes the welfare state so goes minimum income protection. In a cross-sectional perspective, there is a strong association between the decommodifying character of social insurance programmes and generous social assistance benefits. This conclusion contradicts the recent results of Nelson and Van Mechelen, but it is consistent with Esping-Andersen's regime approach, with Korpi and Palme's paradox of redistribution, and with Nelson's early findings, and it appears robust across different tests. When measured with standardised coefficients, the welfare state context produces the most important impact on minimum income protection. Over time, within countries, rising social expenditures also favour the poor.
Fourth, politics matter. In bivariate relationships, trade union density and left cumulative power have a positive influence on minimum incomes. In a multivariate model, the impact of union density is also positive but not significant, probably because the effect is channeled through welfare state institutions (Brady, Reference Brady2009). Trade unions may think first about their members, but they seem to reinforce what Brady calls ‘latent coalitions for egalitarianism’. Trade union density may also be an indirect indicator of the mobilisation capacity of collective actors in a given society. It is plausible, for instance, but difficult to demonstrate, that the women's movement or associations defending the rights of the poor are more powerful in countries where the labour movement is stronger. Whatever the case, the poor seem to benefit from the presence of trade unions, even though they are not members. The legacy of leftist parties appears less obvious. In correlations, cumulative left power is associated with MIP adequacy but this result is not observed in time-series cross-sectional analysis. Worst, when measured within countries, the left cumulative power seems to hurt the poor. Some may think that the social investment approach favoured by the left promoted labour market activation at the expense of redistribution. This negative effect, however, is very small. On this question, more research needs to be done.
Most advanced democracies provide a minimum income to adults without market incomes, family support or assets. This income can be extremely low. In the United States, for instance, it comes mostly as food subsidies and leaves many persons far below the poverty line. Minimum incomes nevertheless contribute to define a country's welfare state. The most important determinant of benefits adequacy is the overall character of social insurance programmes. When social protection is good for all, it is also better for the poorest. Strong trade unions also seem to help but the effect of leftist parties over time is more uncertain, which may say something perhaps about the current difficulties of social democracy.
Everywhere, the workless, uninsured poor remain the ultimate outsiders. For all its variations, minimum income protection always stands low, usually quite below the 50 per cent of median income line usually taken as a poverty line. Governments worry about work incentives more than about basic needs, even though the gap between low wages and social assistance benefits remains ‘quite substantial’. It is ‘hard to argue,’ note Marx et al., ‘that long-term dependence on social assistance benefits is an attractive financial proposition’ (Reference Marx, Nolan and Olivera2014: 29). As governments and groups around the OECD begin to evoke a basic or a guaranteed annual income, we should remember that no country stands even near the possibility or the levels of such an income. The road to get there, if it exists, appears very narrow.
Acknowledgements
An earlier version of this article was presented at the Annual conference of the Canadian Political Science Association, University of Calgary, June 2nd 2016. I thank Kenneth Nelson, for kindly sharing data, David Deault Picard and Audrey Roy for their help with the database, and Jean-Michel Cousineau, Olivier Jacques, Florence Larocque, Rahim Mohamed, Natascha Van Mechelen and the Journal's editors and reviewers for comments and suggestions. I also wish to acknowledge the financial support of the Social Sciences and Humanities Research Council of Canada.
Supplementary material
To view supplementary material for this article, please visit https://doi.org/10.1017/S0047279418000351