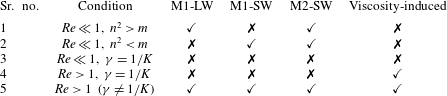
1 Introduction
An instability of layered two-phase flows caused by inter-phase mass transfer of a surface-active solute is investigated in this paper. This work is motivated by recent developments in microscale solvent extraction and two-phase heterogeneous reaction systems. Typically, two phases are brought into contact as parallel flowing streams in a microchannel. Mass transfer of a solute occurs between the phases, across a well-defined interface. Such systems have been successfully applied to extract products from process streams and purify waste streams (Hotokezaka et al. Reference Hotokezaka, Tokeshi, Harada, Kitamori and Ikeda2005; Fries, Voitl & von Rohr Reference Fries, Voitl and von Rohr2008; Assmann, Ładosz & Rudolf von Rohr Reference Assmann, Ładosz and Rudolf von Rohr2013), separate biomolecules (Znidarsic-Plazl & Plazl Reference Znidarsic-Plazl and Plazl2007) and carry out mass transfer limited heterogeneous reactions. An example of the latter process is phase transfer catalysis (Aljbour, Yamada & Tagawa Reference Aljbour, Yamada and Tagawa2010; Šinkovec, Pohar & Krajnc Reference Šinkovec, Pohar and Krajnc2013), in which a catalyst facilitates the transport of reactant and product species between immiscible phases. Layered or stratified two-phase flow in microchannels offers the advantages of small diffusion path length, high interfacial area to volume ratio, low shear rates and small inventories.
The physico-chemical behaviour of these systems is complicated by the fact that the solute often behaves as a soluble surfactant, i.e. the interfacial tension of the two-fluid interface varies with the concentration of the solute. In such cases, changes in solute concentration along the interface generate Marangoni stresses that can significantly impact the flow, thereby modifying the rate of mass transfer. Examples of such solute/fluid–fluid systems, encountered in extraction processes, are acetone/water–toluene (Javed, Thornton & Anderson Reference Javed, Thornton and Anderson1989), butyric acid/water–toluene (Sternling & Scriven Reference Sternling and Scriven1959) and oxyethylated alcohols/water–heptane (Tadmouri et al. Reference Tadmouri, Kovalchuk, Pimienta, Vollhardt and Micheau2010). Several phase transfer catalysts also act as soluble surfactants and modify the interfacial tension of the inter-fluid interface (Dutta & Patil Reference Dutta and Patil1993).
There are two fundamentally different routes through which Marangoni stresses may impact mass transfer in these flows. The first is due to the fact that the concentration at the interface generally varies significantly along the microchannel. The two phases enter the channel with a significant concentration difference and leave the channel close to or at equilibrium. Marangoni stresses due to this axial concentration gradient will certainly modify the steady-state flow of the system. However, in a recent study, we have shown that this effect is not strong enough to impact the primary pressure driven flow for practical fluid–solute systems (Picardo et al. Reference Picardo, Radhakrishna, Anil, Sundari and Pushpavanam2015). The base steady-state flow remains almost the same as that in the absence of the solute.
The second route through which Marangoni stresses can impact mass transfer is by generating a hydrodynamic instability that leads to a new, possibly dynamic, flow state. It is the aim of this work to establish whether such an instability is possible, to determine the stability threshold and to understand the nature of the instability modes. Towards this end we study a model problem that is closely related to the extraction system, but in which the base steady flow is fully developed and free from Marangoni stresses. Specifically, we consider layered stratified flow between two infinite flat plates, which are maintained at different solute concentrations. The concentration gradient maintained across the fluids sustains mass transfer between the phases. The corresponding base steady flow is fully developed and unidirectional. We analyse the stability of this flow to infinitesimal perturbations via a classic normal mode analysis.
There is good reason to expect a Marangoni instability in this flow, on the basis of past work on the stability of stationary fluid layers sustaining mass transfer of a soluble surfactant. First analysed by Sternling & Scriven (Reference Sternling and Scriven1959), this stationary solutal Marangoni instability is the subject of a large body of literature. Much of this work is surveyed in the reviews by Kovalchuk & Vollhardt (Reference Kovalchuk and Vollhardt2006) and Schwarzenberger et al. (Reference Schwarzenberger, Köllner, Linde, Boeck, Odenbach and Eckert2014). The stability is affected by the fluid and solute properties as well as the direction of mass transfer. The existence of a finite concentration gradient across the fluids is a necessary condition for instability of the stationary fluid layers. Whether this remains a necessary condition when pressure driven flow is imposed is a question that we aim to answer in this paper.
A rather disjointed, though equally large, body of literature exists on the stability of two-phase stratified Poiseuille flow (Boomkamp & Miesen Reference Boomkamp and Miesen1996). In the absence of surfactants, this flow is unstable to a long-wave interfacial instability called the viscosity-induced mode (Boomkamp & Miesen Reference Boomkamp and Miesen1996). This mode was first identified by Yih (Reference Yih1967) and occurs even at low Reynolds numbers. The flow is stable, however, in the creeping flow limit. At the other extreme of large Reynolds numbers, the shear mode becomes unstable (Yiantsios & Higgins Reference Yiantsios and Higgins1988; Boomkamp & Miesen Reference Boomkamp and Miesen1996). This mode takes the form of Tollmien–Schlichting waves and is induced by Reynolds stresses near the walls. The shear instability is unimportant at the low Reynolds numbers encountered in milli- and microchannels.
Studies on the effects of surfactants on two-phase stratified flow are largely limited to the case of insoluble surfactants. Frenkel and Halpern (Frenkel & Halpern Reference Frenkel and Halpern2002; Halpern & Frenkel Reference Halpern and Frenkel2003) first demonstrated that the otherwise stable creeping flow becomes unstable on introducing an insoluble surfactant. Further studies have explored the influence of inertia (Blyth & Pozrikidis Reference Blyth and Pozrikidis2004a ; Frenkel & Halpern Reference Frenkel and Halpern2005) and nonlinear dynamics (Blyth & Pozrikidis Reference Blyth and Pozrikidis2004b ; Wei Reference Wei2005; Blyth, Luo & Pozrikidis Reference Blyth, Luo and Pozrikidis2007; Samanta Reference Samanta2013). From the perspective of this literature, the present study extends the current understanding of surfactant effects to the case of soluble surfactants.
A few studies that consider the influence of shear flow on the solutal Marangoni instability have been carried out. Sun & Fahmy (Reference Sun and Fahmy2006) have analysed the instability caused by mass transfer in gas–liquid Poiseuille flow. Zaisha et al. (Reference Zaisha, Ping, Guangji and Chao2008) have carried out direct numerical simulations for the case of liquid–liquid Couette flow. Both studies are restricted to the case of a non-deforming interface. However, interfacial deformation has a profound impact on the solutal Marangoni instability when Poiseuille flow is present, as shown in this paper. Very recently, You, Zhang & Zheng (Reference You, Zhang and Zheng2014) have presented stability results for the solutal Marangoni instability in Poiseuille flow. However, a key term that accounts for interfacial concentration gradients due to interface deformation is absent in their model. Here, we show that this term plays an important role in the Marangoni instability and cannot be ignored unless the interface is flat.
We make certain assumptions that simplify the system while retaining its essential features. We consider two-dimensional Poiseuille flow between flat walls of two immiscible incompressible Newtonian fluids. The concentrations of the solute at the two walls are maintained at two different constant values. The channel width is assumed to be sufficiently small for buoyancy effects to be neglected in comparison with Marangoni effects. This occurs when the velocity scale of natural convection-induced flow (
 ${\it\beta}_{D}{\rm\Delta}Cgd^{2}/{\it\mu}$
) to Marangoni-stress-induced flow (
 ${\it\beta}{\rm\Delta}Cd/l_{c}{\it\mu}$
) is small (
 $dgl_{c}{\it\beta}_{D}/{\it\beta}\ll 1$
) for each fluid. Here,
 ${\it\mu}$
and
 $d$
are the fluid viscosity and channel width respectively;
 ${\it\beta}_{D}$
and
 ${\it\beta}$
are measures of the sensitivity of density and interfacial tension to solute concentration respectively;
 ${\rm\Delta}C$
is the concentration difference applied across the plates and
 $l_{c}$
is the longitudinal length scale of streamwise variations in concentration. As buoyancy effects are unimportant in this regime, we simplify the model by assuming the densities of the fluids to be equal and independent of concentration.
We also make certain simplifying assumptions regarding the properties of the soluble surfactant. A linear dependence of interfacial tension on concentration is considered. The rate of solute adsorption/desorption to/from the interface is assumed to be instantaneous in comparison with transport processes on the interface and in the bulk. Under these conditions, the interface solute concentration will be nearly in equilibrium with the bulk concentration in the adjacent fluid on either side of the interface, and dynamic transport of the solute in the interface Gibbs adsorption layer can be neglected. The model can then be written entirely in terms of bulk phase concentrations. It consists of a solute transport equation in each fluid and two interface boundary conditions that enforce equality of flux and local equilibrium at the interface (Picardo et al. Reference Picardo, Radhakrishna, Anil, Sundari and Pushpavanam2015).
Apart from model simplification, an additional advantage of assuming the aforementioned solute properties is that the results and conclusions of this study can be directly applied to thermocapillary instabilities, which arise due to variations of temperature. In the thermal analogue of this problem, the walls are maintained at different temperatures and heat transfer occurs between the fluids. Marangoni stresses are generated due to the dependence of interfacial tension on temperature. The corresponding governing equations are identical to those considered in this paper, provided that an appropriate interchange of physical quantities is made (e.g. replacing the solute diffusion coefficients by the thermal diffusion coefficients of the fluids). Scriven & Sternling (Reference Scriven and Sternling1964) were among the first to study the thermocapillary instability in stationary fluid layers. Gumerman & Homsy (Reference Gumerman and Homsy1974) have studied the stability of stratified Couette flow between heated plates, simultaneously considering buoyancy and thermocapillary effects. However, the parameter space was not fully explored, as only a few specific fluid systems were analysed. A detailed asymptotic analysis of thermocapillary instability in Couette flow was carried out by Wei (Reference Wei2006) for the case of one fluid layer being much thinner than the other (thin-layer limit).
The outline of this paper is as follows. The governing equations are presented in § 2. The steady base state concentration and velocity fields are presented in § 3. Brief descriptions of the linear stability analysis and energy budget calculation are presented in §§ 4 and 5. An asymptotic analysis for long-wave disturbances is carried out in § 6. The results of numerical calculations for all wavenumbers are discussed next. Sections 8–11 consider the limit of creeping flow, wherein Marangoni effects are the only possible source of instability (the viscosity-induced mode is stable for creeping flow). In § 8 three different types of instability modes – one long-wave and two short-wave – are identified. Mode switching between the two short-wave modes is studied in § 9. The results therein reveal a key qualitative difference between the two short-wave modes. The transition from long waves to short waves is analysed in § 10. These numerical results along with the long-wave analysis of § 6 point to a well-defined transition boundary in parameter space. Section 11 investigates whether a finite concentration difference across the fluids is a necessary condition for the Marangoni instability. The analysis is extended beyond the creeping flow limit to small but finite Reynolds numbers in § 12. This introduces the viscosity-induced mode in addition to the three previous Marangoni modes. The influence of inertia on the Marangoni modes, as well as the effect of a soluble surfactant on the viscosity-induced mode, is studied in this section. In § 13 we compare our results with previous work by Wei (Reference Wei2006) and You et al. (Reference You, Zhang and Zheng2014). The key results and conclusions of this work are summarized in § 14, along with some suggestions for future work.
2 Governing equations
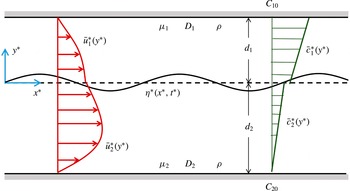
A schematic of the 2D flow system being investigated is shown in figure 1. Two immiscible incompressible viscous fluids with equal densities flow side by side between two infinite parallel plates separated by
 $d_{1}+d_{2}$
. The liquid–liquid interface is located at
 $y^{\ast }=0$
(superscript ‘
 $\ast$
’ indicates that the quantity is dimensional). The flow is driven by an imposed pressure gradient parallel to the
 $x^{\ast }$
-axis. The concentrations at the top and bottom plates are maintained at
 $C_{10}$
and
 $C_{20}$
respectively.
Schematic of the system under study. The deformable interface is located at
 $y^{\ast }={\it\eta}^{\ast }(x^{\ast },t^{\ast })$
. The dashed line at
 $y^{\ast }=0$
corresponds to the undeformed interface in the base state. Here,
 $\bar{u}_{i}^{\ast }$
and
 $\bar{c}_{i}^{\ast }$
are the velocity and concentration fields in the base state. The concentration field obeys the linear equilibrium condition
 $\bar{c}_{1}^{\ast }=K\bar{c}_{2}^{\ast }$
at the interface. Since
 $K$
can differ from unity, the concentration field can be discontinuous at the interface in general. Both fluids have a density
 ${\it\rho}$
, while
 ${\it\mu}_{i}$
and
 $D_{i}$
are the viscosities and solute diffusivities respectively.

Choosing the interfacial velocity (
 $U_{0}$
), the thickness of the top fluid layer (
 $d_{1}$
) and the concentration at the top plate (
 $C_{10}$
) as the characteristic velocity, length and concentration scales, the dimensionless coordinate directions (
 $x,y$
), streamwise velocity (
 $u_{j}^{\prime }$
), transverse velocity (
 $v_{j}^{\prime }$
), pressure (
 $p_{j}^{\prime }$
) and concentration (
 $c_{j}^{\prime }$
) fields are defined as
 $$\begin{eqnarray}(x,y)=\frac{(x^{\ast },y^{\ast })}{d_{1}},\quad (u_{j}^{\prime },v_{j}^{\prime })=\frac{(u_{j}^{\ast },v_{j}^{\ast })}{U_{0}},\quad p_{j}^{\prime }=\frac{p_{j}^{\ast }}{{\it\mu}_{j}U_{0}/d_{1}},\quad c_{j}^{\prime }=\frac{c_{j}^{\ast }}{C_{10}}.\end{eqnarray}$$
The subscript
 $j$
takes the values 1 and 2 to denote the top and bottom fluids respectively. The dimensionless governing equations, namely the continuity equation, the Navier–Stokes equation and the species transport equation, are given by
 $$\begin{eqnarray}\boldsymbol{{\rm\nabla}}\boldsymbol{\cdot }\boldsymbol{v}_{j}^{\prime }=0,\end{eqnarray}$$
 $$\begin{eqnarray}\frac{Re}{m_{j}}\left(\frac{\partial \boldsymbol{v}_{j}^{\prime }}{\partial t}+\boldsymbol{v}_{j}^{\prime }\boldsymbol{\cdot }\boldsymbol{{\rm\nabla}}\boldsymbol{v}_{j}^{\prime }\right)=-\boldsymbol{{\rm\nabla}}p_{j}^{\prime }+{\rm\nabla}^{2}\boldsymbol{v}_{j}^{\prime },\end{eqnarray}$$
 $$\begin{eqnarray}\frac{\partial c_{j}^{\prime }}{\partial t}+\boldsymbol{v}_{j}^{\prime }\boldsymbol{\cdot }\boldsymbol{{\rm\nabla}}c_{j}^{\prime }=\frac{D_{r,j}}{Pe}{\rm\nabla}^{2}c_{j}^{\prime },\end{eqnarray}$$
 $j=1,\,m_{1}=1,\,D_{r,1}=1$
for fluid 1 and
 $j=2,\,m_{2}=m={\it\mu}_{2}/{\it\mu}_{1},\,D_{r,2}=D_{r}=D_{2}/D_{1}$
for fluid 2. Here,
 $$\begin{eqnarray}\boldsymbol{{\rm\nabla}}=\left(\frac{\partial }{\partial x},\,\frac{\partial }{\partial y}\right),\quad \boldsymbol{v}_{j}^{\prime }=(u_{j}^{\prime },\,v_{j}^{\prime }),\quad Re=\frac{{\it\rho}U_{0}d_{1}}{{\it\mu}_{1}},\quad Pe=\frac{U_{0}d_{1}}{D_{1}}.\end{eqnarray}$$
The dimensionless parameters
 $Re,\,Pe,\,m$
and
 $D_{r}$
represent the Reynolds number, Péclet number, ratio of dynamic viscosities and molecular diffusivities respectively. All physical properties are assumed to be constant with the exception of the interfacial tension, which depends on the concentration of the solute at the interface.
In general, a separate solute balance equation must be written at the interface, which accounts for changes in interface concentration due to surface convection and diffusion along the interface, as well as adsorption/desorption (Leal Reference Leal2007). However, if the rates of adsorption and desorption are very high, then the interface concentration may be assumed to be in equilibrium with the concentration in the adjacent fluid on either side of the interface. Under these conditions, the interface solute balance reduces to two boundary conditions at the interface,
 $y={\it\eta}^{\prime }(x,t)$
, which require the diffusive flux to be continuous and the bulk concentrations to be in equilibrium. For dilute solutions these boundary conditions read as (Picardo et al.
Reference Picardo, Radhakrishna, Anil, Sundari and Pushpavanam2015)
 $$\begin{eqnarray}-{\it\eta}_{x}^{\prime }c_{1,x}^{\prime }+c_{1,y}^{\prime }=D_{r}(-{\it\eta}_{x}^{\prime }c_{2,x}^{\prime }+c_{2,y}^{\prime }),\end{eqnarray}$$
 $$\begin{eqnarray}c_{1}^{\prime }=Kc_{2}^{\prime }.\end{eqnarray}$$
Here, subscripts
 $x$
and
 $y$
indicate partial differentiation and
 $K$
is the distribution coefficient. It should be noted that the unit normal to the interface is given by
 $(\boldsymbol{e}_{y}-{\it\eta}_{x}^{\prime }\boldsymbol{e}_{x})(1+({\it\eta}_{x}^{\prime })^{2})^{-1/2}$
, while the unit tangent is given by
 $({\it\eta}_{x}^{\prime }\boldsymbol{e}_{y}+\boldsymbol{e}_{x})(1+({\it\eta}_{x}^{\prime })^{2})^{-1/2}$
. Here,
 $\boldsymbol{e}_{y}$
and
 $\boldsymbol{e}_{x}$
are unit vectors in the
 $y$
and
 $x$
directions respectively.
The value of the interfacial tension is calculated using the bulk concentration at the interface. Assuming a linear dependence of interfacial tension on solute concentration, we have
 $$\begin{eqnarray}{\it\sigma}^{\ast }={\it\sigma}_{0}(1-{\it\beta}C_{10}(c_{1}^{\prime }-c_{r}^{\prime })),\end{eqnarray}$$
where
 ${\it\beta}=-(\text{d}{\it\sigma}^{\ast }/\text{d}c_{1}^{\ast })/{\it\sigma}_{0}$
and
 ${\it\sigma}_{0}$
is the interfacial tension when the solute concentration at the interface equals the reference value
 $C_{10}c_{r}^{\prime }$
. A positive value of
 ${\it\beta}$
implies that interfacial tension decreases with increasing solute concentration. Due to the linear equilibrium relationship (2.5), either
 $c_{1}^{\prime }$
or
 $c_{2}^{\prime }$
can be used to express the dependence of interfacial tension on concentration (Sternling & Scriven Reference Sternling and Scriven1959).
The variation of interfacial tension causes tangential Marangoni stresses at the interface, which are balanced by shear stresses. Using the relation (2.6), the tangential stress balance at the interface reads
 $$\begin{eqnarray}\frac{1}{(1+({\it\eta}_{x}^{\prime })^{2})^{1/2}}\unicode[STIX]{x27E6}2{\it\eta}_{x}^{\prime }m_{j}(v_{j,y}^{\prime }-u_{j,x}^{\prime })+(1-({\it\eta}_{x}^{\prime })^{2})m_{j}(u_{j,y}^{\prime }+v_{j,x}^{\prime })\unicode[STIX]{x27E7}_{2}^{1}-\frac{Ma}{Pe}(c_{1,x}^{\prime }+{\it\eta}_{x}^{\prime }c_{1,y}^{\prime })=0,\end{eqnarray}$$
where the jump operator is defined as
 $\unicode[STIX]{x27E6}g_{j}\unicode[STIX]{x27E7}_{2}^{1}=g_{1}-g_{2}$
. Here,
 $Ma$
is the Marangoni number, given by
 ${\it\sigma}_{0}{\it\beta}C_{10}d_{1}/D_{1}{\it\mu}_{1}$
. We have not included the concentration difference between the plates in the Marangoni number, to allow for the possibility that the interface sensitivity parameter (
 ${\it\beta}$
) and the concentration difference (represented by
 ${\it\gamma}=C_{20}/C_{10}$
) may have independent effects on the system stability.
A similar description of solutal Marangoni effects has been used by Sternling & Scriven (Reference Sternling and Scriven1959) and Smith (Reference Smith1966) to study instabilities in stationary layered fluids. The two terms multiplied by
 $Ma$
in (2.7) derive from the surface gradient of the solute concentration (
 $\boldsymbol{{\rm\nabla}}_{s}c_{1}$
). They account for variations of interfacial tension due to a non-uniform distribution of the solute along the interface. The first term represents concentration perturbations caused by the disturbance flow. The second term accounts for concentration variations that arise along a deformed interface, when the base concentration varies transversely. This latter term is absent in the analysis of You et al. (Reference You, Zhang and Zheng2014).
Interfacial tension also exerts normal stresses which tend to maintain a flat interface. This effect is included in the normal stress balance at the interface, which reads
 $$\begin{eqnarray}\displaystyle & & \displaystyle (1+({\it\eta}_{x}^{\prime })^{2})(mp_{2}^{\prime }-p_{1}^{\prime })+2\unicode[STIX]{x27E6}({\it\eta}_{x}^{\prime })^{2}m_{j}u_{j,x}^{\prime }-{\it\eta}_{x}^{\prime }m_{j}(u_{j,y}^{\prime }+v_{j,x}^{\prime })+m_{j}v_{j,y}^{\prime }\unicode[STIX]{x27E7}_{2}^{1}\nonumber\\ \displaystyle & & \displaystyle \quad =-\frac{1}{Ca}\left(\frac{{\it\sigma}^{\ast }}{{\it\sigma}_{0}}\right)\frac{{\it\eta}_{xx}^{\prime }}{(1+({\it\eta}_{x}^{\prime })^{2})^{1/2}}.\end{eqnarray}$$
Here,
 $Ca={\it\mu}U_{0}/{\it\sigma}_{0}$
is the dimensionless capillary number, which represents the relative importance of capillary forces in comparison to viscous forces. It should be noted that because the characteristic scale for pressure in each fluid contains the respective fluid viscosity (cf. (2.1)), the dimensionless pressure is discontinuous across the interface even when the interface is flat with
 $\boldsymbol{v}_{i}^{\prime }=0$
(
 $mp_{2}^{\prime }=p_{1}^{\prime }$
in this case).
The remaining boundary conditions at the interface are the equality of velocities and the kinematic condition:
 $$\begin{eqnarray}\boldsymbol{v}_{1}^{\prime }=\boldsymbol{v}_{2}^{\prime },\end{eqnarray}$$
 $$\begin{eqnarray}{\it\eta}_{t}^{\prime }+u_{1}^{\prime }{\it\eta}_{x}^{\prime }=v_{1}^{\prime }.\end{eqnarray}$$
At the bounding plates, no-slip and no-penetration conditions are applied on the velocity field and Dirichlet conditions on the concentration field:
 $$\begin{eqnarray}u_{1}^{\prime }=v_{1}^{\prime }=0,\quad c_{1}^{\prime }=1\quad \text{at }y=1,\end{eqnarray}$$
 $$\begin{eqnarray}u_{2}^{\prime }=v_{2}^{\prime }=0,\quad c_{2}^{\prime }=\frac{C_{20}}{C_{10}}={\it\gamma}\quad \text{at }y=-n,\end{eqnarray}$$
where
 $n=d_{2}/d_{1}$
is the ratio of thicknesses of the fluid layers.
Equations (2.2)–(2.10) govern the behaviour of the layered flow system, accounting for inter-phase mass transfer of a soluble surfactant and associated Marangoni stresses. These equations extend the model used by Sternling & Scriven (Reference Sternling and Scriven1959) to the case of layered Poiseuille flow. In this simplified model, the dissipative effect of surface viscosity is neglected in comparison with that of bulk viscosity. Studies on stationary fluid layers have found that surface viscosity has a stabilizing influence, but does not significantly modify the key features of the stationary Marangoni instability (Hennenberg, Sorensen & Sanfeld Reference Hennenberg, Sorensen and Sanfeld1977; Kovalchuk & Vollhardt Reference Kovalchuk and Vollhardt2006). The model also neglects dynamic transport of the solute in the interface Gibbs adsorption layer. This idealization corresponds to the limit of instantaneous adsorption/desorption of the solute to and from the interface. As a result of this assumption, the present model cannot be reduced to the case of an insoluble surfactant by taking the limit of zero solute diffusivity within the fluids. Insoluble surfactants are trapped at the interface and can only be transported along the interface (Frenkel & Halpern Reference Frenkel and Halpern2002).
3 Base state velocity and concentration profiles
The steady base state consists of unidirectional fully developed flow with a flat inter-fluid interface. The corresponding concentration field is invariant along the flow direction. The transverse variations of the base state fields (denoted by an overbar), obtained by solving (2.2)–(2.10) are given by
 $$\begin{eqnarray}\overline{u}_{j}=1+a_{j}y+b_{j}y^{2},\quad \overline{v}_{j}=0,\end{eqnarray}$$
 $$\begin{eqnarray}\overline{c}_{j}=s_{j}y+t_{j},\quad \text{for }j=1,2,\end{eqnarray}$$
with
 $$\begin{eqnarray}a_{1}=\frac{m-n^{2}}{n(n+1)},\quad b_{1}=-\frac{m+n}{n(n+1)},\quad a_{2}=\frac{a_{1}}{m},\quad b_{2}=\frac{b_{1}}{m},\end{eqnarray}$$
 $$\begin{eqnarray}s_{1}=\frac{D_{r}(1-{\it\gamma}K)}{D_{r}+Kn},\quad t_{1}=\frac{K(n+D_{r}{\it\gamma})}{D_{r}+Kn},\quad s_{2}=\frac{s_{1}}{D_{r}},\quad t_{2}=\frac{t_{1}}{K}.\end{eqnarray}$$
The piecewise linear base concentration field has different slopes in each fluid, which depend on the diffusivity ratio and thickness ratio. The direction of mass transfer depends on
 ${\it\gamma}$
, with
 ${\it\gamma}<1/K~({>}1/K)$
corresponding to mass transfer from plate 1 to plate 2 (plate 2 to plate 1). When the plates are maintained at equilibrium (
 ${\it\gamma}=1/K$
), the concentration is constant in each fluid and no net mass transfer occurs.
Marangoni stresses are absent in the base state since the concentration is uniform along the interface. However, a perturbation to the base flow will disturb the uniformity of the concentration profile and lead to Marangoni stresses. These stresses may cause the initial perturbation to grow, resulting in an instability.
In the next section we analyse the stability of this base state to infinitesimally small perturbations.
4 Linearized equations
Infinitesimally small perturbations (denoted by a hat) are imposed on the base state (3.1) as follows:
 $$\begin{eqnarray}\displaystyle \left.\begin{array}{@{}c@{}}u_{j}^{\prime }=\overline{u}_{j}(y)+\widehat{u}_{j}(x,y,t),\quad v_{j}^{\prime }=\widehat{v}_{j}(x,y,t),\quad p_{j}^{\prime }=\overline{p}_{j}(x)+\widehat{p}_{j}(x,y,t),\\ c_{j}^{\prime }=\overline{c}_{j}(y)+\widehat{c}_{j}(x,y,t),\quad {\it\eta}^{\prime }=\widehat{{\it\eta}}(x,t),\quad j=1,2.\end{array}\right\} & & \displaystyle\end{eqnarray}$$
The disturbance velocity field can be expressed in terms of a disturbance streamfunction (
 $\widehat{{\it\psi}}_{j}$
) as
 $\widehat{u}_{j}=\partial \widehat{{\it\psi}}_{j}/\partial y$
and
 $\widehat{v}_{j}=-\partial \widehat{{\it\psi}}_{j}/\partial x$
.
We focus on a temporal stability analysis in this work, and assume classic normal mode forms for the perturbations:
 $$\begin{eqnarray}\left[\begin{array}{@{}cccc@{}}\widehat{{\it\psi}}_{j} & \widehat{p}_{j} & \widehat{c}_{j} & \widehat{{\it\eta}}\end{array}\right]=\left[\begin{array}{@{}cccc@{}}{\it\psi}_{j}(y) & p_{j}(y) & c_{j}(y) & h\end{array}\right]\exp [\text{i}{\it\alpha}(x-{\it\omega}t)]+\text{c.c.},\end{eqnarray}$$
where c.c. denotes the respective complex conjugate and
 ${\it\psi}_{j},\,p_{j},\,c_{j}$
and
 $h$
are complex amplitudes of the corresponding normal modes. The streamwise wavenumber
 ${\it\alpha}$
is real while the wave speed
 ${\it\omega}$
is complex (
 ${\it\omega}={\it\omega}_{r}+\text{i}{\it\omega}_{i}$
). The growth rate of each normal mode is given by
 ${\it\alpha}{\it\omega}_{i}$
. Hence, the system is unstable if
 ${\it\omega}_{i}>0$
for any
 ${\it\alpha}$
.
The governing equations (2.2) are linearized about the base state (3.1) to obtain evolution equations for the disturbance fields. Applying the streamfunction formulation and adopting the normal mode form of perturbations, we obtain
 $$\begin{eqnarray}\displaystyle & \displaystyle \text{i}{\it\alpha}Re[(\overline{u}_{j}-{\it\omega})(\mathscr{D}^{2}-{\it\alpha}^{2}){\it\psi}_{j}-2b_{j}{\it\psi}_{j}]=m_{j}(\mathscr{D}^{2}-{\it\alpha}^{2})^{2}{\it\psi}_{j}, & \displaystyle\end{eqnarray}$$
 $$\begin{eqnarray}\displaystyle & \displaystyle \text{i}{\it\alpha}Pe[(\overline{u}_{j}-{\it\omega})c_{j}-s_{j}{\it\psi}_{j}]=D_{r,j}(\mathscr{D}^{2}-{\it\alpha}^{2})c_{j}, & \displaystyle\end{eqnarray}$$
 $\mathscr{D}$
refers to differentiation with respect to
 $y$
, i.e.
 $\mathscr{D}=\text{d}/\text{d}y$
. The boundary conditions at the interface are simplified for the case of small deflections (
 $h\ll 1$
) using the domain perturbation technique (Johns & Narayanan Reference Johns and Narayanan2002). The resulting boundary conditions for the normal mode amplitudes are
 $$\begin{eqnarray}\displaystyle & \displaystyle {\it\psi}_{1}(1)=\mathscr{D}{\it\psi}_{1}(1)=c_{1}(1)={\it\psi}_{2}(-n)=\mathscr{D}{\it\psi}_{2}(-n)=c_{2}(-n)=0, & \displaystyle\end{eqnarray}$$
 $$\begin{eqnarray}\displaystyle & \displaystyle \mathscr{D}{\it\psi}_{1}(0)+ha_{1}=\mathscr{D}{\it\psi}_{2}(0)+ha_{2}, & \displaystyle\end{eqnarray}$$
 $$\begin{eqnarray}\displaystyle & \displaystyle {\it\psi}_{1}(0)={\it\psi}_{2}(0), & \displaystyle\end{eqnarray}$$
 $$\begin{eqnarray}\displaystyle & \displaystyle c_{1}(0)+hs_{1}=K(c_{2}(0)+hs_{2}), & \displaystyle\end{eqnarray}$$
 $$\begin{eqnarray}\displaystyle & \displaystyle \mathscr{D}c_{1}(0)=D_{r}\mathscr{D}c_{2}(0), & \displaystyle\end{eqnarray}$$
 $$\begin{eqnarray}\displaystyle & \displaystyle (\mathscr{D}^{2}+{\it\alpha}^{2}){\it\psi}_{1}(0)-m(\mathscr{D}^{2}+{\it\alpha}^{2}){\it\psi}_{2}(0)=\text{i}{\it\alpha}\frac{Ma}{Pe}(c_{1}(0)+hs_{1}), & \displaystyle\end{eqnarray}$$
 $$\begin{eqnarray}\displaystyle & \displaystyle m\mathscr{D}^{3}{\it\psi}_{2}(0)-\mathscr{D}^{3}{\it\psi}_{1}(0)-3{\it\alpha}^{2}(m\mathscr{D}{\it\psi}_{2}(0)-\mathscr{D}{\it\psi}_{1}(0))=(1/Ca)\,\text{i}{\it\alpha}^{3}h, & \displaystyle\end{eqnarray}$$
 $$\begin{eqnarray}\displaystyle & \displaystyle ({\it\omega}-1)h={\it\psi}_{1}(0). & \displaystyle\end{eqnarray}$$
 ${\it\sigma}_{0}$
(cf. (2.6)) is taken to be the interface concentration in the base state (
 $c_{r}^{\prime }=\bar{c}_{1}(0)=t_{1}$
). It should be noted that (4.4b
) and (4.4c
) are obtained from the
 $x$
and
 $y$
components of the continuity of velocity condition (2.9), while (4.4h
) is obtained from the kinematic equation (2.10).
Equations (4.3) and (4.4) constitute a linear differential eigenvalue problem with
 ${\it\omega}$
as the eigenvalue. For the system to be stable, the entire spectrum of eigenvalues must lie in the lower half of the complex plane (
 ${\it\omega}_{i}<0$
).
5 Energy budget
To aid in the analysis of instability modes, we carry out an energy budget analysis. Following the procedure described in Boomkamp & Miesen (Reference Boomkamp and Miesen1996) and Lin & Chen (Reference Lin and Chen1998), we take the inner product of the linearized momentum equations with the perturbation velocity vector (
 $\widehat{\boldsymbol{v}}_{j}$
) and integrate across the transverse direction in each fluid. The Gauss divergence theorem is applied to the stress integrals and the entire equation is averaged over one axial wavelength
 ${\it\lambda}=2{\rm\pi}/{\it\alpha}$
and one time period
 $T=2{\rm\pi}/({\it\alpha}{\it\omega}_{R})$
. This results in the following mechanical energy balance equation:
 $$\begin{eqnarray}\displaystyle \mathop{\sum }_{j=1}^{2}KE_{j}=\mathop{\sum }_{j=1}^{2}REY_{j}+\mathop{\sum }_{j=1}^{2}DIS_{j}+NOR+TAN_{{\it\mu}}+MAS_{I}+MAS_{F}, & & \displaystyle\end{eqnarray}$$
where
 $$\begin{eqnarray}\displaystyle & \displaystyle KE_{j}=\frac{Re}{T{\it\lambda}}\int _{0}^{T}\,\text{d}t\int _{0}^{{\it\lambda}}\text{d}x\int _{e_{j}}^{f_{j}}\,\text{d}y\left[\frac{\text{d}}{\text{d}t}\left(\frac{\widehat{u}_{j}^{2}+\widehat{v}_{j}^{2}}{2}\right)\right], & \displaystyle\end{eqnarray}$$
 $$\begin{eqnarray}\displaystyle & \displaystyle REY_{j}=-\frac{Re}{T{\it\lambda}}\int _{0}^{T}\,\text{d}t\int _{0}^{{\it\lambda}}\text{d}x\int _{e_{j}}^{f_{j}}\,\text{d}y\left[\widehat{u}_{j}\widehat{v}_{j}\frac{\text{d}\overline{u}_{j}}{\text{d}y}\right], & \displaystyle\end{eqnarray}$$
 $$\begin{eqnarray}\displaystyle & \displaystyle DIS_{j}=-\frac{m_{j}}{T{\it\lambda}}\int _{0}^{T}\,\text{d}t\int _{0}^{{\it\lambda}}\text{d}x\int _{e_{j}}^{f_{j}}\,\text{d}y\left[2\widehat{u}_{j,x}^{2}+2\widehat{v}_{j,y}^{2}+(\widehat{u}_{j,y}+\widehat{v}_{j,x})^{2}\right], & \displaystyle\end{eqnarray}$$
 $$\begin{eqnarray}\displaystyle & \displaystyle NOR=\frac{1}{T{\it\lambda}Ca}\int _{0}^{T}\,\text{d}t\int _{0}^{{\it\lambda}}\text{d}x\left[\widehat{v}_{1}\widehat{{\it\eta}}_{xx}\right]_{y=0}, & \displaystyle\end{eqnarray}$$
 $$\begin{eqnarray}\displaystyle & \displaystyle TAN_{{\it\mu}}=\frac{1}{T{\it\lambda}}\int _{0}^{T}\,\text{d}t\int _{0}^{{\it\lambda}}\text{d}x\left[(\widehat{u}_{2}-\widehat{u}_{1})(\widehat{u}_{1,y}+\widehat{v}_{1,x})\right]_{y=0}, & \displaystyle\end{eqnarray}$$
 $$\begin{eqnarray}\displaystyle & \displaystyle MAS_{I}=-\frac{1}{T{\it\lambda}}\frac{Ma}{Pe}\int _{0}^{T}\,\text{d}t\int _{0}^{{\it\lambda}}\text{d}x\left[\widehat{u}_{2}\widehat{{\it\eta}}_{x}\frac{\text{d}\overline{c}_{1}}{\text{d}y}\right]_{y=0}, & \displaystyle\end{eqnarray}$$
 $$\begin{eqnarray}\displaystyle & \displaystyle MAS_{F}=-\frac{1}{T{\it\lambda}}\frac{Ma}{Pe}\int _{0}^{T}\,\text{d}t\int _{0}^{{\it\lambda}}\text{d}x\left[\widehat{u}_{2}\widehat{c}_{1,x}\right]_{y=0}. & \displaystyle\end{eqnarray}$$
Here,
 $j=1,\,e_{1}=0,\,f_{1}=1$
for fluid 1 and
 $j=2,\,e_{2}=-n,\,f_{2}=0$
for fluid 2.
On the left-hand side of the mechanical energy balance is the sum of the disturbance kinetic energies of the two fluids. This term is positive when a finite
 $Re$
flow is unstable. On the right-hand side are six different work terms, which either produce kinetic energy or consume it. The term
 $\sum _{j=1}^{2}REY_{j}$
is the total energy transferred from the base state to the disturbance flow by Reynolds stresses. This term becomes important only at relatively high
 $Re$
. The next term,
 $\sum _{j=1}^{2}DIS_{j}$
, is always negative (cf. (5.4)) and represents viscous dissipation. The other four terms correspond to work done by stresses at the interface. The term
 $NOR$
represents the contribution from normal capillary forces while
 $TAN_{{\it\mu}}$
is associated with the viscosity difference between the fluids. When the viscosities are unequal,
 $\widehat{u}_{2}\neq \widehat{u}_{1}$
(cf. (4.4b
)) and this term can transfer energy to the disturbance flow. It is responsible for the viscosity-induced instability, first identified by Yih (Reference Yih1967), that occurs at small but finite
 $Re$
. The last two terms are associated with Marangoni stresses due to a non-uniform distribution of soluble surfactant at the interface. The term
 $MAS_{I}$
accounts for concentration variations caused by interface deformation when the base concentration field varies in the transverse direction. The transverse concentration gradient causes the crest and trough of a deformed interface to have different solute concentrations and hence different values of interfacial tension. The second Marangoni stress term,
 $MAS_{F}$
, is caused by concentration perturbations associated with the disturbance flow. This term will be present even if the interface is flat. These two mechanisms were identified by Goussis & Kelly (Reference Goussis and Kelly1990) in the context of thermocapillary instability of a flowing heated liquid film.
Analogously to the mechanical energy equation (5.1), we derive a balance equation for a concentration energy functional in each fluid, defined as
 $\widehat{c}_{j}^{2}/2$
. Because the kinetic energy is identically zero in creeping flow (
 $KE_{j}=0$
), the presence of an instability cannot be detected from the mechanical energy equation. Instead, the growth of the concentration energy functional can be used to identify an instability. In addition, this equation provides insight into the growth of concentration perturbations.
This equation is derived by multiplying the linearized solute balance with
 $\widehat{c}_{j}$
, integrating across the fluids and averaging over one axial wavelength
 ${\it\lambda}=2{\rm\pi}/{\it\alpha}$
and one time period
 $T=2{\rm\pi}/({\it\alpha}{\it\omega}_{R})$
. Using the Gauss divergence theorem, we obtain
 $$\begin{eqnarray}\displaystyle & \displaystyle \mathop{\sum }_{j=1}^{2}E_{j}^{c}=\mathop{\sum }_{j=1}^{2}DIF_{j}+\mathop{\sum }_{j=1}^{2}CONT_{j}+INT, & \displaystyle\end{eqnarray}$$
 $$\begin{eqnarray}\displaystyle & \displaystyle E_{j}^{c}=\frac{1}{T{\it\lambda}}\int _{0}^{T}\,\text{d}t\int _{0}^{{\it\lambda}}\text{d}x\int _{e_{j}}^{f_{j}}\,\text{d}y\left[\frac{\text{d}}{\text{d}t}\left(\frac{\widehat{c}_{j}^{2}}{2}\right)\right], & \displaystyle\end{eqnarray}$$
 $$\begin{eqnarray}\displaystyle & \displaystyle DIF_{j}=-\frac{D_{r,j}}{Pe}\frac{1}{T{\it\lambda}}\int _{0}^{T}\,\text{d}t\int _{0}^{{\it\lambda}}\text{d}x\int _{e_{j}}^{f_{j}}\,\text{d}y\left[\widehat{c}_{j,x}^{2}+\widehat{c}_{j,y}^{2}\right], & \displaystyle\end{eqnarray}$$
 $$\begin{eqnarray}\displaystyle & \displaystyle CONT_{j}=-\frac{1}{T{\it\lambda}}\int _{0}^{T}\,\text{d}t\int _{0}^{{\it\lambda}}\text{d}x\int _{e_{j}}^{f_{j}}\,\text{d}y\left[\widehat{c}_{j}\widehat{v}_{j}\frac{\text{d}\overline{c}_{j}}{\text{d}y}\right], & \displaystyle\end{eqnarray}$$
 $$\begin{eqnarray}\displaystyle & \displaystyle INT=-\frac{1}{Pe}\frac{1}{T{\it\lambda}}\int _{0}^{T}\,\text{d}t\int _{0}^{{\it\lambda}}\text{d}x\left[(\widehat{c}_{1}-\widehat{c}_{2})\widehat{c}_{1,y}\right]_{y=0}. & \displaystyle\end{eqnarray}$$
The dynamics of the concentration energy functional is governed by the three terms on the right-hand side. The
 $DIF_{j}$
term is always negative (cf. (5.11)) and represents the damping effect of diffusion. The other two terms can cause concentration disturbances to grow. The term
 $CONT_{j}$
is associated with bulk convection effects in the transverse direction. This term contributes only in the presence of a finite base state concentration gradient (
 $\text{d}\overline{c}_{j}/\text{d}y\neq 0$
). The term
 $INT$
is associated with a jump in the disturbance concentration across the interface, which occurs if the solute has a greater affinity for one of the fluids (
 $K\neq 1$
), or has a greater diffusivity in one of the fluids (
 $D_{r}\neq 1$
), or both (cf. (4.4d
) and (3.1c
)).
These energy balance equations are used to gain insight into the mechanism driving an instability. The eigenfunctions, calculated by solving (4.3) and (4.4), are substituted into the energy equations. The terms with large magnitudes correspond to dominant effects. The signs of these terms show whether they are stabilizing (negative) or destabilizing (positive) influences. Therefore, identification of the largest positive work term in the energy equation helps in identifying the source of the instability.
6 Long-wave asymptotic analysis
In this section we obtain an asymptotic solution to the eigenvalue problem (4.3)–(4.4) in the limit of long waves (
 ${\it\alpha}\rightarrow 0$
). In order to understand the interaction of inertial and Marangoni effects, we assume both
 $Re$
and
 $Ma$
to be
 $O(1)$
. Other parameters
 $(m,n,k,D_{r},Ca,Pe,{\it\gamma})$
are also assumed to be
 $O(1)$
. The solution is obtained as a regular perturbation expansion in
 ${\it\alpha}$
, which yields the following expression for
 ${\it\alpha}{\it\omega}$
:
 $$\begin{eqnarray}\displaystyle {\it\alpha}{\it\omega}\! & = & \displaystyle \!{\it\alpha}\left[1+\frac{2n(m-1)(m-n^{2})}{m^{2}+4mn+6mn^{2}+4mn^{3}+n^{4}}\right]\nonumber\\ \displaystyle & & \displaystyle +\,\text{i}{\it\alpha}^{2}\left[\frac{Ma}{Pe}\frac{D_{r}Kn^{2}(n+1)(n^{2}-m)(1-{\it\gamma}K)}{2(D_{r}+Kn)^{2}(m^{2}+4mn+6mn^{2}+4mn^{3}+n^{4})}\right.\nonumber\\ \displaystyle & & \displaystyle \left.-\,Re\frac{(n^{2}-m)(m-1)G(n,m)}{420m^{2}(1+n)^{2}(m^{2}+4mn+6mn^{2}+4mn^{3}+n^{4})^{3}}\right]+O({\it\alpha}^{3}).\end{eqnarray}$$
The speed of a travelling wave mode of wavelength
 ${\it\alpha}$
is given by
 ${\it\omega}_{r}$
, while its growth rate is given by
 ${\it\alpha}{\it\omega}_{i}$
(the imaginary part of (6.1)). The growth rate consists of two terms: the first is due to Marangoni effects while the second accounts for the viscosity-induced mode that is active at non-zero
 $Re$
. The latter term is the same as that obtained by Yiantsios & Higgins (Reference Yiantsios and Higgins1988) (verified by reproducing figure 2(a) of their paper). The expression for
 $G(n,m)$
is given in appendix A. Numerical evaluation shows this function to be positive definite over a wide range of
 $n$
and
 $m$
, spanning
 $(10^{-4},10^{4})$
in both parameters.
Let us first focus on the case of creeping flow (
 $Re=0$
), wherein only Marangoni effects are important. From (6.1) it is clear that long waves become unstable when
 $n^{2}>m$
, provided that mass transfer occurs from fluid 1 to fluid 2 (
 ${\it\gamma}<1/K$
) and interfacial tension decreases with increasing solute concentration (
 $Ma>0$
, i.e.
 ${\it\beta}>0$
). The magnitude of the growth rate is seen to increase with the sensitivity of interfacial tension to surfactant concentration (i.e. it increases with
 $Ma$
) and with the applied concentration difference across the plates (
 $1-{\it\gamma}K$
).
Switching the direction of mass transfer (i.e. having
 ${\it\gamma}>1/K$
) inverts the condition for long-wave instability to
 $n^{2}<m$
. Thus, for a given pair of fluids and thickness ratio, the direction of mass transfer decides whether a long-wave instability is present or not. This relation between long-wave instability and the direction of mass transfer will reverse in the case where the soluble surfactant has the relatively uncommon property of increasing the interfacial tension by its presence at the interface (
 $Ma<0$
) (Harkins & Humphery Reference Harkins and Humphery1916; Evans Reference Evans1937; Wang & Anderko Reference Wang and Anderko2013). In the remainder of this work, we assume that mass transfer occurs from phase 1 to phase 2 (
 ${\it\gamma}<1/K$
) and that
 $Ma>0$
.
In the case of the thermocapillary problem, interfacial tension always decreases with increasing temperature (
 $Ma>0$
). Consequently, long waves will be unstable when
 $n^{2}>m$
, provided that plate 1 is hotter than plate 2.
Some insight into the role of the diffusivity ratio
 $D_{r}$
is provided by (6.1). The ratio
 $D_{r}$
is seen to affect only the magnitude of the growth rate, but not its sign. Therefore, it plays no role in the condition for instability. This is in contrast to the case of solutal Marangoni instability in stationary fluid layers, wherein the system can be unstable if mass transfer occurs from the fluid of lower diffusivity to that of higher diffusivity, even though the viscosity and thickness ratios are unity (
 $n^{2}=m=1$
) (Sternling & Scriven Reference Sternling and Scriven1959; Schwarzenberger et al.
Reference Schwarzenberger, Köllner, Linde, Boeck, Odenbach and Eckert2014).
The maximum growth rate occurs at
 $D_{r}=Kn$
. These properties correspond to a base state concentration profile in which the interface concentration is a weighted mean of the wall concentrations:
 $\bar{c_{1}}(0)=K\bar{c_{2}}(0)=(C_{10}+KC_{20})/2$
. In the thermocapillary problem,
 $K=1$
, and the base state interface temperature for maximum instability is the arithmetic mean of the wall temperatures.
When
 $Re$
is non-zero, the growth rate is affected by the presence of the viscosity-induced mode that is associated with a discontinuity of the slope of the base state velocity profile at the interface (Yiantsios & Higgins Reference Yiantsios and Higgins1988; Boomkamp & Miesen Reference Boomkamp and Miesen1996). This discontinuity occurs when the viscosities are unequal (
 $m\neq 1$
), provided that the shear rate is non-zero at the interface (
 $n^{2}\neq m$
). Equation (6.1) shows that this mode can either counteract the long-wave Marangoni instability or support it, depending on the viscosity ratio. For example, if
 ${\it\gamma}<1/K$
,
 $n^{2}>m$
and
 $Ma>0$
, then the Marangoni instability is suppressed (enhanced) on increasing
 $Re$
if
 $m>1$
(
 $m<1$
). In such a case, the onset of long-wave instability will occur only if
 $Ma$
is increased beyond a non-zero critical value. This critical threshold will increase with
 $Re$
. On the other hand, if
 $n^{2}<m$
(
 $m>1$
) then the viscosity-induced mode will cause the growth rate to increase while Marangoni effects exert a stabilizing influence. A similar interaction between long-wave Marangoni and viscosity-induced modes was identified in thermocapillary Couette flow by Wei (Reference Wei2006).
7 Numerical solution
The eigenvalue problem (4.3)–(4.4) is solved numerically for arbitrary wavenumbers using the Chebyshev spectral collocation method described by Boomkamp et al. (Reference Boomkamp, Boersma, Miesen and Beijnon1997). The dependent variables,
 ${\it\psi}_{j}$
and
 $c_{j}$
, are expressed as series expansions of Chebyshev polynomials. Equations for the coefficients of the expansions are obtained by collocation of the governing equations on the interior points of a Gauss–Lobatto grid. Boundary conditions are applied at the boundary nodes. The result is a generalized
 $(N\times N)$
matrix eigenvalue problem of the form
 $\unicode[STIX]{x1D63C}\boldsymbol{x}={\it\omega}\unicode[STIX]{x1D63D}\boldsymbol{x}$
. Here,
 $\boldsymbol{x}$
is vector of
 $N$
unknowns, which includes the
 $(N-1)/4$
coefficients in each Chebyshev polynomial expansion (for
 ${\it\psi}_{1},{\it\psi}_{2},c_{1}$
and
 $c_{2}$
) and the amplitude of interface deformation
 $(h)$
. The matrix
 $\unicode[STIX]{x1D63D}$
is singular due to the presence of zero rows (
 $M$
in number) arising from the boundary conditions that do not contain
 ${\it\omega}$
. Following Boomkamp et al. (Reference Boomkamp, Boersma, Miesen and Beijnon1997), we use the corresponding
 $M$
equations to solve for
 $M$
unknown coefficients and replace them in the remaining
 $N-M$
equations. The result is an
 $(N-M)\times (N-M)$
generalized eigenvalue problem
 $\unicode[STIX]{x1D63C}^{\prime }\boldsymbol{x}^{\prime }={\it\omega}\unicode[STIX]{x1D63D}^{\prime }\boldsymbol{x}^{\prime }$
in which
 $\unicode[STIX]{x1D63D}^{\prime }$
is invertible. The eigenvalue spectrum is obtained using the QZ algorithm (generalized Schur decomposition). To obtain
 ${\it\psi}_{j}$
and
 $c_{j}$
, the eigenvectors
 $\boldsymbol{x}^{\prime }$
must be transformed back to
 $\boldsymbol{x}$
.
The computation is simplified in the case of creeping flow (
 $Re=0$
) because the momentum equations (4.3a
) simplify to
 $$\begin{eqnarray}(\mathscr{D}^{2}-{\it\alpha}^{2})^{2}{\it\psi}_{j}=0,\quad \text{for }j=1,2.\end{eqnarray}$$
These equations (7.1) can be solved analytically to yield
 $$\begin{eqnarray}\displaystyle & \displaystyle {\it\psi}_{1}={\it\theta}_{1}\cosh ({\it\alpha}y)+{\it\theta}_{2}\sinh ({\it\alpha}y)+{\it\theta}_{3}y\cosh ({\it\alpha}y)+{\it\theta}_{4}y\sinh ({\it\alpha}y), & \displaystyle\end{eqnarray}$$
 $$\begin{eqnarray}\displaystyle & \displaystyle {\it\psi}_{2}={\it\theta}_{6}\cosh ({\it\alpha}y)+{\it\theta}_{7}\sinh ({\it\alpha}y)+{\it\theta}_{8}y\cosh ({\it\alpha}y)+{\it\theta}_{9}y\sinh ({\it\alpha}y), & \displaystyle\end{eqnarray}$$
 ${\it\theta}_{j}$
are arbitrary constants of integration. These expressions are substituted into the concentration equations (4.3b
), which are solved by the aforementioned Chebyshev spectral method.
In the limit of
 $Ma\rightarrow 0$
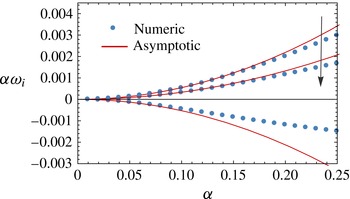
, the current system reduces to plane Poiseuille flow, the stability of which has been studied by Yiantsios & Higgins (Reference Yiantsios and Higgins1988). We have verified our numerical solution in this limit by comparing with their results. We have also compared our numerical predictions with the long-wave asymptotic expansion (6.1). The two are in good agreement in the limit of small
 ${\it\alpha}$
, as shown in figure 2. In this figure the long-wave Marangoni instability is stabilized as
 $Re$
is increased. This is in accordance with the prediction of (6.1) for the case of
 $n^{2}>m$
and
 $m>1$
.
Comparison of the dispersion curve obtained numerically using the spectral method with the long-wavelength asymptotic relation (6.1). Three cases, corresponding to
 $Re=0$
, 10, 50 are depicted. The arrow indicates the direction of increasing
 $Re$
. Other parameter values:
 $Ma=10$
,
 $Ca=1$
,
 $m=1.5$
,
 $n=2$
,
 $D_{r}=0.5$
,
 $K=0.5$
,
 $Pe=2$
,
 ${\it\gamma}=0.5$
.

8 Instabilities in creeping flow: long-wave and short-wave modes
From this section onwards, we analyse the stability of the system to perturbations of all wavelengths, using the spectral collocation method. The ranges of values for
 $Ma$
and
 $Pe$
selected for numerical calculations are appropriate to layered microchannel flows. In microchannels with dimensions of 50–
 $200~{\rm\mu}\text{m}$
, the flow rate of layered flow ranges from 20 to
 $150~{\rm\mu}\text{l}~\text{min}^{-1}$
(Hotokezaka et al.
Reference Hotokezaka, Tokeshi, Harada, Kitamori and Ikeda2005; Znidarsic-Plazl & Plazl Reference Znidarsic-Plazl and Plazl2007; Fries et al.
Reference Fries, Voitl and von Rohr2008). Considering typical values of solute diffusivity of
 $O(10^{-9})~\text{m}^{2}~\text{s}^{-1}$
and liquid viscosity of
 $O(10^{-3})$
Pa s, we obtain a value of
 $Pe$
of
 $O(10^{3})$
–
 $O(10^{4})$
. The magnitude of the variation of interfacial tension with concentration (
 ${\it\sigma}_{0}{\it\beta}$
) is typically of
 $O(10^{-6})~\text{N}~\text{m}^{2}~\text{mol}^{-1}$
(Sternling & Scriven Reference Sternling and Scriven1959). This results in a value of
 $Ma$
of
 $O(10^{3}){-}O(10^{4})$
. The value of
 $Ca$
is varied over a wide range to uncover all instability modes of the system and understand their behaviour. The value of
 $Ca$
in microchannels, however, is rather small, of
 $O(10^{-3}){-}O(10^{-1})$
.
The value of
 $Re$
for layered microchannel flows ranges from
 $O(1)$
to
 $O(10)$
, which is small, but not negligible. Nevertheless, we first analyse the case of creeping flow (
 $Re=0$
), wherein Marangoni effects are the only source of instability. After understanding the pure Marangoni instabilities, the influence of small but finite
 $Re$
is examined. We begin in this section by identifying different types of Marangoni instability modes, in the limit of creeping flow, and study their characteristic features.
The numerical solution of the linear stability equations (4.3) and (4.4) yields a spectrum of eigenvalues for each wavenumber
 ${\it\alpha}$
. Of these, only two eigenvalues that have the largest and second largest imaginary parts play a role in deciding the system stability. As
 ${\it\alpha}$
is varied, these two eigenvalues trace out separate dispersion curves, which we label M1 and M2. Depending on parameter values, these two branches of eigenvalues can attain positive growth rates and render the system unstable. The real parts of the eigenvalues are always non-zero, indicating that all modes have the form of travelling waves.
The asymptotic analysis for
 ${\it\alpha}\rightarrow 0$
in § 6 (cf. (6.1)) revealed that the system is unstable for small
 ${\it\alpha}$
when
 $n^{2}>m$
(provided that mass transfer occurs from plate 1 to 2 or
 ${\it\gamma}<1/K$
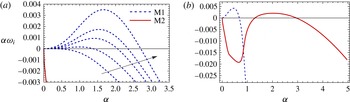
). Dispersion curves for such a case are plotted in figure 3(a). Five different values of
 $Ma$
are considered in this figure. The M1 branch is seen to be unstable for a range of wavenumbers that extends from zero to some positive wavenumber
 ${\it\alpha}_{0}$
. As
 $Ma$
is decreased to zero, the range of unstable wavenumbers shrinks and
 ${\it\alpha}_{0}\rightarrow 0$
. Based on these features, this mode is termed a long-wave (LW) instability. In this figure, the M2 branch is seen to be stable for all
 ${\it\alpha}$
. This indicates that the long-wave analysis of § 6 only describes the asymptotic behaviour of the M1 branch of eigenvalues and not the M2 branch.
In all of our numerical calculations, the M2 branch is found to be stable for
 ${\it\alpha}$
near zero. On the other hand, it can become unstable for a range of relatively large wavenumbers that are bounded away from zero. Such a case is shown in figure 3(b). In this figure, the M1 mode is unstable to long waves, while the M2 mode is unstable to short waves (SWs).
Dispersion curves for the case of
 $n^{2}>m$
, wherein long waves are unstable. (a) Mode M1 is manifested as a long-wave instability. Dispersion curves are shown for a series of Marangoni numbers: 1, 1372.652, 3372.652, 5372.652, 11372.652. The arrow indicates the direction of increasing
 $Ma$
. Other parameter values:
 $Ca=100$
,
 $m=1.5$
,
 $n=1.24$
,
 $D_{r}=0.5$
,
 $K=0.5$
,
 $Pe=2000$
,
 ${\it\gamma}=0.5$
. (b) Simultaneous instability of M1 long waves and M2 short waves. Parameter values:
 $Ma=10\,000$
,
 $Ca=1$
,
 $m=0.9$
,
 $n=1.3$
,
 $D_{r}=0.5$
,
 $K=1.2$
,
 $Pe=1000$
,
 ${\it\gamma}=0$
.

Next, we consider the case of
 $n^{2}<m$
, for which the system is stable to long waves (
 ${\it\alpha}\rightarrow 0$
), according to the asymptotic analysis (cf. (6.1)). In this case, only short-wave modes can become unstable. They can originate from either the M1 branch or the M2 branch, provided that
 $Ma$
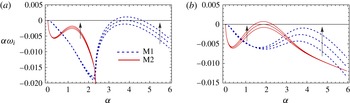
is sufficiently large. Figure 4(a) depicts a case in which the system just becomes unstable to M1 short waves as
 $Ma$
is increased. Figure 4(b) shows the alternate case, wherein M2 short waves become unstable. As is apparent in both figures, short-wave modes become unstable only when
 $Ma$
is increased beyond a positive critical value. Beyond this value, a range of wavenumbers, bounded away from zero, become unstable. Typically, the range of unstable wavenumbers grows as
 $Ma$
is increased, as seen in figure 4.
Two instability modes M1 and M2 are manifested as short-wave instabilities beyond a critical Marangoni number. (a) Mode M1 becomes unstable;
 $Ca=10$
,
 $Ma=11\,631.21$
, 12 231.21, 12 831.21. (b) Mode M2 becomes unstable;
 $Ca=100$
,
 $Ma=9932.65$
, 10 832.65, 11 732.65. Other parameter values:
 $m=1.5$
,
 $n=1$
,
 $D_{r}=0.5$
,
 $K=0.5$
,
 $Pe=2000$
,
 ${\it\gamma}=0.5$
. The arrow indicates the direction of increasing
 $Ma$
.

In figures 4(a) and 4(b), only one short-wave mode is unstable in each case. However, the other short wave is not far from being unstable. In fact, if
 $Ma$
is increased to larger values, then both short-wave modes can become unstable simultaneously. An example of this is shown in figure 5(a). The parameters here are the same as in figure 4(b), except that
 $Ma$
is larger.
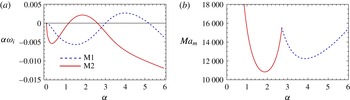
(a) Dispersion curve showing instability to both short-wave modes simultaneously
 $(Ma=13\,732.65)$
. (b) Neutral stability curve. Parameter values are given in the caption to figure 4(b).

The dispersion curves plotted in figures 4(a,b) and 5(a) are useful for distinguishing the type of instability mode and for comparing their relative growth rates when
 $Ma$
is supercritical. However, the condition for stability of the system is more concisely represented by a neutral stability diagram. Figure 5(b) depicts such a diagram for the case studied in figures 4(b) and 5(a). This figure is obtained by determining the value of
 $Ma$
at which the growth rate of the largest eigenvalue is zero (called the marginal Marangoni number
 $Ma_{m}$
), as a function of the wavenumber. The system is stable below this curve and unstable above it. The curve has two local minima, corresponding to the two short-wave modes. The global minimum of
 $Ma_{m}$
is the critical Marangoni number (
 $Ma_{c}$
), above which the system first becomes unstable. In figure 5(b),
 $Ma_{c}=10\,832.65$
and corresponds to the M2-SW mode. This implies that the M2-SW mode is critical at the onset of instability (as seen in figure 4
b). The Marangoni number
 $Ma$
must be increased to supercritical values beyond 12 500 for the M1-SW mode to become unstable as well.
The two short-wave instability modes (figure 4) differ from the long-wave instability (figure 3) not only in the qualitative nature of their dispersion curves, but also in their mechanical energy budgets. Table 1 presents the energy analysis for a long-wave mode from figure 3 (corresponding to the fastest growing mode at
 $Ma=3732.652$
), the critical M1-SW mode from figure 4(a) and the critical M2-SW mode from figure 4(b). In all cases, dissipation due to viscous forces is balanced primarily by Marangoni stress terms, affirming the fundamental association of these instabilities with solutal Marangoni forces. However, in the case of long waves,
 $MAS_{I}$
is the dominant positive work term, whereas
 $MAS_{F}$
is the dominant positive term for both short-wave modes. Thus, the long-wave instability is caused by concentration variations due to a deforming interface while the short-wave instabilities are caused by concentration perturbations associated with the disturbance flow.
Mechanical energy budget for the long-wave and short-wave modes in figures 3 and 4. The values have been normalized by the magnitude of the total dissipation
 $\sum _{j=1}^{2}DIS_{j}$
. The long-wave and short-wave modes have different energy signatures, with the dominant positive work term being
 $MAS_{I}$
in the case of long waves and
 $MAS_{F}$
in the case of short waves;
 $KE_{i}$
and
 $REY_{i}$
are identically zero in the creeping flow limit. Parameter values are as given in the captions to figures 3 and 4.

In summary, the system is susceptible to three different types of instability modes in the creeping flow limit: M1 long waves and M1 and M2 short waves. The M1 branch exhibits long waves if
 $n^{2}>m$
, and short waves otherwise. The M2 branch, on the other hand, only exhibits a short-wave instability. However, these short-wave modes can become unstable at any values of
 $m$
and
 $n$
, if
 $Ma$
is increased sufficiently (cf. figure 3
b for
 $n^{2}>m$
and figure 4
b for
 $n^{2}<m$
).
Long- and short-wave creeping flow instabilities also occur in the presence of an insoluble surfactant that is restricted to the inter-fluid interface (Halpern & Frenkel Reference Halpern and Frenkel2003). However, only two instability modes are present in that case – one long-wave and one short-wave. Both modes belong to the same branch of eigenvalues. The dynamics is therefore richer in the present case of a soluble surfactant. The additional short-wave mode from the M2 branch introduces the possibility of instability to long- and short-wave modes simultaneously (e.g. figure 3 b). Such a scenario is not observed when the surfactant is insoluble.
9 Switching between short-wave modes
In this section we focus on the M1 and M2 short-wave modes which can be simultaneously unstable when
 $n^{2}<m$
. Figure 4 in § 8 demonstrated that the M1-SW mode is critical for small
 $Ca$
while the M2-SW mode is critical for large
 $Ca$
(
 ${\it\mu}U_{0}/{\it\sigma}_{0}$
). To study the transition of the critical mode with
 $Ca$
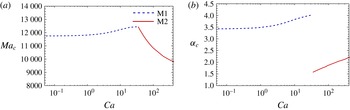
, we plot the critical Marangoni number (
 $Ma_{c}$
) at which the system first becomes unstable and the wavenumber of the corresponding critical mode (
 ${\it\alpha}_{c}$
) as a function of
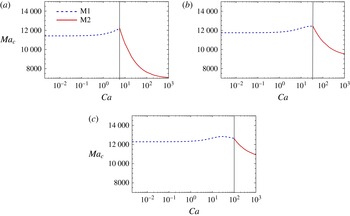
 $Ca$
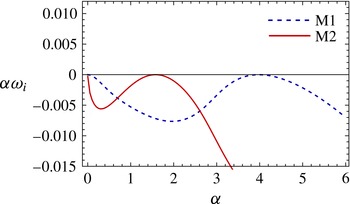
in figure 6. Here, the critical mode is seen to switch from the M1-SW mode to the M2-SW mode as
 $Ca$
is increased. At the transition point, located at
 $Ca=35$
, both modes are critical, as shown in figure 7. Across this point there is a jump in the critical wavenumber (cf. figure 6
b). This point is a codimension-two bifurcation point at which the nature of the mode at the onset of instability changes abruptly.
Switching between short-wave modes M1 and M2 as
 $Ca$
is varied. (a) Plot of the critical Marangoni number (
 $Ma_{c}$
). (b) Plot of the critical wavenumber (
 ${\it\alpha}_{c}$
). Parameter values:
 $n=1$
,
 $m=1.5$
,
 $D_{r}=0.5$
,
 $K=0.5$
,
 $Pe=2000$
,
 ${\it\gamma}=0.5$
.

Dispersion curves at the bicritical point corresponding to the transition from critical M1-SW modes to critical M2-SW modes (codimension-two bifurcation point). Parameter values:
 $m=1.5$
,
 $n=1$
,
 $Ca=35$
,
 $Ma=12\,430.34$
,
 $K=0.5$
,
 $Pe=2000$
,
 ${\it\gamma}=0.5$
.

The transition between modes is caused by the significantly different effects of
 $Ca$
on these modes, as demonstrated by figure 6. Decreasing
 $Ca$
strongly stabilizes the M2-SW mode while it has only a weak influence on the M1-SW mode. In fact, as
 $Ca\rightarrow 0$
, the M1-SW mode becomes invariant to
 $Ca$
. Since large values of interfacial tension (small
 $Ca$
) prevent interface deformation, figure 6 suggests that interfacial deformation plays an important role in the M2-SW mode but not in the M1-SW mode.


To verify this hypothesis, an energy budget analysis of the critical modes is carried out for each value of
 $Ca$
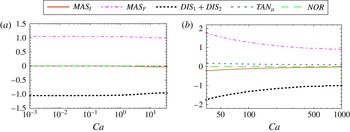
in figure 6. The results are depicted in figures 8(a) and 8(b) for the M1-SW and M2-SW critical modes respectively. The dissipation is primarily balanced by the
 $MAS_{F}$
term, which is characteristic of both short-wave modes (cf. § 8). The contribution from
 $NOR$
is also insignificant in both cases. The key difference between the two modes lies in the contributions of
 $MAS_{I}$
and
 $TAN_{{\it\mu}}$
, which are non-zero only when the interface deforms. In the case of the M1-SW mode, both terms are insignificantly small. On the other hand, their values are finite for the M2-SW mode, and grow larger as the transition point
 $Ca=35$
is approached. These results imply that interfacial deformation is significant in the M2-SW instability mode, but not in the M1-SW mode. Consequently, on increasing the interfacial tension, the M2-SW mode is stabilized as interface deformation is suppressed, whereas the M1-SW mode remains unstable.
This difference between the two modes is explained by the impact of the disturbance flow on the motion of the interface. Each instability mode introduces vertical fluid motion, which exerts a net viscous normal stress on the interface. This is given by
 $2(v_{1,y}-mv_{2,y})|_{y=0}$
to leading order. To check whether this stress supports or counteracts interface deformation, the phase difference (
 ${\rm\Delta}{\it\phi}$
) between the viscous normal stress and the velocity of the interface (
 $\widehat{{\it\eta}}_{t}$
) is computed for both modes. For the case wherein both modes are critical (depicted in figure 7), we find that the viscous normal stress is almost out of phase with the interface velocity in the case of the critical M1-SW mode (
 ${\rm\Delta}{\it\phi}=0.79{\rm\pi}$
), but nearly in phase in the case of the critical M2-SW mode (
 ${\rm\Delta}{\it\phi}=0.10{\rm\pi}$
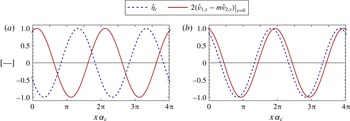
). The corresponding plots of normalized viscous stress and interface velocity are presented in figure 9. This result implies that the disturbance flow of the M1-SW mode counteracts interface deformation by exerting a downward stress on the interface at locations where it is rising. In contrast, the disturbance flow of the M2-SW mode supports interface deformation by exerting an upward stress at positions where the interface is rising. Therefore, the M1-SW mode is manifested without significant interface deformation, while the M2-SW mode is associated with a deforming interface.
Variation of the normalized viscous normal stress along the interface, plotted along with the normalized local velocity of the interface, at leading order. (a) Critical M1-SW mode; (b) critical M2-SW mode. Parameter values are the same as in figure 7, which corresponds to the codimension-two bifurcation between M1-SW and M2-SW modes.

As a final point in this section, we note that the codimension-two bifurcation between the short-wave modes is affected by other parameter values. As an example, the influence of
 $Pe$
(
 $d_{1}U_{0}/D_{1}$
) is demonstrated in figure 10. As
 $Pe$
is increased, the switching point shifts to larger values of
 $Ca$
. This implies that increasing the diffusivity of the solute (decreasing
 $Pe$
) increases the range of criticality of the M2-SW mode. This occurs because diffusion has a stronger stabilizing effect on the M1-SW mode due to its significantly higher wavenumber (figure 6
b). A large-wavenumber disturbance has rapid streamwise variations in concentration that are damped out more quickly by diffusion.
Effect of
 $Pe$
on mode switching between short-wave M1 and M2 modes. (a)
 $Pe=1000$
; (b)
 $Pe=2000$
; (c)
 $Pe=2500$
. Parameter values:
 $n=1$
,
 $m=1.5$
,
 $D_{r}=0.5$
,
 $K=0.5$
,
 $Pe=2000$
,
 ${\it\gamma}=0.5$
.

10 Transition from short to long waves
In § 8, it was shown that the M1 branch of eigenvalues gives rise to a long-wave instability when
 $n^{2}>m$
and a short-wave instability when
 $n^{2}<m$
. In this section we examine, via numerical calculations, the transition from short to long waves as
 $n$
is increased beyond
 $\sqrt{m}$
. We consider two examples, one for a viscosity ratio less than unity and the other for a value larger than unity.
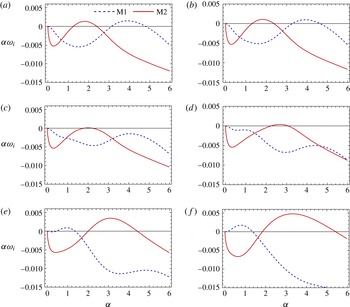
Figure 11 illustrates the transition for a case of
 $m=1.5$
. The critical value of the thickness ratio is
 $n=\sqrt{1.5}\approx 1.2247$
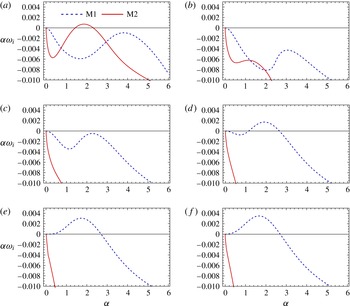
. Six values of
 $n$
from 1 to 1.24 are chosen to illustrate the transition. A sufficiently large capillary number (
 $Ca=100$
) is chosen so that the M2 mode is unstable at the smallest of the selected values of
 $n$
(figure 11
a). The value of
 $Ma$
is fixed at 11 732.65 for all cases.
Transition from a short-wave to a long-wave instability as
 $n$
is increased beyond
 $\sqrt{m}$
. Parameter values:
 $m=1.5$
,
 $Ca=100$
,
 $Ma=11\,732.65$
,
 $D_{r}=0.5$
,
 $K=0.5$
,
 $Pe=2000$
,
 ${\it\gamma}=0.5$
: (a)
 $n=1$
, (b)
 $n=1.10$
, (c)
 $n=1.15$
, (d)
 $n=1.19$
, (e)
 $n=\sqrt{1.5}\simeq 1.2247$
, (f)
 $n=1.24$
.

As
 $n$
increases, with
 $Ma$
constant, the M2-SW mode is strongly stabilized. The M1-SW mode is also stabilized initially (figure 11
b), but is destabilized again as
 $n$
is increased further (figure 11
c). Simultaneously, the local maximum growth rate shifts towards longer wavelengths. At
 $n=1.19$
(figure 11
d), the M1 branch becomes unstable again. This mode is also of the short-wave kind, but has significantly larger wavelengths than the M1-SW mode seen at
 $n=1$
(cf. figure 11
a). As
 $n$
is increased further, the range of unstable wavenumbers of the M1 branch moves closer to zero until it becomes a long-wave instability (figure 11
f). At the transition (
 $n=\sqrt{m}$
, figure 11
e), the M1 dispersion curve attains zero slope at the origin
 ${\it\alpha}=0$
, in accordance with the asymptotic expression (6.1).
In § 8 (table 1), it was shown that the mechanical energy budget of long-wave instabilities is dominated by
 $MAS_{I}$
, while that of the short waves is dominated by
 $MAS_{F}$
. Hence, the transition from short to long waves must be accompanied by a significant change in the energy budget. This is verified in table 2, which presents the mechanical energy–work terms for the local maximum of the M1 dispersion curve at
 $n=1$
, 1.19 and 1.24. While
 $MAS_{F}$
is the dominant positive term for the M1-SW mode (
 $n=1$
), it decreases as
 $n$
is increased and becomes negative in the case of long waves (
 $n=1.24$
). Instead,
 $MAS_{I}$
becomes the dominant positive term that balances dissipation.
Energy budget for M1 short- and long-wave modes corresponding to the local maxima of the M1 dispersion curves in figure 11(a,d,f). The mechanical energy terms have been normalized by the magnitude of the total viscous dissipation, such that
 $\sum _{j=1}^{2}DIS_{j}=-1$
. The terms
 $KE_{i}$
and
 $REY_{i}$
are identically zero in the creeping flow limit. The stability/instability of the modes can be inferred from the evolution of the concentration energy functional
 $\sum _{j=1}^{2}E_{j}^{c}$
. These terms have been normalized by the total amount of diffusive damping,
 $\sum _{j=1}^{2}DIF_{j}=-1$
. Parameter values are given in the caption to figure 11.

Interestingly, table 2 shows that the
 $MAS_{I}$
term is already larger than the
 $MAS_{F}$
term at
 $n=1.19$
, although the M1 dispersion curve still bears the qualitative characteristics of a short-wave mode. This mode, which has a relatively longer wavelength than the M1-SW mode at
 $n=1$
, may thus be considered as a distinct intermediate-wavelength instability mode. This intermediate mode occurs for a narrow band of
 $n$
values that separate the M1 short waves from the M1 long waves.
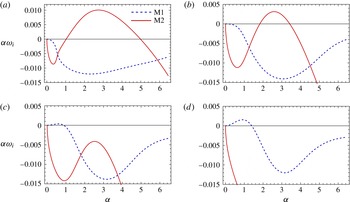
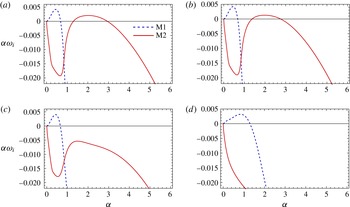
Transition from a short-wave to a long-wave instability as
 $n$
is increased beyond
 $\sqrt{m}$
. Parameter values:
 $m=0.5$
,
 $Ca=1000$
,
 $Ma=5000$
,
 $D_{r}=1$
,
 $K=1$
,
 $Pe=2000$
,
 ${\it\gamma}=0$
: (a)
 $n=0.65$
, (b)
 $n=0.70$
, (c)
 $n=0.725$
, (d)
 $n=0.75$
.

An example of the short–long-wave transition when
 $m<1$
is depicted in figure 12. Due to the large value of the capillary number
 $Ca=100$
, the M2-SW mode is strongly unstable at
 $n=0.65$
. Nevertheless, as
 $n$
is increased the M2-SW mode is stabilized. The M1 branch of eigenvalues, which has negative growth rates across all
 ${\it\alpha}$
for
 $n=0.65$
, develops a long-wave instability when
 $n$
exceeds
 $\sqrt{0.5}$
(
 $=0.707$
).
This section has demonstrated how the short-wave instability of the M1 branch transitions to a long-wave instability, as
 $n$
is increased beyond
 $\sqrt{m}$
. The M2-SW mode is generally stabilized as
 $n$
is increased, provided that
 $Ma$
is constant. If
 $Ma$
is also increased, however, then the M2-SW mode can remain unstable despite the stabilizing influence of increasing
 $n$
. In such a case, the system will be unstable to long and short waves simultaneously (as shown in figure 3
b).
11 Necessity of a base state transverse concentration gradient
In this section, we investigate whether the mere presence of soluble surfactant at the interface is sufficient to cause a Marangoni instability, or whether a finite transverse concentration gradient is also required. The base state concentration field has a finite gradient if the plates are maintained at non-equilibrium concentrations (
 ${\it\gamma}\neq 1/K$
). The long-wave analysis, in § 6, demonstrated that a finite concentration gradient is necessary for long-wave Marangoni modes to be unstable. Here, we check whether this remains a prerequisite for short-wave Marangoni instability modes as well.
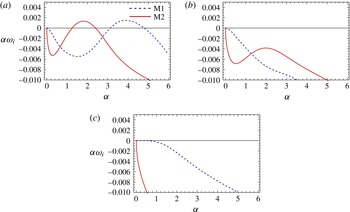
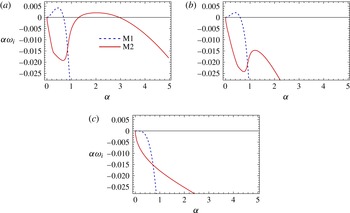
Figures 13 and 14 demonstrate the stabilizing effect of decreasing the base concentration gradient. Each figure considers three cases, corresponding to
 ${\it\gamma}=0$
,
 $0.5/K$
and
 $1/K$
(equilibrium). The parameter values in figure 13 are selected so that M1-SW and M2-SW modes are unstable in the presence of base state mass transfer (
 ${\it\gamma}=0$
). Figure 14 corresponds to the case of unstable M1-LW and M2-SW. In both figures, the system is seen to become stable when the plates are maintained at equilibrium concentrations (
 ${\it\gamma}=1/K$
).
Effect of the inter-fluid flux on the short-wave instability. Both M1 and M2 short waves are stabilized as the difference of the concentrations at the walls from equilibrium is decreased. Here,
 ${\it\gamma}=1/K$
corresponds to a base state without inter-fluid flux, as the fluids are in equilibrium in this case and have non-varying concentration profiles. Parameter values:
 $m=1.5$
,
 $n=1$
,
 $Ca=100$
,
 $Ma=10\,000$
,
 $D_{r}=0.5$
,
 $K=1.2$
,
 $Pe=2000$
: (a)
 ${\it\gamma}=0$
, (b)
 ${\it\gamma}=0.5/K$
, (c)
 ${\it\gamma}=1/K$
.

Effect of the inter-fluid flux on the long-wave instability. The long-wave M1 mode, as well as the M2 short-wave mode, is stabilized as the difference of the concentrations at the walls from equilibrium is decreased. Here,
 ${\it\gamma}=1/K$
corresponds to a base state without inter-fluid flux, as the fluids are in equilibrium in this case and have non-varying concentration profiles. Parameter values:
 $m=0.9$
,
 $n=1.3$
,
 $Ca=1$
,
 $Ma=10\,000$
,
 $D_{r}=0.5$
,
 $K=1.2$
,
 $Pe=1000$
: (a)
 ${\it\gamma}=0$
, (b)
 ${\it\gamma}=0.5/K$
, (c)
 ${\it\gamma}=1/K$
.

The necessity of a transverse base state concentration gradient for solutal Marangoni instability can be understood with the aid of the energy balance equations (cf. § 5). In the mechanical energy balance (5.1), the terms contributing to the Marangoni instability are
 $MAS_{F}$
and
 $MAS_{I}$
. When the base state concentration gradient is zero
 $(\text{d}\overline{c}_{j}/\text{d}y=0)$
, interface deformation does not generate concentration variations along the interface. Thus,
 $MAS_{I}$
is identically zero. The term
 $MAS_{F}$
accounts for concentration perturbations
 $\widehat{c_{i}}$
that are coupled to the disturbance flow within the fluids. In the absence of a base state concentration gradient, convection by the disturbance flow is negligible in comparison with the stabilizing effects of diffusion and viscous dissipation. This is reflected by the vanishing of
 $CONT_{j}$
– the term that represents the contribution of convective effects to the growth of the concentration energy functional (cf. (5.9)). Thus, both mechanisms for generating concentration variations along the interface are ruled out. This explains why a finite concentration gradient must exist across the phases for the solutal Marangoni instability to occur.
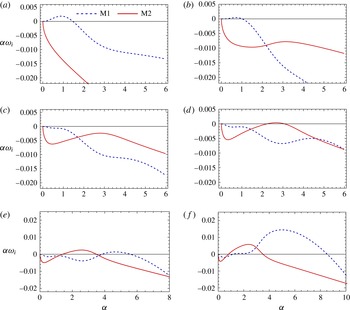
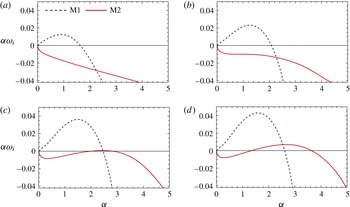
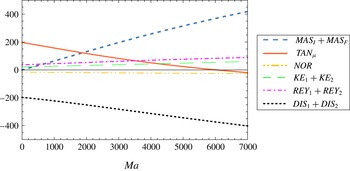
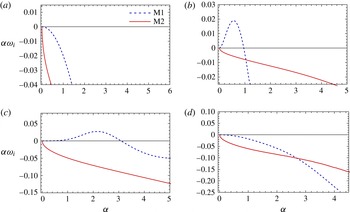
12 Influence of finite inertia
Thus far we have focused on the creeping flow regime, wherein we have identified three distinct instability modes – two short waves and one long wave. In this section, we briefly consider the case of small but finite
 $Re$
. A thorough analysis of the effects of inertia would merit a separate study. Here, we discuss only a few specific cases, which illustrate the interplay of the viscosity-induced mode and the solutal Marangoni modes.
We pursue two different lines of inquiry. First, we investigate the influence of inertia on the three Marangoni instability modes. Starting with an unstable creeping flow, the value of
 $Re$
is increased and its effect on the three modes is observed. Second, we investigate the effect of introducing soluble surfactant into a system that is already unstable to the viscosity-induced mode. These two cases are considered separately in the following subsections.
12.1 Effect of inertia on the solutal Marangoni instability
In this subsection, the effect of inertia on the three solutal Marangoni modes is investigated for two examples: one for
 $n^{2}<m$
and the other for
 $n^{2}>m$
.
The first case of
 $n^{2}<m$
is depicted in figure 15. Here, creeping flow is unstable to short-wave M1-SW and M2-SW modes (
 $n^{2}<m$
). In figure 15(a–f)
 $Re$
is increased sequentially from 0 to 40. The results for
 $Re=1$
(figure 15
b) are similar to the creeping flow case (figure 15
a). However, increasing
 $Re$
to 5 (figure 15
c) significantly stabilizes both modes. The effect of further increasing
 $Re$
differs for the two modes. The M2-SW mode becomes unstable again and its growth rate increases with
 $Re$
. On the other hand, the M1-SW mode undergoes a transition to long waves as
 $Re$
is increased beyond 10 (figure 15
d–f). This behaviour is in accordance with the long-wave asymptotic prediction (6.1) that inertia destabilizes long waves when
 $m>1$
and
 $n^{2}<m$
.
Effect of inertia on the solutal Marangoni instability when the M1 mode is short-wave. Parameter values:
 $Ma=10\,000$
,
 $m=1.5$
,
 $n=1$
,
 $Ca=100$
,
 $D_{r}=0.5$
,
 $K=1.2$
,
 ${\it\gamma}=0$
,
 $Pe=2000$
: (a)
 $Re=0$
, (b)
 $Re=1$
, (c)
 $Re=5$
, (d)
 $Re=10$
, (e)
 $Re=20$
, (f)
 $Re=40$
.

Mechanical energy budget (cf. (5.1)) calculations for the local maxima of the M1 and M2 dispersion curves, corresponding to figures 15(a) and 15(f), are presented in table 3. The dominant work term of the M1 mode changes from
 $MAS_{F}$
to
 $MAS_{I}$
in accordance with the transition from short waves to long waves. The energy budgets of the most unstable M2 mode for
 $Re=0$
and
 $Re=40$
are qualitatively the same (
 $MAS_{F}$
is the dominant positive term). This confirms that the M2 short-wave mode that is unstable at finite
 $Re$
is qualitatively the same as the M2-SW mode observed in creeping flow.


Figure 16 demonstrates the effect of inertia for a case of
 $n^{2}>m$
, wherein the long-wave M1 mode and the M2-SW mode are unstable in the creeping flow limit (figure 16
a). As
 $Re$
is increased, the M2-SW mode is completely stabilized. The long-wave M1 instability, on the other hand, remains unstable. In fact, the growth rate is greater at
 $Re=1$
than at creeping flow. This is in accordance with the prediction of the long-wave expansion (6.1) for the parameter values of figure 16 (
 $n^{2}>m$
and
 $m<1$
, cf. the figure caption). The effect of further increase in
 $Re$
cannot be predicted by the asymptotic expansion, since it was derived for the case of
 $Re$
being
 $O(1)$
. Figure 16(c,d) shows that long-wave M1 modes continue to remain unstable, as
 $Re$
is increased to 100, without significant change in their growth rates. Even at
 $Re=100$
, these long-wave modes are primarily driven by Marangoni stresses associated with interface deformation (
 $MAS_{I}$
), as shown by the energy budget calculations presented in table 4.
Effect of inertia on the solutal Marangoni instability when the M1 mode is long-wave. Parameter values:
 $Ma=10\,000$
,
 $m=0.9$
,
 $n=1.3$
,
 $Ca=1$
,
 $D_{r}=0.5$
,
 $K=1.2$
,
 ${\it\gamma}=0$
,
 $Pe=1000$
: (a)
 $Re=0$
, (b)
 $Re=1$
, (c)
 $Re=10$
, (d)
 $Re=100$
.



These two examples demonstrate that inertia affects the M1 and M2 Marangoni modes quite differently. Increasing
 $Re$
can qualitatively modify the M1 branch of eigenvalues and cause a transition between M1 short waves and M1 long waves. This strong influence over the M1 branch is due to the fact that the viscosity-induced mode is manifested through the M1 branch of eigenvalues. (When
 $Ma=0$
and
 $Re\neq 0$
, the unstable viscosity-induced mode emerges as long waves on the M1 branch, as shown in § 12.2.) On the other hand, increasing
 $Re$
does not modify the basic qualitative features of the M2-SW mode. The effect on its growth rate, however, can be non-monotonic, causing intermediate stabilization of the system over a narrow range of
 $Re$
, as demonstrated by figure 15(b–d).
12.2 Effect of soluble surfactant on the viscosity-induced instability at finite
 $Re$

In the absence of soluble surfactant effects (
 $Ma=0$
), a finite
 $Re$
flow is unstable to the viscosity-induced instability, provided that
 $m>1$
(
 $m<1$
) when
 $n^{2}<m$
(
 $n^{2}>m$
) (cf. § 6). In this section, we follow the changes in stability characteristics that occur on applying a transverse gradient of soluble surfactant. Two examples are studied in this section, corresponding to
 $n^{2}<m$
(with
 $m>1$
) and
 $n^{2}>m$
(with
 $m<1$
). Based on the preceding creeping flow analysis, the M1-SW Marangoni mode is expected to play a more significant role than the M1-LW mode in the first case, while the opposite is true of the second case (cf. § 8). The M2-SW mode could impact the flow ineither case.
Figure 17 corresponds to the case of
 $n^{2}<m$
. When
 $Ma=0$
(figure 17
a), the long-wave viscosity-induced mode is unstable. The identity of this mode is confirmed by energy budget calculations, presented in table 5, which show that the dominant work term is
 $TAN_{{\it\mu}}$
(cf. Boomkamp & Miesen Reference Boomkamp and Miesen1996). Since the viscosity-induced mode is manifested via the M1 branch of eigenvalues, the M1 Marangoni modes (M1-SW in this case) are expected to have a direct impact on it. Indeed, on increasing
 $Ma$
, the viscosity-induced mode is suppressed and undergoes a transition to the short-wave M1 Marangoni mode (figure 17
b–e). This transition is confirmed by the energy budget calculations presented in table 5. At
 $Ma=13\,000$
,
 $TAN_{{\it\mu}}$
is negligible in comparison with
 $MAS_{F}$
, which is the dominant positive term. This is characteristic of the energy budget of the short-wave solutal Marangoni mode (§ 9).
Along with the emergence of the M1-SW mode, the M2-SW mode also becomes unstable as
 $Ma$
is increased beyond 10 000 (figure 16
d–f). Therefore, as
 $Ma$
is increased, solutal Marangoni effects dominate and become the primary cause for instability of the flow.
Effect of soluble surfactant on the viscosity-induced interfacial instability. The chosen parameter values correspond to the case of
 $n^{2}<m$
, for which the short-wave M1-SW and M2-SW modes are unstable in the creeping flow limit. Parameter values:
 $Re=10$
,
 $m=1.5$
,
 $n=1$
,
 $Ca=100$
,
 $D_{r}=0.5$
,
 $K=1.2$
,
 ${\it\gamma}=0$
,
 $Pe=2000$
: (a)
 $Ma=0$
, (b)
 $Ma=3000$
, (c)
 $Ma=7000$
, (d)
 $Ma=10\,000$
, (e)
 $Ma=13\,000$
, (f)
 $Ma=20\,000$
.

Energy budget showing the transition from the viscosity-induced mode to the solutal Marangoni M1-SW mode. Calculations correspond to the fastest growing mode in figure 17(a,e). The values have been normalized by the magnitude of the total dissipation so that
 $(DIS_{1}+DIS_{2})=-1$
. Parameter values are given in the caption to figure 17.

An example in which
 $n^{2}>m$
is considered in figure 18. As in the previous case (figure 17), short waves from the M2 branch (M2-SW mode) become unstable on increasing
 $Ma$
. The growth rates of the long waves increase with
 $Ma$
, but the M1 dispersion curve does not change qualitatively. To investigate the nature of this long-wave instability, the variation of the energy budget with
 $Ma$
for
 ${\it\alpha}=1$
is plotted in figure 19. For small
 $Ma$
,
 $TAN_{{\it\mu}}$
is dominant, indicating that the instability is due to the viscosity-induced mode. As
 $Ma$
is increased,
 $TAN_{{\it\mu}}$
decreases while the Marangoni stress terms
 $MAS_{I}+MAS_{F}$
increase. The crossover point occurs around
 $Ma=2000$
. By
 $Ma=7000$
(figure 18
b),
 $TAN_{{\it\mu}}$
is negative and solutal Marangoni forces are the dominant cause of instability. The energy budgets of the fastest growing long-wave modes for
 $Ma=0$
and
 $Ma=20\,000$
(figures 18
a and 18
d respectively) are presented in table 6. While
 $TAN_{{\it\mu}}$
is the largest positive term for
 $Ma=0$
, the energy budget for
 $Ma=20\,000$
is dominated by the
 $MAS_{I}$
term, which is characteristic of the long-wave solutal Marangoni instability M1-LW (§ 8).
Effect of soluble surfactant on the viscosity-induced interfacial instability. The chosen parameter values correspond to the case of
 $n^{2}>m$
, for which the long-wave M1 and short-wave M2-SW instabilities are prevalent in the creeping flow limit. Parameter values:
 $Re=100$
,
 $m=0.5$
,
 $n=1.3$
,
 $Ca=1$
,
 $D_{r}=0.5$
,
 $K=1.2$
,
 ${\it\gamma}=0$
,
 $Pe=1000$
: (a)
 $Ma=0$
, (b)
 $Ma=7000$
, (c)
 $Ma=15\,000$
, (d)
 $Ma=20\,000$
.


Energy budget showing the transition from the viscosity-induced mode to the long-wave solutal Marangoni M1 mode. Calculations correspond to the fastest growing mode in figure 18(a,d). The values have been normalized by the magnitude of the total dissipation so that
 $(DIS_{1}+DIS_{2})=-1$
. Parameter values are given in the caption to figure 18.

In summary, introduction of a gradient of soluble surfactant into an unstable small-
 $Re$
flow causes a transition from the viscosity-induced mode to the solutal Marangoni instability (provided that
 $Ma$
is sufficiently large). When the M1-SW Marangoni mode is dominant (
 $n^{2}<m$
), this transition may cause the system to become stable in an intermediate range of
 $Ma$
(cf. figure 17). This is because the long-wave viscosity-induced mode is first suppressed before arising again as the short-wave M1-SW Marangoni mode. On the other hand, when the long-wave M1-LW Marangoni mode is dominant (
 $n^{2}>m$
), the flow becomes increasingly unstable to long-wave disturbances on increasing
 $Ma$
. The viscosity-induced mode eventually transitions to the Marangoni M1-LW mode.
13 Comparison with previous work
In this section, we compare our results with the closely related study by Wei (Reference Wei2006) on the thermocapillary instability of Couette flow. We also discuss the implications of neglecting concentration perturbations caused by interface deformation, as is done in You et al. (Reference You, Zhang and Zheng2014).
Wei (Reference Wei2006) studied the stability of two-phase layered Couette flow between flat plates which are maintained at different temperatures. The temperature variation across the fluids in the base state is analogous to the variation of solute concentration in the present solutal Marangoni problem. In fact, our entire analysis is valid for thermocapillary instabilities in Poiseuille flow, provided that we set
 $K=1$
(as the temperature is continuous at the interface) and restrict
 $Ma$
to positive values (since interfacial tension decreases with temperature). Moreover,
 $D_{r}$
must be identified with the ratio of thermal diffusivities.
Wei (Reference Wei2006) considered the problem in the ‘thin-layer limit’, in which one fluid layer is very thin in comparison with the other fluid layer. A long-wave instability mode was obtained, which is driven by thermocapillary stresses caused by deformation of the interface in the presence of a base state temperature gradient. This is the thermocapillary analogue of the M1-LW mode (§ 8). The mode was found to be unstable when the thin layer was heated. If we consider fluid 1 to be the thin fluid, then we have
 $n\gg 1$
and consequently
 $n^{2}>m$
for any finite viscosity ratio
 $m$
. Under these conditions our analysis predicts instability of the long-wave M1-LW mode (cf. (6.1)) if the concentration at plate 1 is greater than that at plate 2 (
 ${\it\gamma}<1$
), which is analogous to heating the thin fluid.
Wei (Reference Wei2006) also found that the growth rate for small wavenumber is linearly proportional to
 $D_{r}$
. Our long-wavelength asymptotic result (6.1) shows that the growth rate varies as
 $n^{2}D_{r}/(D_{r}+n)^{2}$
, which implies linear proportionality with
 $D_{r}$
in the thin-layer limit of large
 $n$
. (It should be noted that the wavenumber should be rescaled with the depth of fluid 2 before taking the limit of large
 $n$
in (6.1).) Furthermore, at small non-zero
 $Re$
, it was observed that the viscosity-induced mode reinforces the long-wave thermocapillary mode if the thin layer is more viscous (
 $m<1$
), and suppresses it if the thin layer is less viscous (
 $m>1$
). This interaction is entirely analogous to that predicted by (6.1) for the case of a heated thin layer (
 $n\gg 1$
and
 ${\it\gamma}<1$
). Thus, our results for the M1-LW mode are in qualitative agreement with those of Wei (Reference Wei2006). Further quantitative comparison is not possible since Wei (Reference Wei2006) studied Couette flow while we have analysed Poiseuille flow.
Neither of the short-wave instability modes (M1-SW, M2-SW) was identified by the asymptotic analysis of Wei (Reference Wei2006). Their absence in the thin-layer limit implies that, for a fixed finite value of
 $Ma$
, the short-wave modes are stabilized as one fluid layer is made much thinner that the other. Numerical calculations that demonstrate this behaviour are presented in figure 20. Each plot in this figure is a thin-layer variation of a case studied in a previous section of this paper, wherein one or both of the short-wave modes is/are unstable. For example, figure 20(a) is plotted for the same parameter values (including
 $Ma$
) as figure 5(a), except for the thickness ratio
 $n$
. For
 $n=1$
(figure 5
a), both M1-SW and M2-SW are unstable, but when the depth of fluid 2 is significantly decreased (
 $n=0.1$
, figure 20
a), both short-wave modes become stable. Comparison of figure 20(b) with figure 14(a) shows that the M2-SW mode is stabilized on decreasing the thickness of fluid 1. The long-wave mode M1-LW, on the other hand, becomes more unstable as
 $n$
is increased, in accordance with the long-wave asymptotic prediction (6.1). Figures 20(c) and 20(d) show that this behaviour persists when inertial effects are included (non-zero
 $Re$
). Consequently, the simplified equations of the thin-layer limit (Wei Reference Wei2006) predict only long-wave instability modes. An analysis of the governing equations for moderate thickness ratios will most likely uncover M1-SW and M2-SW modes in Couette flow as well.
Stabilization of short-wave modes (M1-SW and M2-SW) when one fluid layer is much thinner than the other. Each plot has the same parameter values as a previous figure in this paper, with the exception of the thickness ratio
 $n$
. Moderate values of
 $n$
are used in the previous figures, wherein one or both of the short-wave modes is/are unstable. In contrast, the new values of
 $n$
, namely (a) 0.1 (figure 5
a), (b) 5 (figure 14
a), (c) 0.15 (figure 15
f), (d) 0.1 (figure 17
f), correspond to cases in which either fluid 1 or fluid 2 has a relatively small depth. Making one of the fluid layers thin (while
 $Ma$
is fixed) clearly has a stabilizing effect on the short-wave modes (compare each plot with the relevant earlier figure).

Although Wei (Reference Wei2006) did not observe the M1-SW and M2-SW modes, he did find a range of
 $Ca$
in which the long-wave instability transitions to an intermediate-wavelength mode that has a range of unstable wavenumbers bounded away from zero (cf. figure 4 of Wei (Reference Wei2006)). This mode cannot be identified with the M1-SW mode because it was found to stabilize completely on decreasing
 $Ca$
, which is contrary to the behaviour of the M1-SW mode (cf. § 9). Moreover, since it transitions smoothly to the long-wave instability on increasing
 $Ca$
, it is not the M2-SW mode either. Instead, it is most likely to be the analogue of the intermediate-wavelength M1 mode shown in figure 11(d) of § 10, which arises as a distinct mode in the transition of M1-SW to M1-LW modes.
The physical problem studied by You et al. (Reference You, Zhang and Zheng2014) is identical to that of the present work. However, they do not account for the effect of interface deformation on the concentration variations at the interface. As a result, the Marangoni stresses due to interface deformation are absent (the second term multiplying
 $Ma$
in (2.7)). In this work, we have shown that these Marangoni stresses are the cause of the long-wave Marangoni instability. In terms of the energy budget, the
 $MAS_{I}$
term that is dominant in the budget of the M1-LW mode is absent. Consequently, the M1-LW mode will not appear in the model analysed by You et al. (Reference You, Zhang and Zheng2014).
You et al. (Reference You, Zhang and Zheng2014) do, however, report long-wave instabilities at very small
 $Re$
. These are unstable even when
 $n^{2}<m$
, in contradiction with our asymptotic result (6.1) for long-wave Marangoni modes. These modes do not correspond to the viscosity-induced mode either, because You et al. (Reference You, Zhang and Zheng2014) report that they are stabilized as
 $Re$
is increased beyond unity. Moreover, their calculations for the cases of
 $n=1$
and
 $m\neq 1$
show the flow to be stable when
 $Re>1$
. This is in contradiction with the established results of Yih (Reference Yih1967) and Yiantsios & Higgins (Reference Yiantsios and Higgins1988), which predict instability to the viscosity-induced mode at any non-zero value of
 $Re$
when
 $n=1$
and
 $m\neq 1$
. On the other hand, both our asymptotic and numerical results are consistent with the instability of the viscosity-induced mode at finite
 $Re$
(Yiantsios & Higgins Reference Yiantsios and Higgins1988).
You et al. (Reference You, Zhang and Zheng2014) also report one short-wave instability that occurs above a critical value of
 $Ma$
, at small
 $Re$
. Accounting for differences in the definition of dimensionless groups, we find that the neutral stability curves presented in You et al. (Reference You, Zhang and Zheng2014) correspond to large
 $Ca$
of
 $O(10^{3})$
and greater. Since the M2-SW mode dominates over the M1-SW mode at very large
 $Ca$
(cf. § 9), the short-wave mode reported by You et al. (Reference You, Zhang and Zheng2014) is probably the M2-SW mode.
In summary, Wei (Reference Wei2006) found the M1-LW mode in Couette flow, while You et al. (Reference You, Zhang and Zheng2014) found the M2-SW mode in Poiseuille flow. In this work, we have found an additional short-wave mode, M1-SW, which becomes unstable in the region where the long-wave M1-LW mode is stable. The dominant instability is shown to switch between these three modes as parameters are varied. The M1-SW instability is dominant at smaller values of
 $Ca$
(cf. § 9) and thus is expected to be important in microchannel flows.
14 Conclusions
This work has shown that the presence of a soluble surfactant can destabilize stratified flow via solutal Marangoni effects, provided that a transverse concentration gradient is maintained across the fluids. Three distinct Marangoni instability modes are present, which destabilize the system even in the limit of creeping flow. One of these is a long-wave mode (M1-LW), which is destabilized by concentration variations due to deformation of the interface in the presence of a base transverse concentration gradient. The other two modes are short-wave instabilities (M1-SW and M2-SW), which are amplified by the coupling between the disturbance flow and the interface concentration perturbations. One of the short-wave modes (M1-SW) remains unstable even in the limit of large interfacial tension (
 $Ca\rightarrow 0$
), wherein the interface is non-deforming. Thus, the base unidirectional flow may be unstable, leading to higher mass transfer rates, even in experiments that report a flat stationary interface.
When
 $Re$
is non-zero, the long-wave viscosity-induced instability comes into play and interacts with the Marangoni instability. In certain regions of parameter space (
 ${\it\gamma}<1/K$
,
 $n^{2}>m$
,
 $m>1$
), the viscosity-induced mode counteracts the long-wave Marangoni mode and has a stabilizing influence. In other cases (
 ${\it\gamma}<1/K$
,
 $n^{2}>m$
,
 $m<1$
), the viscosity-induced mode promotes the instability of long-wave disturbances.
A summary of the instabilities that destabilize the system under different conditions is presented in table 7. Surfactant laden creeping flow (
 $Re\ll 1$
) is unstable to three different Marangoni instability modes. The long-wave M1-LW mode is unstable when
 $n^{2}>m$
(table 7, (1)) whereas the short-wave M1-SW mode can be unstable when
 $n^{2}<m$
(table 7, (2)). The second short-wave mode, M2-SW, can be unstable at any value of
 $n$
((table 7, (1–2))). The short-wave modes are unstable only if the magnitude of
 $Ma$
is greater than a critical value, which is different for each mode and depends on the other parameters. The critical
 $Ma$
is significantly greater when one of the fluid layers is much thinner than the other.
A necessary condition for these Marangoni instabilities is the presence of inter-fluid mass transfer in the base state. Therefore, the Marangoni modes are suppressed when equilibrium concentrations are maintained at the bounding plates (
 ${\it\gamma}=1/K$
) (table 7, (3)). The flow stability in this case is the same as that in the absence of surfactant effects (
 $Ma=0$
). When
 $Re$
is increased to finite values, the flow becomes unstable to the viscosity-induced mode (Boomkamp & Miesen Reference Boomkamp and Miesen1996) (table 7, (4)). If soluble surfactant effects and inertia are present simultaneously, then both Marangoni and viscosity-induced modes are present (table 7, (5)). The outcome of mutual interaction between these effects depends on the viscosity and thickness ratio of the fluids. Inertia can stabilize or destabilize the flow, as well as change the nature of the dominant instability from short-wave to long-wave, as shown in § 12.
The term (
 $n^{2}-m$
) plays a key role in the stability characteristics of the M1-LW and M1-SW Marangoni modes (table 7). It is associated with the transverse gradient of the base state velocity field at the interface (
 $\text{d}\overline{u}_{i}/\text{d}y|_{y=0}$
). The gradient is positive if
 $n^{2}<m$
, negative if
 $n^{2}>m$
and zero if
 $n^{2}=m$
. This term is also prominent in the viscosity-induced mode (cf. § 6 and Yiantsios & Higgins (Reference Yiantsios and Higgins1988)) and in the instability caused by insoluble surfactants (Frenkel & Halpern Reference Frenkel and Halpern2002; Halpern & Frenkel Reference Halpern and Frenkel2003; Wei Reference Wei2005, Reference Wei2007). Elucidation of the physical mechanisms through which this term influences these different instabilities is an interesting avenue for further work.
Summary of the instabilities present in the system under different conditions. The three Marangoni modes are the long-wave and short-wave instabilities from the M1 eigenvalue branch (M1-LW and M1-SW respectively) and the short-wave instability from the M2 branch. The viscosity-induced mode is the long-wave instability first identified by Yih (Reference Yih1967). The Reynolds number
 $Re$
is restricted to small values in this classification. The Marangoni number
 $Ma$
is non-zero and
 ${\it\gamma}<1/K$
in all cases, unless explicitly stated otherwise. The latter inequality implies that mass transfer occurs from plate 1 to plate 2. Reversing the direction of mass transfer reverses the condition on the transition between long and short waves.

An important task for future work is the extension of the present two-dimensional stability analysis to the analysis of three-dimensional instability modes, i.e to include disturbances with variations in the direction perpendicular to the flow but parallel to the bounding plates. Wei (Reference Wei2006) has shown that such 3D modes are more unstable than 2D modes for the case of thermocapillary instability in stratified Couette flow. It is thus quite possible that the inclusion of 3D modes will lower the critical Marangoni number of the present Poiseuille stratified flow.
In an effort to understand the key effects of solutal Marangoni stresses on the flow stability, we have used a simplified model for mass transfer of the solute. In this model, adsorption and desorption of the solute to and from the interface are assumed to be instantaneous. This is an idealization. For a solute that adsorbs and desorbs at a finite rate, the distribution of solute at the interface will be affected by surface convection and diffusion in the Gibbs adsorption layer. These processes can have a subtle effect on the dynamics of the system. In the context of solutal Marangoni instability in stationary fluid layers, accumulation and transport at the interface can stabilize or destabilize the system, depending on parameter values. The temporal nature of the linear instability modes (oscillatory or stationary) can also be affected (Kovalchuk & Vollhardt Reference Kovalchuk and Vollhardt2006; Schwarzenberger et al. Reference Schwarzenberger, Köllner, Linde, Boeck, Odenbach and Eckert2014). In the nonlinear regime, surface transport of solute can lead to complex dynamical states, such as spontaneous oscillations (Tadmouri et al. Reference Tadmouri, Kovalchuk, Pimienta, Vollhardt and Micheau2010). It would therefore be interesting to extend the present model to account for these processes, and examine their influence on the stability of flowing fluid layers.
This study indicates that the solutal Marangoni instability can play an important role in applications involving low-
 $Re$
stratified flow, such as solvent extraction in microchannels (Assmann et al.
Reference Assmann, Ładosz and Rudolf von Rohr2013). It has revealed the importance of the direction of mass transfer between the fluids, which controls whether a long-wave instability or a short-wave instability is observed. This is of practical importance since long-wave modes become unstable at any non-zero
 $Ma$
while short-wave instability modes require
 $Ma$
to be greater than a critical value for instability. In order to accurately predict the instability threshold for these systems, however, the longitudinal variation of the base state concentration field must be accounted for. If this variation is gradual (large
 $Pe$
), then a weakly non-parallel stability analysis (Huerre & Monkewitz Reference Huerre and Monkewitz1990; Chomaz Reference Chomaz2005) can be carried out, in which the base state is treated as non-varying locally at each point along the flow direction. In the case where the longitudinal concentration variation is rapid (small
 $Pe$
), the disturbance cannot be decomposed into wave-like normal modes. Instead, global eigenmodes (Theofilis Reference Theofilis2003; Chomaz Reference Chomaz2005), with aperiodic variation along both the transverse and longitudinal directions, should be analysed.
Acknowledgements
J.R.P. would like to dedicate this paper to an inspiring teacher and close friend, Professor Satyajit (Sat) Ghosh (VIT University, India and Leeds University, UK). The authors thank Ranga Narayanan for stimulating discussions and suggestions. J.R.P. and T.G.R. are grateful to MHRD, Government of India, for financial support.
Appendix A
The expression for
 $G(n,m)$
used in the asymptotic solution (6.1) of § 6 is as follows:
 $$\begin{eqnarray}\displaystyle G(n,m) & = & \displaystyle m^{7}+6m^{7}n+32m^{5}n^{2}+344m^{5}n^{3}+(408m^{4}+821m^{5})n^{4}\nonumber\\ \displaystyle & & \displaystyle +\,(224m^{3}+1642m^{4}+1426m^{5})n^{5}+(1240m^{3}+3667m^{4}+1096m^{5})n^{6}\nonumber\\ \displaystyle & & \displaystyle +\,(224m^{2}+3424m^{3}+3424m^{4}+224m^{5})n^{7}\nonumber\\ \displaystyle & & \displaystyle +\,(1096m^{2}+3667m^{3}+1240m^{4})n^{8}+(1426m^{2}+1642m^{3}+224m^{4})n^{9}\nonumber\\ \displaystyle & & \displaystyle +\,(821m^{2}+408m^{3})n^{10}+344m^{2}n^{11}+32m^{2}n^{12}+6n^{13}+n^{14}\nonumber\\ \displaystyle & & \displaystyle -\,[2m^{6}n+9m^{6}n^{2}+120m^{6}n^{3}+88m^{6}n^{4}\nonumber\\ \displaystyle & & \displaystyle +\,88mn^{10}+120mn^{11}+9mn^{12}+2mn^{13} ].\end{eqnarray}$$