INTRODUCTION
In recent decades many species of large shallow-water holothurians (sea cucumbers) have been fished for the Asian food market world-wide with increasing intensity. Holothuria scabra Jaeger, 1833 (‘sandfish’) is one of the most valuable of these species (van Eys, Reference van Eys1986; Akamine, Reference Akamine2002 and citations therein). Holothurians have been over-exploited in many areas of the Indo-Pacific region (Hamel et al., Reference Hamel, Conand, Paeson and Mercier2001; Conand, Reference Conand, Lovatelli, Conand, Purcell, Uthicke, Hamel and Mercier2004; Uthicke, Reference Uthicke2004), including some well documented cases in Australia: H. whitmaei and H. scabra (Uthicke & Benzie, Reference Uthicke and Benzie2000; Skewes et al., Reference Skewes, Taylor, Dennis, Haywood and Donovan2006).
Holothuria scabra, a tropical aspidochirotid (deposit-feeding) species, is an important commercial species (Conand, Reference Conand2001) and probably the only tropical species that currently forms the basis of an aquaculture industry (Kelly, Reference Kelly and Matranga2005). As the natural stocks of those shallow-water animals decline through fishing pressure, investigating key interactions between holothurians and their habitat, and understanding the ecological role these animals play, gains all the more importance. Holothuria scabra takes a special position amongst the commercially harvested species because it is one of the rare species that move in and out of sub-surface sediments, exhibiting a regular burying cycle (Wolkenhauer, Reference Wolkenhauer2008). Thus, they possibly have a greater impact on sediment displacement and bioturbation than holothurians which are solely interacting with the sediment surface.
The main habitat for H. scabra both in tropical and subtropical regions are seagrass beds, since the larvae and juveniles rely heavily on seagrass for their settling cues and early life stages (Mercier et al., Reference Mercier, Battaglene and Hamel2000a). Possible positive effects of holothurians on seagrass and algae could be through direct release or recycling of nutrients as they feed on bacteria, microalgae and organic detritus attached to sediment grains (Moriarty et al., Reference Moriarty, Pollard, Hunt, Moriarty and Wassenberg1985; Wiedemeyer, Reference Wiedemeyer and Richmond1992); thus, increasing nutrient levels in the water column in close proximity (Uthicke, Reference Uthicke2001b; Grall & Chauvaud, Reference Grall and Chauvaud2002). A recent meta-analysis found that sediment nutrients are the key limiting factors to seagrass growth and biomass rather than light (Hughes et al., Reference Hughes, Bando, Rodriguez and Williams2004). Holothurians in carbonate sands in oligotrophic coral reef ecosystems have been found to increase productivity of benthic microalgae (BMA) through nutrient (especially ammonium) enhancement (Uthicke, Reference Uthicke2001a).
The burying behaviour of holothurians is hypothesized to also increase benthic primary producers (Wiedemeyer, Reference Wiedemeyer and Richmond1992; Mercier et al., Reference Mercier, Battaglene and Hamel1999); the movement potentially irrigating and aerating deeper sediment layers. This behaviour may release nutrients trapped in the interstitial waters, keep sediments oxygenated and/or displace BMA vertically as well as horizontally. However, there has been indication that burying holothurians also might have a negative impact on seagrass by accumulating sediment which may interfere in seagrass growth and dispersion (Mosher, Reference Mosher1980).
The main objective of this study was to determine the effects of the removal of H. scabra on seagrass growth and BMA biomass. We hypothesized that exclusion of holothurians from experimental treatments, thus reducing nutrient excretion and bioturbation, would have a negative effect on the growth and/or biomass of benthic primary producers.
MATERIALS AND METHODS
Study site
Moreton Bay is a semi-enclosed embayment in south-east Queensland, Australia. Water exchange occurs primarily through its northern and eastern margins. It is adjacent to a major city (Brisbane, population ~1.95 million) and bounded to the east by two main islands, Moreton Island and Stradbroke Island.
Field experiments were conducted at Myora Gutter (27°27.876′S 153°25.146E) (Datum: GDA), a small bay adjacent to the western side of North Stradbroke Island. This area is mostly sheltered but occasionally subjected to strong tidal currents. Tidal sea levels in the bay vary by 1–2 m. The study site was located in about 3–4 m depth below mean low water level, approximately 300 m from the island's shore line.
Most of Myora Gutter has 80–90% seagrass coverage, which is dominated by the seagrass species Cymodocea serrulata (R. Brown) Ascherson & Magnus, 1871. The cage experiments were conducted in a monospecific C. serrulata seagrass bed and all seagrass results presented are based on measurements of this species.
Experimental design
The experiment was based on 2 by 2 m square exclusion cages that were placed in shallow seagrass beds in 3–4 m below mean low water level. Each cage was constructed from wire mesh (13 mm gap) 30 cm high, fixed to rigid mesh (25 mm gap) that extended 10 cm down into the sediment. The cages were held together by four wooden poles at each corner and were open at the top. A pilot study showed that other animals such as fish, crustaceans and other macro-invertebrates were not excluded through these cages and that there was no sedimentation along the fences caused by possible hydrodynamic changes in water flow.
Three different treatments were used in the experiment: exclusion cages (EX) where Holothuria scabra were excluded from the caged area; cage controls (CC) with wire mesh only (no rigid mesh extending into sediment) allowing H. scabra to move freely underneath the fencing and therefore occupy the cage at approximately natural densities (0.48 ind. m−2); and natural controls (NC) with no fencing (four poles only) and therefore with H. scabra at natural densities.
Twelve cages were erected parallel to the shoreline in two rows of six. Each row had two blocks of three cages, with the location of each treatment randomly located. Based on preliminary experiments, each cage was placed 5 m apart to minimize hydrodynamic disturbances. A random number decided where each treatment was placed.
Two field experiments were carried out; the first in austral spring (September to November 2003), thereafter referred to as 2003, and the second in austral autumn (February to April 2004), referred to as 2004. The cage area, including a 100-m buffer zone around it, was not disturbed by fishermen for the entire two years. Sediment and seagrass samples were collected by means of SCUBA diving and several response variables were measured to examine the effect H. scabra may have had on the habitat: seagrass productivity and biomass, benthic microalgae (BMA) biomass and general organic matter (OM) in the sediment.
HOLOTHURIAN DENSITY
Animals were not disturbed (except in EX) and kept at their natural density of around 0.48 ind. m−2 (Wolkenhauer, unpublished data). Animals inside the natural (NC) and cage-control (CC) areas were counted every week to ensure that CC had on average close to natural densities and exclusion cages (EX) had no H. scabra. Holothurian densities in both controls (NC and CC) were similar to naturally occurring densities in this area of Moreton Bay (Skewes et al., Reference Skewes, Dennis, Wassenberg, Austin, Moeseneder, Koutsoukos, Haywood, Pendrey and Bustamante2002). Observer interference took place only in EX where animals that had rarely intruded into cages were manually removed and placed in the vicinity of the site, no further than 20 m away from where they were found. Adult H. scabra bury in the sediment during late hours of the night until the morning, depending on water temperature (Wolkenhauer, Reference Wolkenhauer2008). Monitoring of the cages and counting of the animals coincided with the highest probability of every animal being on the surface feeding (10:00–16:00) to ensure no buried animal was overlooked.
SEAGRASS PRODUCTIVITY
Seagrass productivity was measured by determining the growth in leaves following the ‘hole-punch method’ (Zieman, Reference Zieman1974) during the last week of each experiment. In this approach a small area (20 × 20 cm) was selected at random and about 40 shoots were marked in each cage. Six days later all the shoots within the marked area were harvested by clipping whole shoots directly off the rhizome. Leaves were then separated into ‘standing crop’ and ‘new growth’. Length and width measurements were taken for both leaf sections. Shoots were collected in aluminium trays and dried at 60°C for 24 hours in a drying oven. Dry weight of shoots was pooled for each leaf section (new growth and standing crop) and sample (cage).
SEAGRASS BIOMASS
Seagrass biomass in cages was sampled at the start and conclusion of both experiments. On each occasion one seagrass biomass sample (randomly placed) was taken from each cage with a 10 cm diameter corer. Samples were sieved through a mesh bag to extract the sediment, and plant material was kept refrigerated in a moist linen bag for less than two weeks before being processed. Shoots were counted and all green (living) leaves were measured (length and width) to the nearest mm. Since C. serrulata has relatively thick leaves, short term storage (less than a month) did not affect their colour. Dry weight for each sample was determined for leaves and shoots (above-ground biomass) and roots and rhizomes (below-ground biomass) after removing any epiphytic growth by means of scraping and then drying the seagrass material at 60°C for 24 hours.
BENTHIC MICROALGAE BIOMASS AND GENERAL ORGANIC MATTER
Sediment samples were collected using 60 ml cut-off syringes (cores) with rubber stoppers. On each sampling occasion 12 cores were taken from each cage to about 60 mm depth, six for BMA and six for OM analyses. The top 30 mm of sediment from each core was transferred to a plastic bag. All samples were kept in the dark and on ice during the field trip until transferred to the freezer and stored at –30° until processed.
Sediment samples for BMA analysis were thawed in water bath (20°C) in the dark. Any large particles such as seagrass leaves, roots or stones were removed and sediment thoroughly mixed. Two sub-samples (2 cm3, approximately 3.7 g wet weight) were removed from the homogenized sample and transferred into 15 ml of 100% acetone. A third sub-sample was placed in pre-weighed aluminium tin and dried at 60°C for 24 hours for moisture content analysis.
Extraction of chlorophyll-a (chl a) from BMA cells was achieved my means of sonification. Based on results from the pilot study, samples were sonified for two minutes directly after acetone was added and then left to extract for one hour in the dark on ice. After extraction, liquid samples were transferred into a 60 ml syringe and manually filtered through glass micro-fibre paper (GF/75 or grade 453). The extract was then used for spectrophotometric analyses (Parsons et al., Reference Parsons, Maita and Lalli1984) at four wavelengths (630, 647, 665 and 750 nm). To determine the content of degradation products (phaeopigments) of the sample, 30 µl of 0.2 M hydrochloric acid (HCl) was added to the sample and a second reading recorded after 10 seconds. Chl a and phaeopigments were then calculated as in Parsons et al. (Reference Parsons, Maita and Lalli1984).
Sediment samples for OM analysis were thawed and homogenized as described above. Two sub-samples (approximately 5 cm3) were transferred into pre-weighed crucibles. Samples were dried at 60°C for 24 hours and then weighed to record their dry weight (DW). Subsequently, crucibles were transferred to a muffle furnace for two hours at 550°C to determine the ash weight (AW). Finally, ash free dry weight (AFDW = DW–AW) was used to calculate OM content.
Statistical analyses
For each response variable, a general linear model (LM) was fitted (in SYSTAT 9) to two explanatory factors: cage treatment (NC, CC and EX) and block (a four-level factor). For those response variables measured at both the start and end of the experiment, we analysed the change in response for each cage. This simplifies the model, removing the need to model auto-correlation, while retaining information on the important experimental factors (treatment and block). Analysis of variance (ANOVA) was used to test the null hypothesis that the response variable is unaffected by presence or absence of H. scabra. The response variable was always continuous and either expressed as weight or length. Initial data exploration showed data were more or less normally distributed and the variances were homogeneous.
During 2003, one cage (EX II) was destroyed by a vessel impact, thus resulting in an unbalanced design and lower precision for this treatment compared to the controls (NC and CC).
Variation amongst treatments was partitioned into two orthogonal contrasts: (1) comparing the average of the controls (NC and CC) with that of the exclusion treatment (EX); and (2) comparing the two controls. A large F-ratio for contrast 1 and a small F-ratio for contrast 2 would be strong evidence that excluding H. scabra had an impact and that there was no other physical effect of the cage structure.
HOLOTHURIAN DENSITY
Holothurian counts obtained on multiple occasions were modelled using a generalized linear model (GLM) with Poisson distribution and log link (in R) to demonstrate that exclusion of animals in EX was effective. An analysis of deviance using a Chi-square test was used to assess the explanatory importance of terms in the model.
SEAGRASS PRODUCTIVITY
Seagrass productivity samples (either in mm leaf length day−1 or mg leaf DW shoot−1 day−1) were separated in ‘standing crop’ and ‘new growth’ and then averaged for each cage. Analysis was conducted on those averages (one figure per cage).
SEAGRASS AND BMA BIOMASS AND OM
Values from sub-samples in each cage were averaged on each occasion before being differenced over time, allowing a general linear model with a single error term to be fitted.
MULTIVARIATE ANALYSES
A principal component analysis (PCA) was carried out to further investigate if holothurians have a significant effect on multiple aspects of seagrass systems. Six response variables were included in this analysis: above and below-ground seagrass biomass change, seagrass productivity (based on leaf length and weight), change in BMA and OM. PCA was conducted on centred and variance-standardized data using S-PLUS, and a biplot of the first two scores and their loadings on the six response variables was plotted. In addition, multivariate analysis of variance (MANOVA) was used to assess the impact of the exclusion treatment on the combined suite of response variables, using the contrast previously defined. Being two-group comparison, all multivariate tests yielded the same statistical significance (Wilks' lambda, Pillai's trace, Hotelling–Lawley trace and Roy's greatest root).
RESULTS
Holothurian density
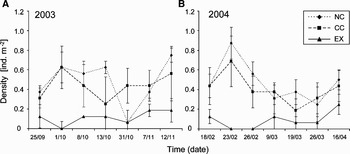
Animals in natural controls (NC) and cage controls (CC) had similar average densities approximately 0.48 m−2 (Figure 1). Only on one occasion (Figure 1A: 31 October 2003) were densities below 0.25 m−2. Densities as high as 1.25 m−2 were recorded in CC on several occasions. For both experiments the average density inside exclusion cages (EX, 2003: 0.12 m−2 ± 0.04 SE; 2004: 0.09 m−2±0.03 SE) was significantly (generalized linear model, P < 0.00001) lower than in the cage controls (CC, 2003: 0.44 m−2±0.08 SE; 2004: 0.47 m−2±0.06 SE) and in the natural controls (NC, 2003: 0.48 m−2±0.06 SE, 2004: 0.40 m−2±0.06 SE). Mild over-dispersion occurred during 2003 (65.1 on 55 df), probably due to low numbers for CC on 31 October 2003 (see above). During 2004, however, the model showed a good fit (49.4 on 51 df). As densities in the exclusion cages (EX) were, on average, less than a quarter of the densities in NC and CC, it provided an opportunity to assess the impact of deposit-feeding holothurians on primary producers such as seagrass and microalgae.
Holothurian density in experimental cages over the duration of (A) the 2003 and (B) the 2004 experiment (mean±SE, N = 4). NC, natural control; CC, cage control; EX, exclusion. Note: x-axis shows compressed time scale.

Seagrass productivity
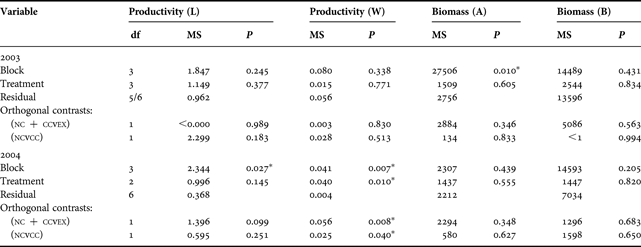
Seagrass productivity expressed as growth of new leaf weight in mg DW shoot−1 day−1 (W) was almost identical among treatments during 2003 (Figure 2A). However, during 2004, there were marked differences among treatments (Table 1). NC and CC had significantly (P = 0.008) higher productivity than EX, which was in general 12% lower than the combined controls, suggesting a holothurian exclusion effect (orthogonal contrasts; Table 1).
Average seagrass productivity for the first (2003) and second (2004) experiment (A) in terms of leaf weight and (B) in terms of leaf length (mean±SE, N = 4). NC, natural control; CC, cage control; EX, exclusion; **, P < 0.01 (EX versus NC+CC). Note scales on y-axes do not start at 0.

Linear contrast for seagrass productivity (L, leaf length in mm shoot−1 day−1; W, leaf weight in mg DW shoot−1 day−1) and biomass (g DW m−2) for the first (2003) and the second (2004) experiment.

df, degrees of freedom; MS, mean squares; NC, natural control; CC, cage control; EX, exclusion; DW, dry weight; A, above-ground; B, below-ground.
Seagrass productivity, expressed as growth of new leaf length in mm shoot−1 day−1 (L), was similar amongst the three treatments in 2003 (9.34±1.10 SE) (Figure 2B). However, in 2004 EX had the highest average growth of new leaf length (Figure 2B), and the difference between exclusion treatment and combined controls (NC and CC) was larger (P = 0.099) than between the two controls (P = 0.251) (Table 1).
Seagrass biomass
Above-ground seagrass biomass was initially similar amongst the three treatments during both experiments and averaged 165 g DW m−2±27 SE in 2003 and 104 g DW m−2±10 SE in 2004. However, in both experiments average biomass decreased in all three treatments over the 2-month study period—by 32% in 2003 and 19% in 2004.
Below-ground seagrass showed a similar pattern with an initial average biomass of 240 g DW m−2±28 SE in 2003 and 273 g DW m−2±27 SE in 2004. It also decreased during both experiments in all three treatments over the 2-month study period—by 20% in 2003 and 17% in 2004.
EX had a greater decrease in seagrass biomass compared to NC and CC within both experiments (Figure 3). In 2003, above-ground biomass decreased by 18% more in EX than controls (Figure 3A). Below-ground biomass showed a similar trend where reduction was 19% more in EX compared to the controls (Figure 3B). In 2004, above-ground biomass decreased by 21% more in EX, and below-ground biomass showed still a 7% greater reduction in the EX than in the controls.
Average change in seagrass biomass during both experiments for (A) above and (B) below-ground biomass (mean±SE, N = 4). NC, natural control; CC, cage control; EX, exclusion; LSM, least squares means; DW, dry weight.

Benthic microalgae (BMA) and organic matter (OM)
During the 2003 experiment, BMA biomass (average = 15.31±0.42 SE μg chl a g sediment−1) increased in CC and EX whereas NC showed an overall decrease in biomass (Figure 4A; Table 2). During 2004, BMA biomass (average = 12.67±0.43 SE μg chl a g sediment−1) increased in all three treatments, where EX showed a larger increase which was marginally statistically significant (P = 0.089) (Figure 4A; Table 2).
Average change in (A) benthic microalgae biomass (expressed as μg chlorophyll-a g DW−1) and (B) organic matter (expressed as % of sediment) during both experiments (mean±SE, N = 4). NC, natural control; CC, cage control; EX, exclusion; LSM, least squares means; DW, dry weight; *, P < 0.05 (EX versus NC+CC).

Linear contrast for organic matter (OM, % g sediment−1) and benthic microalgae biomass change (BMA, in μg chl a g sediment−1) for the first (2003) and the second experiment (2004).

df, degrees of freedom; MS, mean squares; NC, natural control; CC, cage control; EX, exclusion.
Average OM in the sediment was 1.25%±0.05 SE in 2003 and 1.37%±0.03 SE in 2004. The 2003 experiment revealed a decrease of OM for NC which was significantly different (P = 0.034) to the increase in the two cages (CC, EX) (Figure 4B, Table 2). During 2004, organic matter increased in all treatments (Figure 4B; Table 2). Both response variables indicate that there may have been a cage effect during 2003.
Multivariate analysis
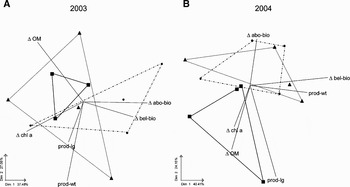
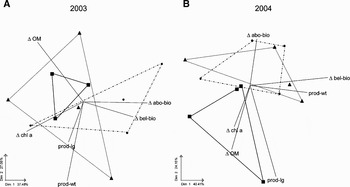
The biplot for 2003 showed no apparent differences between EX and the controls (Figure 5A). However, the biplot for the 2004 experiment clearly separated EX from the controls (Figure 5B). The main contributors to this separation were the difference in BMA biomass and OM (which increased more in EX) together with above-ground biomass. On a six-variable basis, EX did not differ significantly from both controls in 2004. But when we focused on the four variables with loadings along the major axis of separation between the groups in the biplot (BMA biomass, OM, and shoot productivity—length and change in above-ground biomass), the difference was statistically significant (P = 0.029).
Principal component analysis (PCA) biplot illustrating differences between exclusion cages (EX) and controls (NC and CC) during (A) 2003 and (B) 2004. Data were z-transformed before analysis and individual cages from the same treatment were surrounded by polygons; Δabo-bio and Δbel-bio, above and below-ground biomass change; prod-wt and prod-lg, seagrass productivity based on leaf weight and length; Δchl a, benthic microalgae biomass change; ΔOM, change in organic matter; NC. broken line; CC, dotted line; EX, solid line.
DISCUSSION
Seagrass productivity
Seagrass growth in shoot length and shoot weight in 2004 was affected by holothurian exclusion (EX) in opposite ways. Despite new growth in EX being longer than in controls, it weighed less. This may indicate that low densities of Holothuria scabra could cause some form of stress within the seagrass by possibly producing thinner leaves with bigger internal gas spaces (Enriquez, Reference Enriquez2005). The stress may have been caused by limited nutrient availability or increased shading through increased organic litter. Thus, either nutrient or light limitation or a combination of both could have caused possible physiological alterations within the leaves.
Our range of productivity values corresponds closely to maximum growth rates for Cymodocea serrulata in other studies: 1.38 g DW m−2 in northern Queensland (Pollard & Greenway, Reference Pollard and Greenway1993), 11.4 mm shoot−1 day−1 and 1.48 g DW m−2 in Malaysia (Kamal et al., Reference Kamal, Misri, Japar, Hishamuddin and Hidir1999) and 7.2 mm shoot−1 day−1 and 2.4 g DW m−2 in Mozambique (de Boer, Reference de Boer2000).
The fact that in the present study seagrass productivity was significantly reduced (at least in one year) by the absence of holothurians, could suggest that there may be a positive link between seagrass health and the presence of holothurians.
Seagrass biomass
Based on results from the seagrass biomass analysis, interpretation can only be done cautiously due to high variability in the data set. The data range of biomass estimates in this study corresponded well with other studies: 115–235 g DW m−2 (Boon, Reference Boon1986) and 63–79 g DW m−2 (Udy & Dennison, Reference Udy and Dennison1997) in Moreton Bay, 88.8–186.7 g DW m−2 (Birch & Birch, Reference Birch and Birch1984) and 80–100 g DW m−2 (Lanyon & Marsh, Reference Lanyon and Marsh1995) in Northern Queensland. However, variation amongst cages in the current study was high and statistical power low; therefore we refrain from making any assumption about holothurian effects on standing seagrass biomass.
Other studies have found an increase in biomass of tropical seagrass species (including Cymodocea serrulata) directly related to the abundance of other benthic macrofauna (e.g. polychaetes, amphipods and decapods) (Klumpp & Kwak, Reference Klumpp and Kwak2005 and citations therein). Results reported here thus support the theory, that seagrass systems may be top-down controlled by an animal–plant interaction (Heck & Valentine, Reference Heck and Valentine2007), giving additional complexity to an already established response of net standing crop of seagrass system being linked to light and nutrient availability.
Sandfish, seagrass and nutrients
One possible reason why H. scabra may cause an increase in seagrass productivity could be through indirect physical effects on sediments. Bottom-dwelling holothurians bioturbate their habitat by ingesting large amount of sand (Uthicke, Reference Uthicke1999; Purcell, Reference Purcell2004) and by burying in the substrate (Mercier et al., Reference Mercier, Battaglene and Hamel2000b). This can cause organic matter and detritus to become resuspended (de Jonge & van den Bergs, Reference de Jonge and van den Bergs1987) and may release additional nutrients that can be used by seagrasses and benthic microalgae.
Another possible reason for increased seagrass productivity could be the direct excretion of nutrients (ammonium) by the animals. A study of the tropical coral reef holothurian H. atra measured high ammonium excretion rates, suggesting holothurians may have considerable input into the nutrient budget of that system (Uthicke, Reference Uthicke2001b).
Further studies need to focus on nutrient excretion of H. scabra in subtropical seagrass habitat as well as determining ammonium uptake of C. serrulata and sampling sediment surface water directly amongst the seagrass to accurately calculate what percentage H. scabra may contribute. In addition, more powerful exclusion studies are needed to rigorously test possible significant differences in seagrass responses when excluding holothurians from a certain habitat.
Benthic microalgae (BMA) and nutrients
Our findings show that BMA biomass increased inside exclusion cages, which may have been caused by the lack of holothurians consuming algae, bacteria and detritus. However, a possible effect by the cage structure cannot be eliminated at least for one year. To avoid cage effects and in any future field exclusion experiments, cages need to be larger (>16 m2) and situated further apart (>10 m).
An increase in BMA in the absence of holothurians has been shown also in temperate waters, where BMA biomass increased significantly from 6–60 µg chlorophyll a g sediment−1 when deposit feeding holothurians (Stichopus japonicus) were absent (Kitano et al., Reference Kitano, Kurata, Kozuki, Murakami, Yamasaki, Yoshida and Sasayama2003). Furthermore, overall algal and bacterial production in subtropical habitats was reduced under holothurian grazing, and animals (here H. atra) are believed to consume 10–40% of bacterial carbon produced in summer (Moriarty et al., Reference Moriarty, Pollard, Hunt, Moriarty and Wassenberg1985).
In contrast, experiments on carbonated coral reef sediments under highly oligotrophic tropical conditions have shown a direct positive link between nutrients (ammonium) excreted by holothurians and BMA biomass and productivity (Uthicke & Klumpp, Reference Uthicke and Klumpp1998; Uthicke, Reference Uthicke2001a). Thus, holothurians may have a larger impact on BMA on coral reefs due to the nutrient limiting conditions. This indicates that the conclusion reached in this study should not be applied to offshore oligotrophic conditions.
Seasonality
The fact that the experiments were deployed at two different times of the year (austral spring and autumn) could have influenced the effect size of the results. A study on seagrass Cymodocea nodosa in the Mediterranean has found that seasonal changes in seagrass responses to environmental factors such as temperature and light are very species-specific (Marbà et al., Reference Marbà, Cebrián, Enríquez and Duarte1996). Storage of carbon hydrates as starch in rhizomes is either used when conditions are less favourable or accumulated under good conditions. Thus, seasonal variation in seagrass growth is greater in below-ground biomass compared to leaves. These authors conclude that large species should, therefore, be able to grow more independently of environmental conditions than small ones. However, no clear seasonality was observed in the chemical composition (protein, fats and total phosphorus) of C. nodosa (Zavodnik et al., Reference Zavodnik, Travizi and De Rosa1998). A study on three tropical seagrass species showed that seagrass standing crop was positively correlated with day-length, temperature and rainfall events, however the best model explained only 48% of the variation (Lanyon & Marsh, Reference Lanyon and Marsh1995).
Nevertheless, conducting the present study at different seasons has highlighted that seagrass responses can be very different depending on general environmental background conditions, which we regard as an important finding for subtropical seagrass species. Thus, future studies repeating sampling within ‘seasons’ would be required to test the hypothesis that there is a consistent difference in tropical seagrass response caused by seasons.
Conclusion
As H. scabra is found in similar habitat (coastal, high nutrients and muddy sediment) throughout its range (Hamel et al., Reference Hamel, Conand, Paeson and Mercier2001), it is likely that the results found in this study are applicable across its range. An indication of possible similarities across latitude is demonstrated also by the co-existence of sandfish with the same seagrass species such as C. serrulata (Hamel et al., Reference Hamel, Conand, Paeson and Mercier2001).
Holothurians have been overlooked previously in most conceptual models of animal–plant interactions in seagrass habitats. Complex multispecies interactions, such as present in seagrass beds, result in ecosystem resilience (sensu Lundberg & Moberg, Reference Lundberg and Moberg2003). They can be seen as a buffer to most external influences (e.g. fishing) and may help stabilizing systems subject to moderate habitat changes (Nakaoka, Reference Nakaoka2005). Those potential broader ecological consequences when over-fishing marine species are of increasing importance to management under policy that requires sustainable fishing practices (Coleman & Williams, Reference Coleman and Williams2002).
The present study has illustrated a potential mechanism by which fisheries for deposit feeding holothurians could have indirect cascading ecological consequences. Furthermore, given that seagrass habitat is a known nursery for other important fishery species (e.g. prawns) (Haywood et al., Reference Haywood, Vance and Loneragan1995), there is the potential for an impact in one fishery to be linked to another and the effects of over-fishing can be extrapolated on an ecosystem as a whole (Tegner & Dayton, Reference Tegner and Dayton1999). Removal of holothurians might alter the habitat structure and could thus have consequences for the ecology of tropical seagrass beds in the long term.
ACKNOWLEDGEMENTS
We are very grateful for the assistance of numerous volunteers (in particular A. Anas, D. Chetwynd, S. Corrie, D. Dennis, M. Haywood, R. Kenyon, F. Manson, I. McLeod and R. Soares) during field sampling. Special thanks go to P. Kiehl for her devoted help in measuring the endless supply of seagrass leaves. We would also like to thank J. Udy (University of Queensland) and two CSIRO internal referees for their valuable comments on the early analysis and manuscript. This research was funded partially by CSIRO Marine & Atmospheric Research in Australia and the Daimler-Benz-Foundation in Germany.