Introduction
The expanding global population in combination with limited arable land has required yield increases per hectare of farmland, and this has come about through intensive chemical fertilization (Tilman et al., Reference Tilman, Balzer, Hill and Befort2011). However, the long-term excessive use of chemical fertilizer has resulted in nitrogen loss through leaching and ammonia volatilization (Jia et al., Reference Jia, Shao, Liu, Zhao, Gu, Dong, Bing, Zhang and Zhao2014). Nitrogen leaching from field crops can pollute groundwater, which further threatens the safety of drinking water (Ju et al., Reference Ju, Kou, Zhang and Christiel2006). It has been widely reported that manure application may decrease nitrogen leaching compared with solo chemical fertilizer application (Fan et al., Reference Fan, Xiao, Liu, Ye, Luo, Houlbrooke, Laurenson, Yan, Chen, Tian and Ding2017; Zhou et al., Reference Zhou, Zhu, Brüggemann, Bergmann, Wang and Butterbach-Bahl2014). However, repeated manure applications can increase nitrogen leaching, which may be due to the increased nitrogen mineralization of organic nitrogen (Shepherd and Newell-Price, Reference Shepherd and Newell-Price2013).
High-yielding crops are heavily dependent on soil nitrogen supplies, especially from synthetic fertilizers. Indeed, levels of nitrogen in the soil due to anthropogenic inputs are now far greater than those obtained from natural sources (~180 Tg N year−1 versus 63 Tg N year−1) (Fowler et al., Reference Fowler, Coyle, Skiba, Sutton, Cape, Reis, Sheppard, Jenkins, Grizzetti, Galloway, Vitousek, Leach, Bouwman, Butterbach–Bahl, Dentener, Stevenson, Amann and Voss2013). While the chemical fertilization of crops has led to low SOC and nitrogen levels compared to organic fertilizer input (Dong et al., Reference Dong, Zhang, Wang, Dai, Sun, Qiu and Yang2012), the levels of plant-available nitrogen from organic fertilizers are also inadequate, resulting from a slow rate of mineralization and leading to lower crop yields in fields treated with organic versus chemical fertilizers (Blatt et al., Reference Blatt1991). The use of organic fertilizers only reaches 82% of the yield of chemical fertilizers, which varies heavily across crop species (Thorup–Kristensen et al., Reference Thorup–Kristensen, Dresbøll and Kristensen2012).
Given these shortcomings of chemical and organic fertilizers, recent studies have focused on the combined use of organic and inorganic fertilizers (Chen et al., Reference Chen, Zhang, Lu, Qin, Chen, Yang, Huang, Wang, Shen and Shen2016; Li et al., Reference Li, Tao, Ling and Chu2017). This combined treatment can improve the physicochemical properties of soil by increasing organic matter, moisture, and nitrogen content levels (Guo et al., Reference Guo, Wu, Li, Li, Liu, Meng, Liu, Yu and Jiang2016), thereby increasing yields and nitrogen use efficiency (Zhou et al., Reference Zhou, Sheng, Li, Tong, Ge and Wu2016a). According to Brar et al. (Reference Brar, Singh, Dheri and Balwinder–Kumar2013), both chemical and organic fertilizers have positive effects on SOC content in the subsurface layers of soil (15–60 cm). Organic amendment increases the pool of SOC, thus improving soil quality, and has better environmental outcomes than the application of chemical fertilizer alone (Guo et al., Reference Guo, Wu, Li, Li, Liu, Meng, Liu, Yu and Jiang2016; Moharana et al., Reference Moharana, Sharma and Biswas2012). However, most studies focus on the additional use of organic fertilizers without considering N input from organic fertilizers.
Increasing the SOC content also improves the physical properties of soil such as bulk density and the formation of soil aggregates, and this can strongly influence soil fertility, plant growth, and soil quality (Erktan et al., 2016; Gentile et al., Reference Gentile, Vanlauwe and Six2013). Organic fertilization increases the formation of stable macroaggregates and of microaggregates within macroaggregates after decomposition (Golchin et al., Reference Golchin, Oades, Skjemstad and Clarke1994; Volikov et al., Reference Volikov, Kholodov, Kulikova, Philippova, Ponomarenko, Lasareva, Parfyonova, Hatfield and Perminova2016). The contents of different sizes of aggregates are to some extent influenced by changes in SOC content (Abiven et al., Reference Abiven, Menasseri and Chenu2009). Meanwhile, other studies have indicated that chemical fertilization has no negative effects on soil physical properties such as the mean weight diameter (MWD) of aggregates (Xin et al., Reference Xin, Zhang, Zhu and Zhang2016).
In addition to improving SOC content, organic fertilizers improve other chemical properties of soil, such as nitrate and ammonia content, compared to chemical fertilizers (Li et al., Reference Li, Tao, Ling and Chu2017). Soil treated with chemical fertilizers alone shows increased NO3−–N levels and higher NO3−–N leaching rates than soil fertilized with manure during the maize growing season (Jia et al., Reference Jia, Shao, Liu, Zhao, Gu, Dong, Bing, Zhang and Zhao2014). Manure application decreases nitrogen loss through ammonia volatilization by 66.6% due to reduced soil NH4+–N concentrations relative to the application of chemical fertilizers (Guo et al., Reference Guo, Wu, Li, Li, Liu, Meng, Liu, Yu and Jiang2016). In addition, manure application presents good residual effects such as higher available N and P (Cai et al., Reference Cai, Zhang, Xu, Wang, Wen and Shah2018). Therefore, it is of interest to explore the N flow of available N under the same N input of different fertilizers.
Shifts in carbon and nitrogen availability affect microbial community composition (Zhao et al., Reference Zhao, Ge, Gunina, Li, Zhu, Peng, Wu and Kuzyakov2019) and the use of organic fertilizers in addition to chemical fertilizers increases the abundances of Bacillus, Trichoderma, and Pseudomonas, mainly due to increased SOC content (Li et al., Reference Li, Tao, Ling and Chu2017). The microbial community is able to adapt to long-term organic fertilization (Tian et al., Reference Tian, Lou, Gao, Fang, Liu, Xu, Blagodatskaya and Kuzyakov2017). The application of organic fertilizers benefits some microbes, increasing the abundance of ammonia-oxidizing bacteria (Fan et al., Reference Fan, Yang, Li, Wei, Cui and Liang2011) and denitrifier communities (Chen et al., Reference Chen, Hou, Zheng, Qin, Zhu, Wu and Wei2012). Bacteria also increase soil aggregate formation through the production of exudates (Degens, Reference Degens1997) and increase nutrient bioavailability via nitrogen mobilization (Rashid et al., Reference Rashid, Mujawar, Shahzad, Almeelbi, Ismail and Oves2016).
While the effects of chemical and organic fertilization on SOC and nitrogen have been widely studied, most studies have focused on effects of the additional application of organic fertilizers along with chemical fertilizers on soil and plants. However, how do SOC and nitrogen affect grain yield under the same N inputs? In the current study, we compared the effects of three different nitrogen sources (urea, cattle manure, and half manure and half urea) on soil with the same input of total N, P, and K in a 7-year fertilization experiment using a previously described lysimeter setup (Gu et al., Reference Gu, Liu, Shao, Wang, Dong, Zhao, So, Sun, Zhang and Zhao2014). Our objective was to determine the N flow, soil physicochemical properties, and bacterial communities under the same N inputs. We hypothesized that substituting half the amount of urea with manure would increase grain yields while maintaining a favorable physical and chemical soil environment.
Materials and Methods
Study site, experimental design, and management
The experiments were conducted at the Maize Technological Innovation Center (MTIC) at the Northern China Plain (NCP), located at Shandong Agriculture University (36°09’N, 117°09’E, 128 m above sea level) in Tai’an.
Field studies were conducted in lysimeter facilities of the NCP MTIC. The research facility includes 12 lysimeters (2.5 m long × 2.5 m wide × 2 m deep) filled with soil as described previously (Jia et al., Reference Jia, Shao, Liu, Zhao, Gu, Dong, Bing, Zhang and Zhao2014). The soil was classified as silt loam soil. From 2006 to 2009, no fertilizer was applied to the soil, and high levels of irrigation were applied with a rotation of wheat and maize planting to achieve uniform conditions of low soil fertility.
The study began in 2009. Initial soil status was: TN, 0.8 g kg−1; NH4+–N, 3.4 mg kg−1; NO3−–N, 14.2 mg kg−1; organic matter, 10.8%; bulk density, 1.1 g cm−3; pH, 7.3. Fresh manure (M; composted cow dung) and urea (U) were used as N fertilizers. Fertilizer treatments were applied using the same nutrient inputs (200 kg N ha−1, 245.7 kg P2O5 ha−1, and 202.5 kg K2O ha−1) for maize. Three fertilizer treatments were applied, including 100% urea (100%U), 100% manure (100%M), half manure and half urea (50%U + 50%M). The control soil (CK) did not receive any N input. The experiment was performed with a randomized block design with three replications.
Before sowing, the manure was analyzed to determine the concentrations of total N, P2O5, and K2O (as shown in Supplementary Material Table S1 available online at https://doi.org/10.1017/S0014479720000393). These values were used to calculate and balance the amounts of phosphate and potassium to use in 100%M and 50%U + 50%M treatments. Based on the content of N in manure, we applied manure with the same amount of N, 200 kg N ha−1. Then, we added additional P and K fertilizer (the same type with 100% urea) to ensure equal inputs of P and K (245.7 kg P2O5 ha−1 and 202.5 kg K2O ha−1). Manure was mixed with the top (0–10 cm) layer of soil with one application as the basal fertilizer, whereas for the mixed treatment 50% of the urea was applied at sowing, while the remaining 50% was applied at the 12-leaf stage. Calcium superphosphate and potassium fertilization were performed via surface application and manually mixed into the top (0–10 cm) layer of soil before crop planting.
Soil sampling
From 2009 to 2013, different fertilizer treatment as described above was applied to the soil with a rotation of wheat and maize. At the beginning and end of each growing season in 2014 and 2016, soil samples with three replications per treatment were randomly collected from each plot, to a depth of 0–180 cm, and divided into 20 cm increments. Each sample of 20 cm increments was divided into two portions. The first portion was air-dried, ground, passed through a 2 mm sieve, and used to analyze total nitrogen (TN) content, soil organic carbon (SOC) content, and soil pH in 0–20 cm soil layers. The first portion was stored in −20 °C and used to analyze NO3−–N and NH4+–N contents in 0–180 cm soil layers. Undisturbed soil was sampled using a steel 100 cm3 volume cylinder (5 cm in diameter and 5.1 cm in height) for bulk density.
Soil solution was collected 72 h after irrigation under 30 kPa vacuum from the 30 cm soil layer when maize plants were at the 6-leaf (V6), 12-leaf (V12), tasseling (VT), and milking (R3) growth stages. Total leachate was collected from the 200 cm soil layer throughout the growth stage. Soil solutions were stored at –20 °C for nitrate determination.
After harvesting the maize in 2016, soil samples were randomly collected from each plot with 3 shovelfuls per plot from the 0–5, 5–10, 10–15, and 15–20 cm soil layers and carefully transported to the laboratory for aggregate analysis. In 2016, when the plants were at the flowering stage, five soil cores per plot were collected from the top (0–20 cm) soil layer, mixed, passed through a 2-mm sieve, and stored at –80 °C for DNA extraction and PCR amplification.
Ammonia Volatilization
Ammonia volatilization was measured immediately after the application of base fertilizers and top dressing according to Wang et al. (Reference Wang, Liu, Ju, Zhang and Malhi2004). We collected the glycerin phosphate sponge into a 1 L cup every 2 days in the first week and every 3 days thereafter for 30 days. Samples were extracted by 1 mol L−1 KCl and then stored at –20 °C for analysis. Ammonia volatilization was measured with a Kjeldahl Analyzer (KjeltecTM 8200, Hillerød, Denmark).
Plant sampling and harvesting
Three maize plants per plot were sampled at the maturity stage, dried in an oven at 80 °C, and weighed. The dried tissue was then ground and passed through a 0.85- mm sieve for the TN content analysis. All plants in each plot were harvested at the maturity stage for yield measurements.
Chemical and physical analysis of soil
Soil pH in a 1:5 (w/v) soil/water suspension was measured using a digital pH meter. To measure TN concentration, the soil was digested by adding 10 mL H2SO4–H2O2 and TN content was determined with a continuous-flowing analyzer (Bran + Luebbe, Hamburg, Germany). NO3−–N and NH4+–N were extracted from the soil with 1 mol L−1 KCl and measured with a continuous-flow analyzer (Bran + Luebbe). Total soil inorganic N content of NO3−–N and NH4+–N at the beginning and end of each growing season was used to denote the initial N and residual N, respectively. SOC content was determined using the dichromate oxidation procedure (Yeomans and Bremner, Reference Yeomans and Bremner1988).
Soil aggregate analysis
Undisturbed soil samples were air-dried at room temperature to roughly achieve the plastic limit and separated into aggregates by hand along natural planes of weakness. The soil was cleared of visible plant residues and stones. Aggregates were separated by dry and wet sieving as described by Kemper and Rosenau (Reference Kemper and Rosenau1986) and divided into six fractions: >5, 5–2, 2–1, 1–0.5, 0.5–0.25, and <0.25 mm. Dry-sieved aggregates (R>0.25 mm, dry-sieving), water-stable aggregates (R>0.25 mm, wet-sieving), the MWD, and the geometric mean diameter (GMD) were analyzed as described by Pinheiro et al. (Reference Pinheiro, Pereira and Anjos2004) and Regelink et al. (Reference Regelink, Stoof, Rousseva, Weng, Lair, Kram, Nikolaidis, Kercheva, Banwart and Comans2015).
DNA extraction and PCR amplification
DNA was extracted from 250 mg soil samples using a QIAamp® DNA Stool Mini Kit (Qiagen, Valencia CA, USA). MiSeq technology was used to measure 16S rRNA transcript levels. PCR amplification from the v4–v5 region of the 16S rRNA gene from genomic DNA was performed using primers containing protruding end junctions designed based on the surrounding conserved region (515Fin: 5′–TTCCCTACACGACGCTCTTCCGAT CT–GTGCCAGCMGCCGCGGTAA–3′; 926Rin: 5′–GAGTTCCTTGGCACCCGAGA ATTCCACCGTCAATTCMTTTGAGTTT–3′). Phusion High-Fidelity PCR Master Mix with HF buffer (New England Biolabs, Hitchin, UK) was used to amplify each sample. Illumina sequencing junction box dual index bar codes were added to each amplicon using 5 μL of the subsequent finite cycle PCR of each PCR product (515Fout: 5′–AATGATACGGCGACCACCGGATCTACAC–NNNNNNNN–TCTTTCCCTACAC GACGCTC–3′; 926Rot: 5′–CAAGCAGAAGACGGCATACGAGAT–NNNNNNNN–GTGACTGGAGTTCCTTGGCACCCGAGA–3′). After purification using an Axygen AxyPrep DNA Gel Extraction kit (Axygen Scientific, Union City, CA, USA), the expression data for each library were standardized using a real-time PCR system (FTC3000; Funglyn Biotech, Canada). Products from different samples were mixed at the same molar ratio prior to sequencing on the MiSeq platform using a 2 × 300 cycle V3 kit according to the standard Illumina sequencing protocol. Sequence analysis was carried out using the software QIIME (Quantitative Insights into Microbial Ecology) as described by Fadrosh et al. (Reference Fadrosh, Ma, Gajer, Sengamalay, Ott, Brotman and Ravel2014). Sequence reads were extracted, primer sequences were removed, and the sequence reads without an average quality of 20 over a 30 bp were truncated. The sequence reads less than 75% of their original length and its paired read were trimmed. The trimmed and unique sequences were used to define the number of operational taxonomic units (OTUs) at the 97% similarity level.
Data analysis
The experimental data were statistically analyzed by ANOVA with SPSS Statistics (SPSS 20.0, IBM Corp., Armonk, NY, USA). One-way ANOVA was used for comparisons, and Tukey’s honest significant difference method (α = 0.05) was used for multiple comparisons. Linear regression analysis and Pearson correlation coefficients were calculated with Sigmaplot (Sigmaplot 12.5, Systat Software Inc., San Jose, CA, USA). The diversity analysis of the microbial community for each treatment was conducted using the Chao and Shannon indices based on the Illumina MiSeq sequencing data.
Results
Soil physical properties
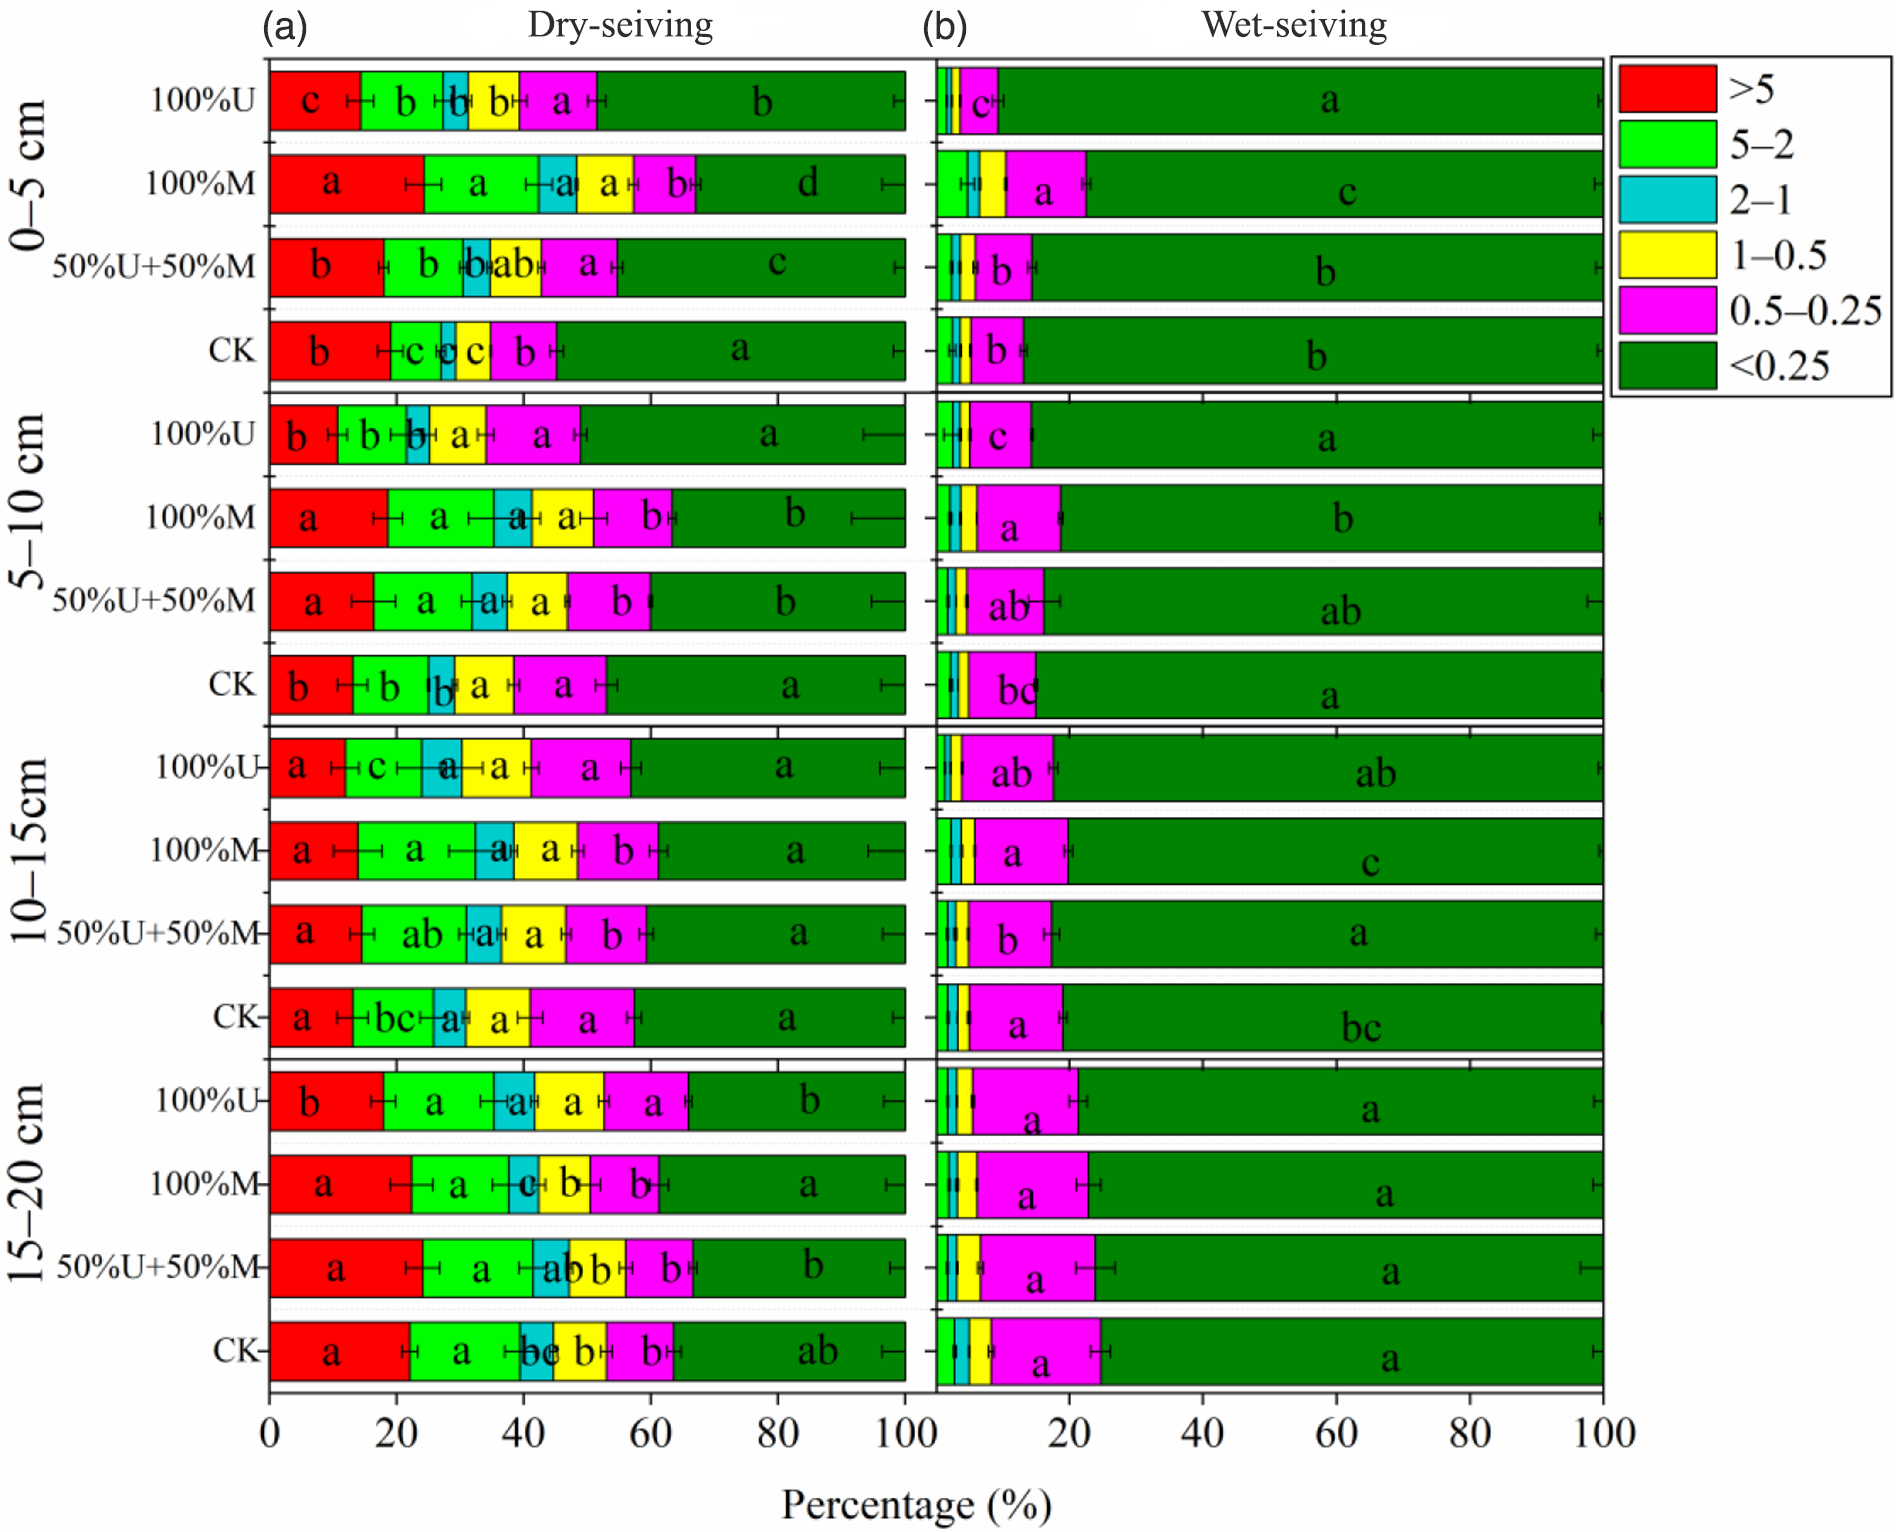
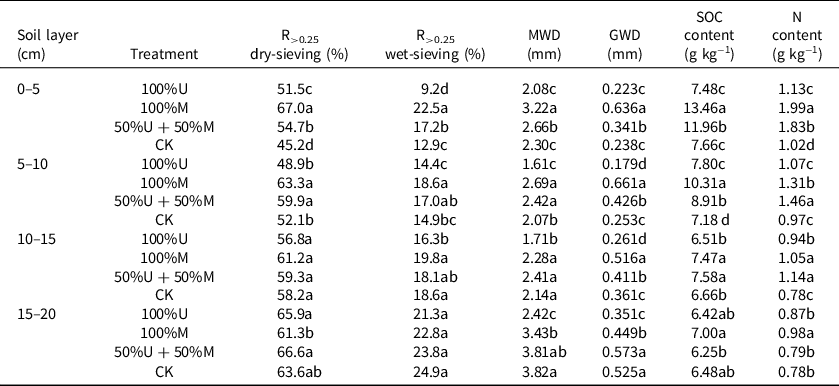
The proportion of aggregate fractions, MWD, and GMD was affected after 11 years of various fertilization treatments (Figure 1; Table 1). At 0–5 cm soil depth, aggregate fractions of >5 and 5–2 mm in dry sieving were major proportion, which showed a trend of 100%M > 50%M + 50%U > 100%U (Figure 1a). These differences in aggregate size distribution were reflected in MWD and GMD. Treatment with 100%M and 50%M + 50%U significantly increased MWD and GMD, whereas treatment with 100%U led to the lowest MWD and GMD (Table 1).
Aggregate fractions of dry sieving (a) and wet sieving (b) in 0–20 cm soil depth as affected by fertilization: 100% urea (100%U), 100% manure (100%M), half manure and half urea (50%U + 50%M), no nitrogen fertilizer (CK). Aggregate fractions include those > 5, 5–2, 2–1, 1–0.5, 0.5–0.25and <0.25 mm.

Macroaggregate (R>0.25, dry-sieving and wet-sieving), aggregate geometric diameter (GMD), aggregate weight diameter (MWD), soil organic carbon (SOC), and N contents as affected by fertilization: 100% urea (100%U), 100% manure (100%M), half manure and half urea (50%U + 50%M), no nitrogen fertilizer (CK)

Different letters represent significant differences (p ≤ 0.05). Samples were taken in 2016.
At 5–10 cm soil depth, treatment with 100%M and 50%M + 50%U significantly increased R>0.25 in soil subjected to both dry and wet sieving, while the lowest R>0.25 values were detected in soil treated with 100%U (Table 1). These treatments resulted in the same trends for MWD and GMD, even though the values after 100%U treatment were significantly lower than those of CK, that is, 1.61 and 0.179 mm versus 2.07 and 0.253 mm, respectively (Table 1). At 10–15 and 15–20 cm, there was no significant difference in R>0.25 among treatments, while the 100%U treatment caused a significantly lower MWD and GMD compared to the 100%M, 50%M + 50%U, and CK (Table 1).
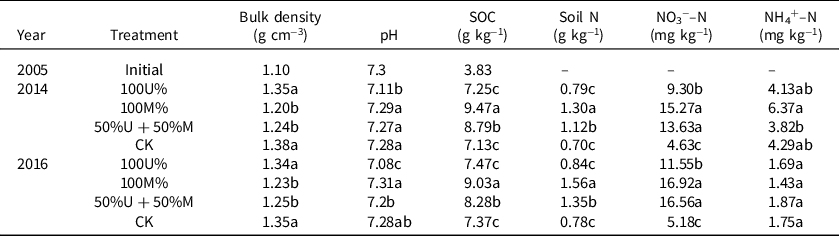
In 2014 and 2016, treatment with 100%U significantly increased the bulk density in the 0–20 cm layer of soil, whereas treatments with 100%M and 50%M + 50%U had no significant effect on this parameter compared with CK (Table 2).
Physical and chemical properties in 0–20 cm in 2014 and 2016 as affected by fertilization: 100% urea (100%U), 100% manure (100%M), half manure and half urea (50%U + 50%M), no nitrogen fertilizer (CK)

SOC, the content of soil organic carbon; Soil N, total nitrogen content in soil in 0–20 cm; NO3−–N, nitrate content in soil; NH4+–N, ammonium content in soil; different letters represent significant differences (p ≤ 0.05).
SOC and nitrogen content
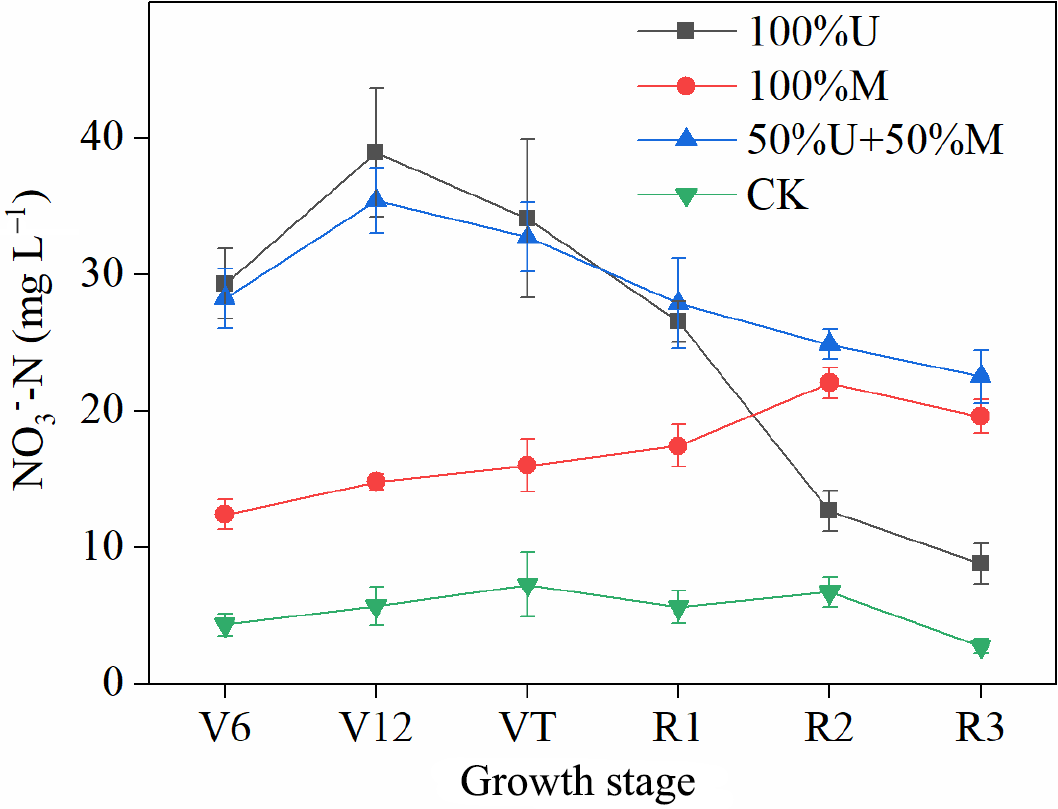
In 2014 and 2016, treatment with 100%M and 50%M + 50%U significantly increased the content of SOC, TN, and NO3−–N in the 0–20 cm soil layer compared to 100%U and CK (Table 2). The NO3−–N content of 50%M + 50%U in soil solutions was high throughout the growth stage, while that of 100%U was lower than that of 100%M and 50%M + 50%U at R2 and R3 stages (Figure 2).
Nitrate content in soil solution extracted from 0 to 30 cm soil layer as affected by fertilization: 100% urea (100%U), 100% manure (100%M), half manure and half urea (50%U + 50%M), no nitrogen fertilizer (CK). V6, jointing stage; V12, 12th leaf stage; VT, tasseling stage; R1, silking stage; R2, blister stage; R3, milk stage.

SOC and N content significantly differed among soil layers in 2016 (Table 1). At 0–5 cm soil depth, 100%U induced a very low SOC content of approximately 7.48 g kg−1 (Table 1). The 100%M and 50%M + 50%U caused a significantly higher SOC content, increasing SOC by 79.8 and 59.8% when compared to 100%U, respectively (Table 1). The TN content in the 0–5 cm soil layer followed a similar trend to that of SOC; treatment with 100%M and 50%M + 50%U led to a significantly higher TN of approximately 1.99 and 1.83 g kg−1, increased by 75.2 and 61.0% compared to 100%U, respectively (Table 1). In the 5–10 cm soil layer, SOC and TN under 100%M treatment were 58.4 and 22.5% higher compared to 100%U, and those under 50%M + 50%U treatment were 36.8 and 36.4% higher compared to 100%U, respectively (Table 1). SOC and TN were also much higher in each aggregate fraction in 0–5 cm soil depth under 100%M and 50%M + 50%U treatment compared to 100%U (Supplementary Material Figures S1 and S2).
Microbial abundance and diversity
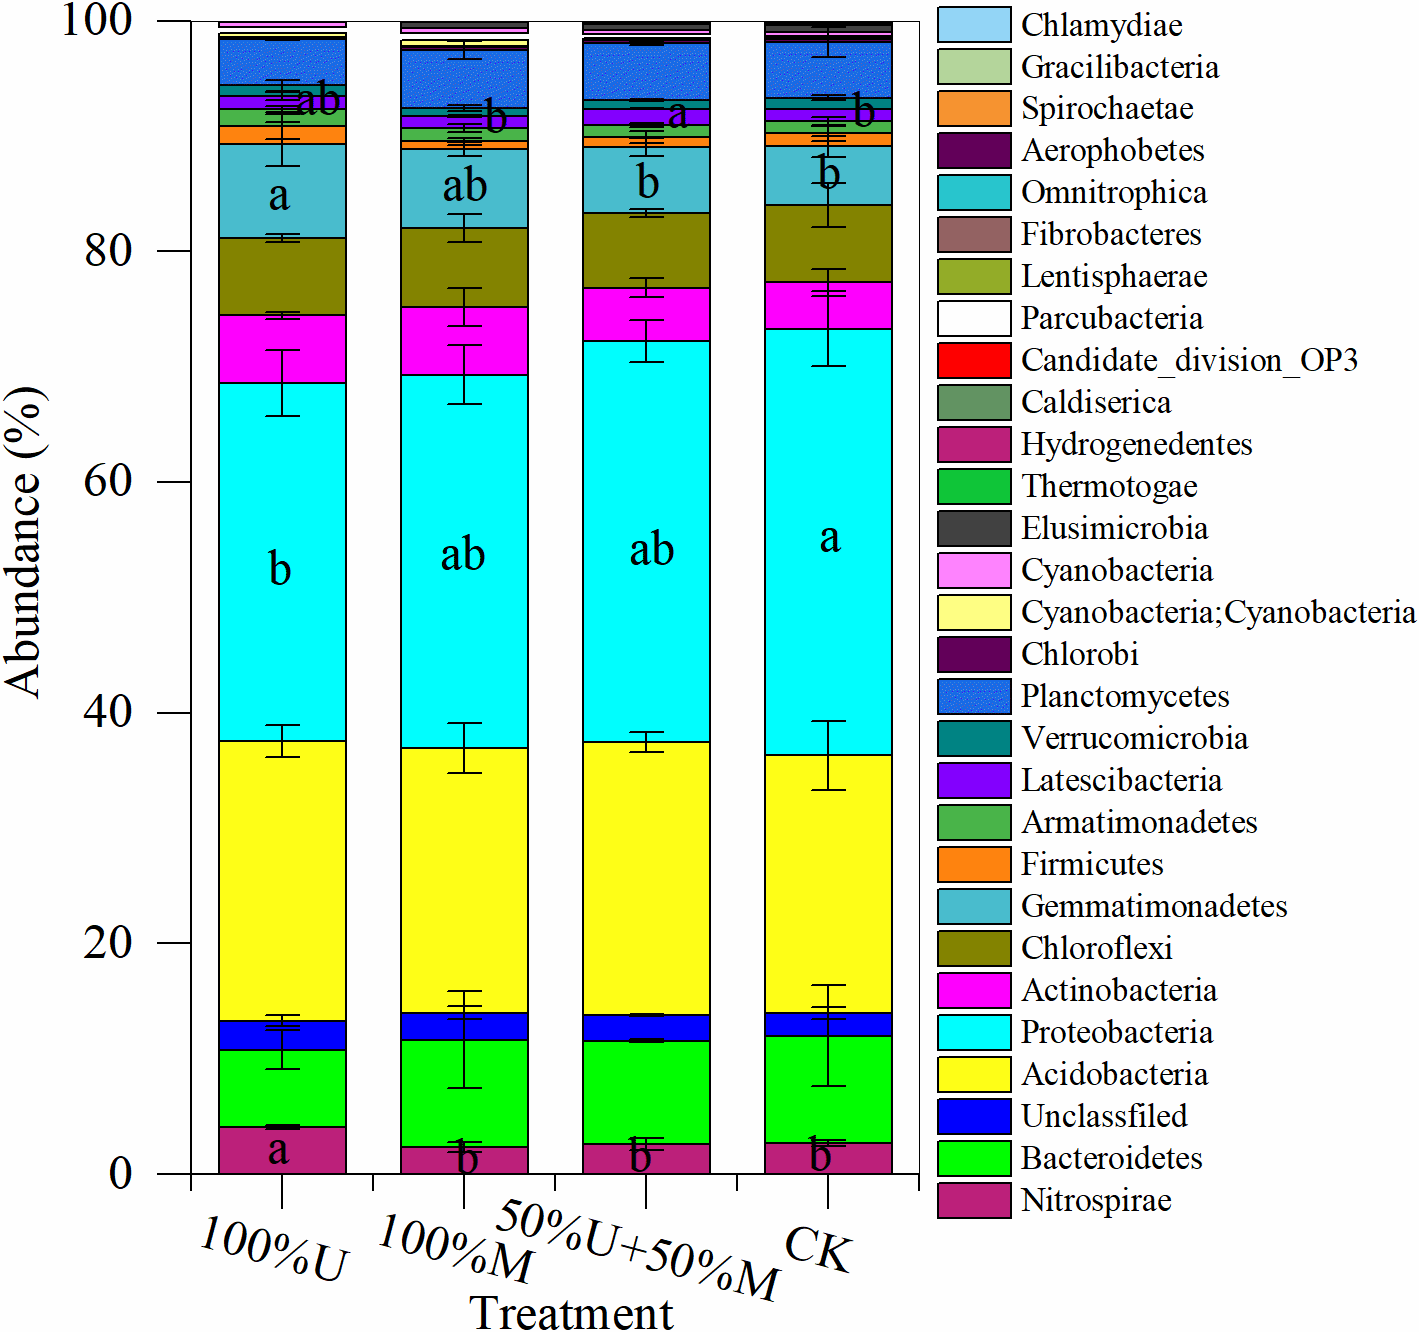
We analyzed the microbial abundance and diversity of soil samples collected in 2016. Significant differences in richness and diversity were observed in terms of OTUs and the ACE, Chao, Shannon, and Simpson indices (Supplementary Material Table S2). Compared with CK, treatment with 100%M and 50%M + 50%U significantly increased microbial diversity (higher Shannon and Chao indices and lower Simpson index), whereas 100%U had no significant effect on microbial diversity (Table S2). The dominant phyla across all treatments were Nitrospira, Bacteroidetes, Acidobacteria, Proteobacteria, Actinobacteria, Chloroflexi, Gemmatimonadetes, Firmicutes, Armatimonadetes, Latescibacteria, and Verrucomicrobia (>1%), accounting for more than 98% of bacterial sequences (Figure 3). The populations of Nitrospira, Proteobacteria, Gemmatimonadetes, Latescibacteria, and Chlorobi were significantly affected by fertilizer treatments (Figure 3).
Phylum-level bacterial community structure as affected by fertilization: 100% urea (100%U), 100% manure (100%M), half manure and half urea (50%U + 50%M), no nitrogen fertilizer (CK) in 2016.

Nitrogen and grain yield
The application of fertilizer significantly increased the crop uptake (CU) of nitrogen compared to the CK, whereas treatment with 100%M led to significantly lower CU of nitrogen among the three fertilization treatments in 2014 and 2016 (Supplementary Material Table S3). Nitrogen leaching accounted for 2.0–26.9% of TN input and 100%U significantly increased nitrogen leaching, with levels 1027.6 and 477.8% higher than those of CK in 2014 and 2016, respectively. The treatments with 100%M and 50%M + 50%U did not significantly differ from those of CK for nitrogen leaching in 2014 (Table S3). Nitrogen loss from ammonia volatilization (AM) showed a trend of 100%U > 50%M + 50%U > 100%M > CK in 2014. In 2016, nitrogen leaching and AM showed the same trends as in 2014.
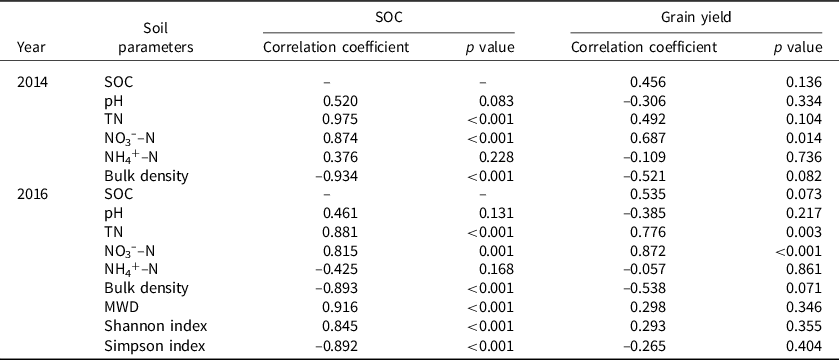
In 2014 and 2016, all three fertilization treatments significantly increased the grain yield of summer maize (Table 3). Treatment with 50%M + 50%U produced the highest grain yield, increasing by approximately 10 and 20% in 2014 and 3.5 and 5.2% in 2016 when compared to 100%U and 100%M, respectively (Table 3). Treatment with 100%U led to a significantly higher grain yield than 100%M in 2014, whereas the effects of 100%U and 100%M did not significantly differ in 2016 (Table 3). Grain yield was positively correlated with soil NO3−–N content in 2014 and 2016 (Table 4).
Grain yield in 2014 and 2016 as affected by fertilization: 100% urea (100%U), 100% manure (100%M), half manure and half urea (50%U + 50%M), no nitrogen fertilizer (CK)

Different letters represent significant differences (p ≤ 0.05).
Pearson correlations of soil parameters with soil organic carbon (SOC) and grain yield

SOC, the content of soil organic carbon; TN, total nitrogen content in soil; NO3−–N, nitrate content in soil; NH4+–N, ammonium content in soil; MWD, the mean weight diameter of soil aggregates.
Discussion
Strategies for achieving high crop yield will be essential in addressing food security challenges due to the increasing global population and limited farmland availability (Smith et al., Reference Smith, Haberl, Popp, Erb, Lauk, Harper, Tubiello, De Siqueira Pinto, Jafari, Sohi, Masera, Böttcher, Berndes, Bustamante, Ahammad, Clark, Dong, Elsiddig, Mbow, Ravindranath, Rice, Robledo, Romanovskaya, Sperling, Herrero, House and Rose2013). Herein, the use of 50%U + 50%M caused the highest grain yield (Table 3), which was positively correlated with crop N uptake (Table 4). This may be attributed to the residual effect of manure application (Shen et al., Reference Shen, Yang, Yao, Wu, Wang, Guo and Yin2007) and the rapid fluctuation in NO3−–N content of chemical fertilizer (Lee, Reference Lee2010). Indeed, organic fertilizer was shown to maintain a stable NO3−–N content throughout the growing season, while chemical fertilizer application led to a rapid decrease in NO3−–N content after R1 stage (Figure 2). The content of soil NO3−–N was positively correlated with grain yield (p < 0.01), whereas SOC content was not, implying that an increased SOC indirectly increases grain yield by increasing soil nitrate supply throughout the growing season. The 100%M generated the highest initial N before sowing and residual N after harvest. Manure application alone barely achieved the same grain yield compared with solo chemical fertilizer application under the same N input (Chen et al., Reference Chen, Deng, Zhang, Li, Qiao, Yang, Zheng, Cao and Chen2018). Accordingly, the grain yield under 100%M was lower than that of 50%U + 50%M and 100%U (Table 3), whereas chemical fertilizer application alone after 25-year fertilization indirectly affected grain yield and yielded less than manure application alone under nitrogen input of 210 kg ha−1 (Cai et al., Reference Cai, Zhang, Xu, Wang, Wen and Shah2018). This was due to the contrast effect that chemical fertilizer application decreased the soil pH from 5.70 to 4.35, while solo manure application increased the soil pH from 5.70 to 6.66 (Cai et al., Reference Cai, Zhang, Xu, Wang, Wen and Shah2018). Although the soil pH showed no correlation with grain yield in the present study, chemical fertilization alone led to soil acidification (Table 2). These findings suggest that substituting half of the urea with manure may ensure a sustainable, good nitrate supply throughout the maize growing season, thereby increasing grain yield.
The physical and chemical status of the studied soil markedly changed after 7 years of fertilization. Treatment with manure led to a marked decrease in soil bulk density (Guo et al., Reference Guo, Wu, Li, Li, Liu, Meng, Liu, Yu and Jiang2016). Guo et al. (Reference Guo, Wu, Li, Li, Liu, Meng, Liu, Yu and Jiang2016) found soil bulk density to be significantly lower after treatment with 100% cattle manure compared to 50% cattle manure combined with 50% chemical fertilizer. Here, 100%M and 50%U + 50%M treatment significantly decreased the soil bulk density compared with CK and 100%U treatment (Table 2). In addition to reducing bulk density, organic amendment can also increase soil porosity (Bronick and Lal, Reference Bronick and Lal2005). In general, treatment with manure and the combined application of manure and chemical fertilizer increase the formation of macroaggregates (Xie et al., Reference Xie, Li, Zhang, Wang, Wang, He and Zhang2015). We found the treatment with 100%M and 50%U + 50%M significantly increased macroaggregate formation compared to 100%U and CK in the 0–10 cm soil layer (Table 1). In addition, both MWD and GMD significantly increased in response to the application of 100%M and 50%U + 50%M in the 0–10 cm soil layer, reflecting soil aggregate stability (Table 1). The enhanced stabilization of soil aggregates observed might be due to the considerable adhesive properties supplied by SOC (Tisdall and Oades, Reference Tisdall and Oades1982). Although Lu et al. (Reference Lu, Lepo, Song, Guan and Zhang2018) have demonstrated that long-term chemical fertilization also increases the formation of soil macroaggregates, our treatment with 100U% reduced macroaggregate formation compared to CK (Table 1).
Previous studies have shown that both organic and chemical fertilization increased the SOC content (Brar et al., Reference Brar, Singh, Dheri and Balwinder–Kumar2013; Xie et al., Reference Xie, Li, Zhang, Wang, Wang, He and Zhang2015). Accordingly, treatments with 100%M and 50%U + 50%M significantly increased the SOC content compared with 100%U and CK in the top (0–10 cm) soil layer, and soil treated with 100%U had a significantly higher SOC content than CK soil in the 5–10 cm soil layer (Table 1). Manure treatment involves the direct input of organic material, whereas chemical fertilization involves the indirect input of plant biomass residues as an organic source (Tripathi et al., Reference Tripathi, Nayak, Bhattacharyya, Shukla, Shahid, Raja, Panda, Mohanty, Kumar and Thilagam2014). While the same SOC contents were obtained in 100%U and CK treatment, 100%U significantly reduced MWD and GMD in the 10–20 cm soil layer compared to CK (Table 1), which was likely due to decreased soil pH induced by 100%U (Table 2). Treatment with chemical fertilizer alone significantly decreased soil pH compared with CK, while manure and manure plus urea had no significant effect on soil pH (Table 2). As a possible explanation, the buffering effects of the carboxyl and phenolic hydroxyl groups in manure balanced the acidity generated by urea (Garcia–Gil et al., Reference Garcia–Gil, Ceppi, Velasco, Polo and Senesi2004). Soil N status also varied after 7 years of fertilization. Although the TN input was the same under all fertilizer treatments, 100%M and 50%U + 50%M caused significantly higher soil TN contents than the other treatments (Table 2). These results are consistent with the findings of a previous study, in which the manure input ratio of >50% caused higher TN content than chemical fertilization alone (Guo et al., Reference Guo, Wu, Li, Li, Liu, Meng, Liu, Yu and Jiang2016), likely due to the lower release rate of nitrogen from manure (Liu et al., Reference Liu, Li, Zhou, Zhang, Jia, Lin, Wang, Siddique and Li2013).
Soil microbial abundance and diversity are also important factors affecting soil quality (Murugan and Kumar, Reference Murugan and Kumar2013). In recent years, many studies have focused on the effects of manure amendment on soil bacteria (Chen et al., Reference Chen, Zhang, Lu, Qin, Chen, Yang, Huang, Wang, Shen and Shen2016; Mocali et al., Reference Mocali, Galeffi, Perrin, Florio, Migliore, Canganella, Bianconi, Di, Dell’Abate, Fani and Benedetti2013). Manure amendment significantly increases the abundance of Gemmatimonadetes and decreases the abundance of Acidobacteria and Cyanobacteria (Chen et al., Reference Chen, Zhang, Lu, Qin, Chen, Yang, Huang, Wang, Shen and Shen2016). Tu et al. (Reference Tu, Qiao, Zhu, Li and Wu2018) demonstrated that organic manure increases the abundance of members of the bacterial phylum Firmicutes compared to inorganic fertilizer. Here, 100%U increased the abundance of Nitrospirae compared to 100%M and 50%U + 50%M treatment, leading to a higher leaching risk. Soil pH (Zhalnina et al., Reference Zhalnina, Dias, de Quadros, Davis–Richardson, Camargo, Clark, McGrath, Hirsch and Triplett2015) and SOC content (Li et al., Reference Li, Chen, Xu, Ma, Olk and Zhao2018) are thought to be the main factors leading to different soil bacterial abundances in response to fertilizers. In fact, SOC content was positively correlated with the Shannon index (Table 4). Both inorganic and organic fertilizers have important effects on bacterial community structure and diversity (Geisseler and Scow, Reference Geisseler and Scow2014). Inorganic N fertilizer was previously found to markedly reduce bacterial diversity compared to manure amendment (Chen et al., Reference Chen, Zhang, Lu, Qin, Chen, Yang, Huang, Wang, Shen and Shen2016). Consistent with this finding, 100%M and 50%U + 50%M treatment significantly increased the alpha diversity of bacteria compared to CK and 100%U treatment based on the ACE, Chao, and Shannon indices (Table S2). Meanwhile, 100%U significantly reduced bacterial diversity compared to CK, as indicated by the Shannon index (Table S2). These results suggest that adding manure to the soil alters the composition of bacterial communities.
The loss of soil nitrogen is significantly affected by the type of fertilizer applied, even with the same level of nitrogen input. Globally, ammonia volatilization accounts for an average of 18% (up to 64%) of nitrogen loss after chemical fertilization (Pan et al., Reference Pan, Lam, Mosier, Luo and Chen2016). We found ammonia volatilization to account for 6.8–20.0% of the loss of nitrogen input and the highest ammonia volatilization was found under 100%U (Table S3). Indeed, Xia et al. (Reference Xia, Lam, Yan and Chen2017) demonstrated that substituting manure for chemical fertilizer significantly decreased ammonia volatilization by 26.8%. The presence of highly buffered soils due to high concentrations of soil organic matter may partly explain the low rates of ammonia volatilization observed in soil treated with manure application alone (Jones et al., Reference Jones, Brown and Engel2013). By contrast, higher ammonia volatilization was detected in soil treated with manure plus chemical fertilizer compared to chemical fertilizer alone (Huang et al., Reference Huang, Duan, Xu, Zhai, Zhang, Wang, Zhang, Gao and Sun2017; Zhou et al., Reference Zhou, Zhu, Brüggemann, Dannenmann, Wang and Butterbach–Bahl2016b). This difference might be due to the different soil pH conditions and fertilizer application depths in soil utilized in these studies. In addition, N loss from ammonia volatilization could be higher than that measured in this experiment, as we only collected ammonia nitrogen for the first 30 days after fertilization.
Minimizing nitrogen leaching is also critical for reducing nitrogen pollution in agroecosystems. In the present study, soil treated with 100%U exhibited the highest rate of nitrogen leaching, while treatment with 100%M and 50%U + 50%M had no significant effect on nitrogen leaching compared to CK (Table S3). This may be partly due to the small mineral nitrogen pool and high moisture retention capacity of manure (Blanco–Canqui et al., Reference Blanco–Canqui, Hergert and Nielsen2015; Iqbal et al., Reference Iqbal, Arif, Thierfelder, Yasmeen and Li2019; Wang et al., Reference Wang, Zhu, Zhang, Müller and Cai2015). Zhalnina et al. (Reference Zhalnina, Dias, de Quadros, Davis–Richardson, Camargo, Clark, McGrath, Hirsch and Triplett2015) demonstrated that high relative abundance of Nitrospirae bacteria increases the leaching risk. Thus, significantly higher relative abundance of Nitrospirae after 100%U application might contribute to high rates of nitrogen leaching from soil (Figure 3). Additionally, MWD was negatively related to nitrogen leaching under all three fertilizer treatments (R = –0.778, p = 0.014). This finding is consistent with the notion that the enhanced stability of soil aggregates induces the immobilization of mineral nitrogen in soil, thus reducing nitrogen leaching (Cui et al., Reference Cui, Wang, Yue, Wu, Zhang, Zhang and Chen2014).
Conclusion
Manure application significantly increased the contents of SOC, TN content, NO3−–N, and, NH4+–N, increased the formation of macroaggregates and aggregate MWD, enhanced soil bacterial abundance and diversity, and decreased nitrogen loss through ammonia volatilization and nitrogen leaching. Treatment with half manure and half urea led to the highest grain yield in summer maize, due to the improved nitrogen supply throughout the plant growth stage.
Supplementary materials
For supplementary material for this article, please visit https://doi.org/10.1017/S0014479720000393
Acknowledgements
This work was supported by grants from the National Key Research and Development Program of China (2016YFD0300106) and the National Natural Science Foundation of China (31371576, 31071358).
Financial support
None.