
I. INTRODUCTION
Since multi-pass weld joints had been exposed to complex thermal cycling, inhomogeneous microstructure was obtained, Reference Amrei, Monajati, Thibault, Verreman, Germain and Bocher1 leading to various failure styles under different loading conditions and thus significantly affected the structural integrity of the welded structure. Reference Castelluccio, Perez Ipiña, Yawny and Ernst2 With regard to the Al–Zn–Mg alloys, Al–Mg alloy weld fillers were recommended by NASA, Reference Mathers3 so the weld seam was often proved to be the weakness area of the joints. Reference Zhang, Dong, Wang, Xu, Fang and He4,Reference Shu, Tian, Lv, He, Lv, Lin, Zhao and Xu5 The heat affected zone (HAZ) with steep gradients in mechanical properties were extended for a few millimeters from the fusion line to the base metal. Reference Castelluccio, Perez Ipiña, Yawny and Ernst2 Though the heat affected zone (HAZ) was also found vulnerable, the mechanical weakness area of the joint was almost inevitablely a weld seam under the condition without postweld heat treatments. Reference Ma and Den Ouden6
Microstructural inhomogeneity was intrinsic in multi-pass weld metal, based upon local chemical composition and significantly affected by welding parameters. K. Devakumaran Reference Devakumaran, Ananthapadmanaban and Ghosh7 had suggested an available method to study the intrinsic inhomogeneity in multi-pass weld metal and especially emphasized the effects of the certain elements, which showed us the way to the effects of key elements like Zn and Mg. Evolution process of microstructure became complex under multi-pass welding situation. The subsequent weld passes could play the role of double quenching or tempering heat treatment and gave birth to double-quenched martensite or carbides precipitates absent in the single pass weld. Reference Amrei, Monajati, Thibault, Verreman, Germain and Bocher1 R. Mythili Reference Mythili, Thomas Paul, Saroja, Vijayalakshmi and Raghunathan8 described the modification of the primary solidification structure of the weld region of a 9Cr1Mo steel weldment, due to reheating during multi-pass welding. Experiments indicated that weld passes could give birth to carbides strengthening precipitates with Cr enrichment and a repetitive microstructure consisted of columnar grain, coarse grained austenite, fine grained austenite, and unaffected structure within the weld zone. Recrystallization occurred with the grains dramatically refined as the subsequent weld pass was applied, though grain refinement might be reduced by complete recrystallization. Reference Ma, Fang, Yang, Liu and Fang9 The inhomogeneity of mechanical properties in the weld metal should be explained or predicted by local microstructure characteristics. Creep cavitation in the vermicular region of the weld metal was confined by the appearance of intermetallics. Multi-pass welding gave birth to high dislocation density in the region consisted of globular ferrite, which ascertained the conclusions by M.M. Amrei Reference Amrei, Monajati, Thibault, Verreman, Germain and Bocher1 and rendered the weld metal more resistant to creep deformation. Reference Vijayanand, Laha, Parameswaran, Ganesan and Mathew10 Uniform properties throughout the multi-pass GMA weld metal might be obtained under the condition of lower angle of attack against the groove wall surface along with low heat input, because the local chemical composition should be retained with decreased dilution of weld deposit.
Generally the emphasis of current research was placed upon the microstructural and mechanical inhomogeneity between weld bead and HAZ rather than along the thickness direction of the joint. So, more precise evaluation, at least the average value rather than any overall mechanical evaluation, of mechanical properties in the WM or HAZ was expected by taking the inhomogeneity along thickness direction into consideration. It was hinted that the welding process could engender stress intensity by affecting the structure of dislocations and finally yielded high-stress cracks. Reference Vijayanand, Laha, Parameswaran, Ganesan and Mathew10 In addition, narrow-gap GMA welding had been revealed to be aggressively compatative as compared with the other welding procedures relying on the combination of high efficiency, low heat input, small deformation, and excellent joint properties. Reference Deng and Kiyoshima11 So, narrow-gap GMA welding was implemented to weld thick Al–Zn–Mg alloy plates. The presented study was focused on the microstructural and mechanical inhomogeneity of the multi-pass weld metal so as to better understand the complex nature of the weld and supply accordance for the integrity evaluation of high strength aluminum weld joints.
II. EXPERIMENTS
The AA7A52 plates with a size of 100 × 50 × 20 mm were welded by eight welding passes with a GMA welding source and automatic welding robot. ER5356 with a diameter of 1.6 mm was chosen as filler metal while argon with purity of 99.99% was chosen as shielding gas. Table I addressed the nominal chemical composition of the base material and filler wire.
Chemical composition of the base metal and the filler metal (wt%).

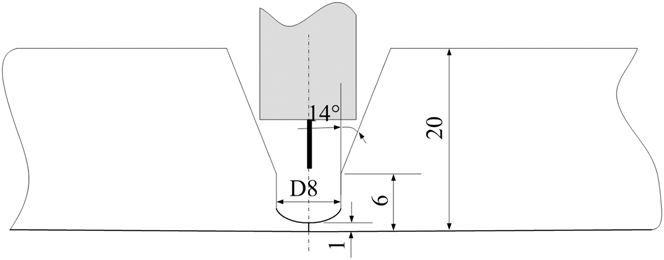
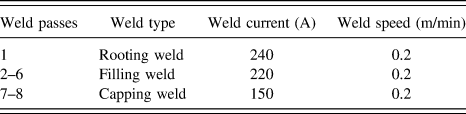
The plates were beveled to be V-shaped with U-shaped bottom, assembled and horizontally fixed according to the dimension of the groove as shown in Fig. 1. Prior to welding, the surface of the specimen was degreased by wiping with acetone, cleaned with a brush that had stainless bristles, and then dried with a blower. The inter-pass cooling time was set over 150 s whereas the welding slag was cleaned up so that the inter-pass temperature was kept below 50 °C and inter-pass contamination was avoided. Table II exhibited the welding parameters of different weld passes.
The schematic of the V-shaped bevel with U-shaped bottom.

Narrow gap MIG welding parameters.

Specimens for optical microstructural studies were polished and etched in a solution containing 1 mL HF, 1.5 mL HCl, 2.5 mL HNO3, and 95 mL deionized water. Microstructural and composition analysis of weld metal was performed using NANOSEM 450 scanning electron microscope (SEM; FEI Company, Hamilton, Ohio) and Oxford INCA energy diffraction x-ray spectrum (EDS; Oxford Instruments, Abingdon, United Kingdom) analyzers, respectively. The phases presented in the weld seam were identified with x-ray diffractometer (XRD; D/max 2500, Rigaku Corporation, Toyko, Japan) using Cu Kα radiation. For selected area diffraction analysis by transmission electron microscopic (TEM-SAD) thin foil specimens were successively prepared by mechanical thinning and electrolytic thinning and were observed using a JEOL-2100 transmission electron microscope (JEOL Ltd., Tokyo, Japan) at an operating voltage of 200 kV.
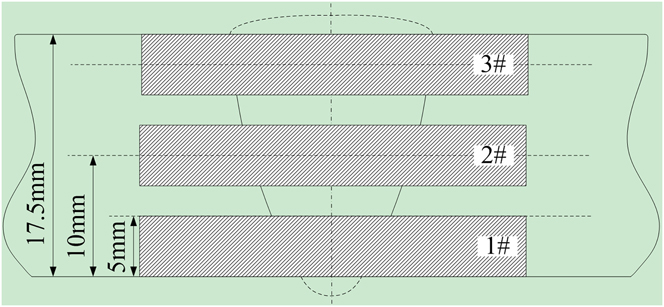
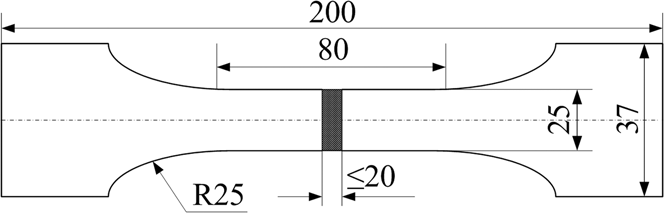
To study the mechanical inhomogeneity of the multi-pass weld metal, hardness profiles along the thickness direction of the weld seam was measured by Vickers hardness tester with a testing load of 500 g and a loading time of 10 s. Tensile specimens were taken from the bottom, the middle, and the top layers of the weld seam and numbered as 1, 2, and 3, respectively, as shown in Fig. 2. Transverse weld specimens with a gauge length of 80 mm and a gauge width of 25 mm were used for tensile tests at a constant displacement rate of 2 mm/min at room temperature. The size of the specimens was shown in Fig. 3. The tensile experiment was carried out on the tensile strength tester MTS808 (MTS Industrial Systems, Eden Prairie, Minnesota), after which the micromorphology and local chemical composition in the fracture surfaces of the broken samples was observed by SEM and EDS test, respectively.
The schematic of the tensile specimens from the bottom, the middle, and the top layers of the weld seam.

Schematic diagram of the size for tensile test specimens.

III. RESULTS AND DISCUSSIONS
A. Microstructure of different zones in the weld seam
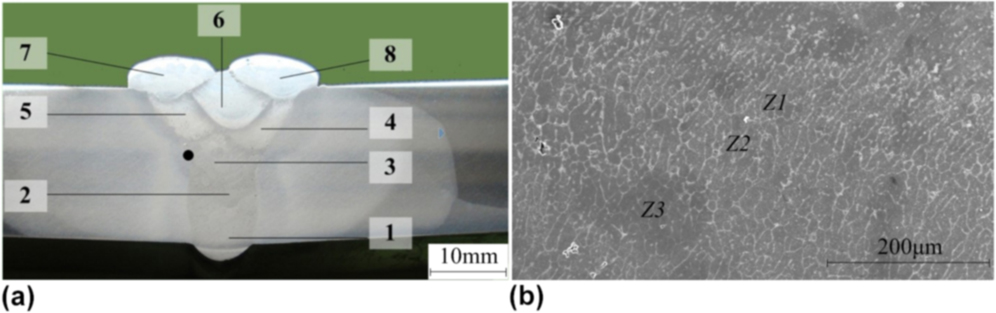
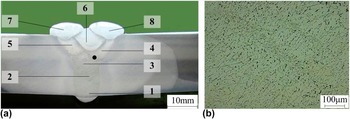
With regard to the multi-pass weld seam, distinct zones with different microstructural characteristics included the fusion zone, the interpass area and the inner part of weld passes. The microstructure morphology of the fusion zone should be divided into three regions including the zone of fine equiaxed grains (Z 1), the zone of columnar grains near the fusion line (Z 2), and the zone of equiaxed grains at the end of the columnar grains (Z 3) as shown in Fig. 4. Z 1 was formed as a result of great undercooling at the fusion line, while Z 2 was formed since grains grew along the direction of the maximum temperature gradient or the reverse direction of heat flux. Low melting eutectics were repelled to the end of the columnar grain and became the new crystal nucleus, which provided favorable condition for the formation of equiaxed grains in Z 3. The microstructure morphology of the interpass area between the third and the fourth weld passes was shown in Fig. 5. Column-shaped microstructure was the typical feature extending from the fusion line of a weld pass toward the subsequent passes as suggested by Ref. Reference Amrei, Monajati, Thibault, Verreman, Germain and Bocher1.
Macro morphology of the tested fusion zone identified by circular point (a) and the corresponding microstructure morphology (b).

Macro morphology of the tested interpass area between the third and the fourth weld passes (a) and the corresponding microstructure morphology (b).

The microstructure of the observed area in the first, the third, and the sixth weld passes was presented in Fig. 6 and considered as the typical microstructure of the bottom, the middle and the top layers, respectively. The microstructure morphology of the first weld pass was characterized with discontinuous grain boundaries, which was obviously different from the other weld passes. As compared with the sixth weld pass, grains in the third weld pass got fined, which should be attributed to the following weld passes.
Macro morphology of the tested areas including the bottom layer (B), the middle layer (M) and the top layer (T) (a), and the corresponding microstructure morphology of area B (b), area M (c) and area T (d).

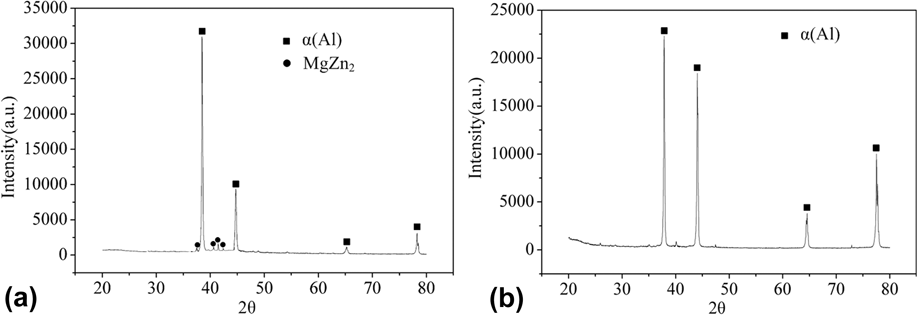
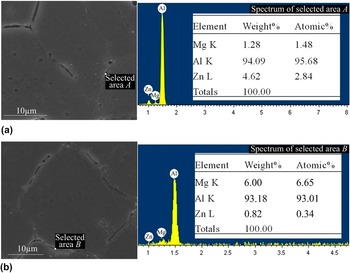
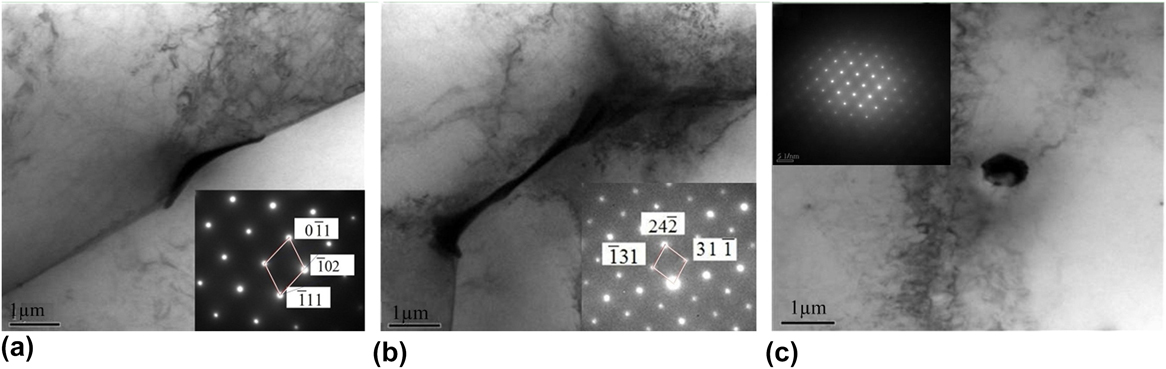
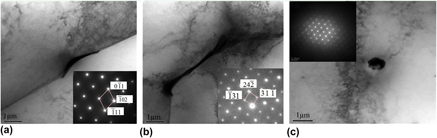
The XRD test results of the bottom layer and the top layer of the weld seam were shown in Fig. 7. It was indicated that MgZn2 phase was the main difference in phase composition between the bottom layer and the top layer. Two kinds of intergranular precipitates including the short rod-shaped particles and the strip-shaped particles were observed, the former were rarely found in the middle or top layer of the weld seam. The EDS test results of the short rod-shaped particles and the strip-shaped particles were shown in Figs. 8(a) and 8(b), respectively. The atomic content of Zn was about twice of Mg in the short rod-shaped particles, whereas it was only 0.34% in the strip-shaped particles. The micro morphology and TEM-SAD test result of the short rod-shaped particles and the strip-shaped particles were shown in Figs. 9(a) and 9(b), respectively. The rod-shaped particles were thus ascertained to be MgZn2 phase with hexagonal structure, whereas the strip-shaped particles were Al3Mg2 phase with face centered cubic structure. In addition, intragranular ellipsoidal MgZn2 particles were mainly found in the first weld pass as shown in Fig. 9(c). The patterns for the MgZn2 phase and Al3Mg2 phase were obtained along [211] zone axis and [110] zone axis, respectively. However, it was unsatisfactory that the density of the strengthening ellipsoidal MgZn2 particles might be moderate according to Fig. 9(c). In addition, in spite of the XRD test error, intergranular Al3Mg2 phase failed to get presented by the XRD test result because of its low composition proportion.
XRD test result of the bottom layer (a) and the top layer (b) of the weld seam.

The EDS test result of the intergranular short rod-shaped particles (a) and the strip-shaped particles (b) in the column grain zones.

The micro morphology and TEM-SAD test result of the short rod-shaped particles (a), the strip-shaped particle (b) and the intragranular ellipsoidal particles (c).

B. Mechanical properties of the weld seam
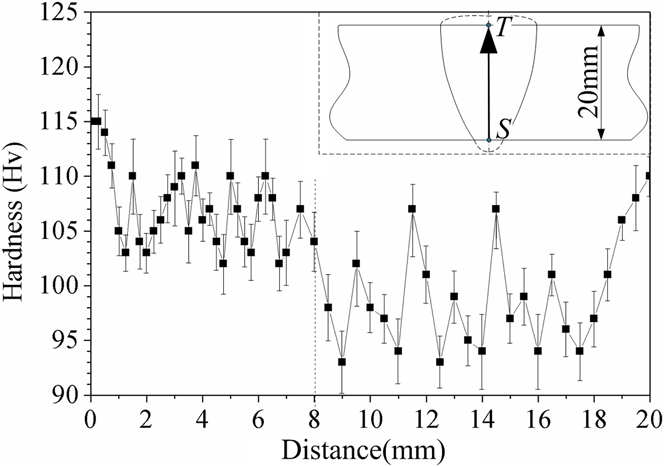
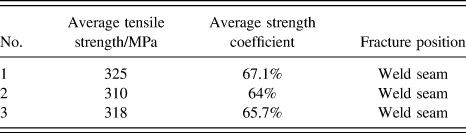
The micro hardness was measured from the bottom layer to the top layer along the symmetrical line (ST) in the cross section of the weld seam as shown in Fig. 10. The distance between neighboring measured points was over 50 μm so as to eliminate the effects of work hardening by the indenter during the test. The first weld pass exhibited the maximum average micro hardness of about 108 HV while the hardness of the other parts ranged from 90 HV to 106 HV as shown in Fig. 10. The tensile test result of samples from different layers of the weld seam was shown in Table III. It was indicated that the average tensile strength of the bottom layer was 4.8% and 2.1% higher than that of the middle layer and the top layer, respectively.
The hardness distribution along the symmetric line (ST) in the cross section of the weld seam.

The tensile test results of samples from different layers number as 1, 2 and 3, respectively.

C. About the inhomogeneity of the weld seam
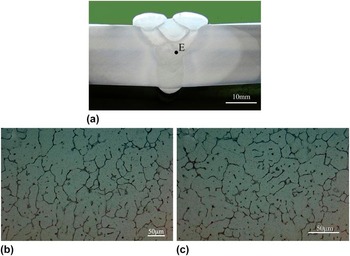
As shown in Fig. 11(b), the original microstructure of the outer edge in the third weld bead was equiaxed grain which got formed intermediately as the third weld pass got cooled down to room temperature. Then the original equiaxed grain got recrystallized and transformed to equilateral polygon as the following weld passes were implemented. It was indicated by Fig. 11(c) that multi-pass thermal cycling helped eliminate the difference in grain size and gave birth to intragranular precipitations. So, intragranular precipitations were the most remarkable character for the recrystallized zones and played the role of strengthening phases in the weld seam. As a result, the recrystallized zone should be characterized with higher hardness which corresponded well with the peaks in the hardness profile as shown in Fig. 10.
The macro morphology of the tested outer edge in the third weld bead and the obtained microstructure at different moments. (a) The identified macro morphology, (b) the original micro morphology of identified zone E as the third weld pass got cooled down to room temperature, (c) the final microstructure morphology of zone E as the subsequent weld passes got finished.

Figure 12 presented the typical micro fractography of the tensile samples from different layers. The fracture mode was demonstrated to be ductile fracture by the typical isometric dimples and ductile fracture particles in the bottom of the dimples. An obviously higher density of cone-shaped fractured particles was observed in the fractured surface of the bottom layer as compared with the other layers, as shown in Fig. 13. The particles should have experienced thorough ductile deformation before rupture and thus got deformed to be cone-shaped. So, the intragranular phase MgZn2 should be beneficial to the mechanical properties of the weld seam. The chemical composition of the cone-shaped particles became instructive because of the extraordinarily high atomic content of Zn and Mg as shown by the EDS test result in Fig. 12. According to the XRD and TEM test results, the cone-shaped fractured particles were ascertained to be the MgZn2 strengthening phase.
The EDS test result of cone shaped fractured particles.

The micro fractography of the tensile samples from different locations of the narrow gap MIG joint (a) location of number 1, (b) location of number 2, (c) location of number 3.

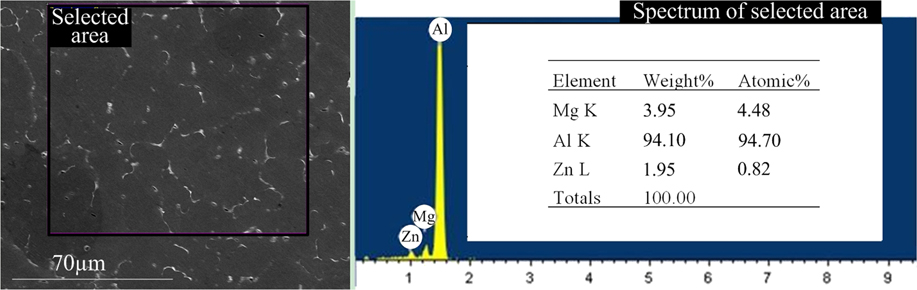
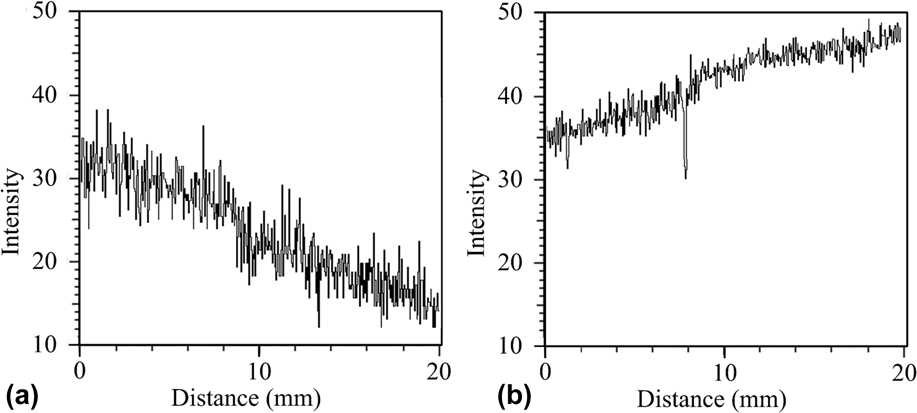
The large-area EDS test result of the bottom layer in Fig. 14 should be illuminating for revealing the formation mechanism of the MgZn2 strengthening phase. The general content of Zn was 1.95 wt% which was far greater than that in the filler metal. So the dilution effect of the base metal on the weld seam played the primary role in determining the chemical composition of the bottom layer of the weld seam. Figure 15 was the distribution of Zn and Mg along path ST obtained by EDS tests. The general content of Zn got decreased gradually from the bottom layer to the top layer of the joint, however, the general content of Mg got increased gradually, which gave birth to the difference of chemical composition in different layers. The imported Zn atoms had stronger affinity to Mg atoms than to Al atoms, which gave birth to the MgZn2 strengthening phase. As a result, the continuous distribution of Al2Mg3 phase was interrupted by the newly generated MgZn2 strengthening phase, so discontinuous precipitates was formed on the grain boundaries and improved the effect of boundary strengthening, which corresponded well with the microstructure morphology of different layers in the weld seam. So, the mechanical properties of the bottom layer were elevated by the improved boundary strengthening and the generation of intragranular precipitation strengthening. However, the average distance between the neighboring cone-shaped particles was over 10 μm, which resulted in a limited density of the particles and corresponded well with the TEM test result in Fig. 9(c). So, the precipitation strengthening effect was limited, which accounted for the inconspicuous elevation of the tensile strength of the bottom layer.
The general EDS test result of the center of the first weld seam.

The element distribution along path ST obtained by EDS tests. (a) The zinc element, (b) the magnesium element.

IV. CONCLUSIONS
After obtaining the joint of GMA welded thick Al–Zn–Mg alloy plates, the paper had presented a systematic investigation into the microstructural and mechanical inhomogeneity together with their corresponding relations in the weld seam. Conclusions were obtained as follows.
-
(1) On the one hand, both the average tensile strength and the micro hardness of the bottom layer were higher than those of the middle and the top layers of the weld seam. On the other hand, mechanical inhomogeneity could get explained by the peaks presented at specific zones in the micro hardness profile.
-
(2) The Zn atoms imported from the base metal to the weld seam through dilution gave birth to the intergranular rod-shaped MgZn2 particles and the intragranular ellipsoidal MgZn2 particles. The former interrupted the continuous intergranular distribution of Al2Mg3 phase and enhanced the intergranular strengthening, whereas the later played the role of precipitation strengthening. This was the formation mechanism of favorable mechanical performances for the bottom layer of the weld seam.
-
(3) Intragranular precipitates were generated in the recrystallized zone of the weld seam and accounted for the local micro hardness peaks in the micro hardness profile.
In addition, the weld strength factor was chasing after 70%. In order for better ways to improve the mechanical properties and the microstructure of the welded high-strength aluminum alloy, researchers appealed for quantitative evaluation of the precipitation strengthening and the boundary strengthening in the weld seam.
ACKNOWLEDGMENTS
This work was supported by Natural Scientific Research Innovation Foundation in Harbin Institute of Technology (Grant No. HIT.NSRIF.201703).