Introduction
One of the largest constraints to crop production is competition from weeds, which are responsible for approximately 30% annual reduction in crop productivity worldwide (Oerke Reference Oerke2006). Weeds that are related to domesticated crops can be particularly difficult to manage, as they share phenotypic and physiological similarities with the crop. This allows them to evade weed management, while still maintaining weedy traits that allow them to compete with their cultivated relatives (Ellstrand et al. Reference Ellstrand, Heredia, Leak-Garcia, Heraty, Burger, Yao, Nohzadeh-Malakshah and Ridley2010). Weedy rice (Oryza sativa f. spontanea Rosh.) is a conspecific relative of cultivated rice (Oryza sativa L.) that infests cultivated rice fields (Langevin et al. Reference Langevin, Clay and Grace1990). Weedy rice has likely been present in rice production since rice was first domesticated in Asia more than 8,000 yr ago (Wedger and Olsen Reference Wedger and Olsen2018), but it has become more problematic with the modern shift from traditional hand transplanting and hand weeding to direct-seeded cultivation and mechanized farming (Chauhan Reference Chauhan2013). Weedy rice is currently a pest in almost every rice-growing region in the world, including the United States (Londo and Schaal Reference Londo and Schaal2007), Italy (Fogliato et al. Reference Fogliato, Vidotto and Ferrero2011), South America (Merotto et al. Reference Merotto, Goulart, Nunes, Kalsing, Markus, Menezes and Wander2016), Asia (He et al. Reference He, Kim and Park2017; Qiu et al. Reference Qiu, Zhu, Fu, Ye, Wang, Mao, Lin, Chen, Zhang, Guo, Qiang, Lu and Fan2014; Sun et al. Reference Sun, Qian, Ma, Xu, Liu, Du and Chen2013), and Africa (Federici et al. Reference Federici, Vaughan, Tomooka, Kaga, Wang, Doi, Francis, Zorrilla and Saldain2001). Weedy rice biotypes vary in different regions, but are typically characterized by red pericarp, high seed shattering, and high seed dormancy (Noldin et al. Reference Noldin, Chandler and McCauley1999). Weedy rice in the southern United States can reduce the yield of the cultivated rice it competes with by up to 80% (Estorninos et al. Reference Estorninos, Gealy, Gbur, Talbert and McClelland2005) and reduces the milling and cooking quality of white rice due to contamination with seeds with red pericarp (Shivrain et al. Reference Shivrain, Burgos, Gealy, Smith, Scott, Mauromoustakos and Black2009; Singh et al. Reference Singh, Burgos, Singh, Gealy, Gbur and Caicedo2017a).
In the United States, rice is primarily produced in the Mississippi River delta in the southern United States and the Sacramento Valley of California. In the southern United States, weedy rice has been a persistent problem since its introduction with cultivated rice in the late 17th century (Delouche et al. Reference Delouche, Burgos, Gealy, de San Martin, Labrada, Larinde and Rosell2007), and two major phenotypic variants, ‘blackhull awned’ and ‘strawhull awnless’, are pests of rice in the region (Londo and Schaal Reference Londo and Schaal2007; Vaughan et al. Reference Vaughan, Ottis, Prazak-Havey, Sneller, Chandler and Park2001). In California, weedy rice was identified shortly after the beginning of commercial rice production in the early 20th century and was believed to have been transported with contaminated seed from the southern United States (Bellue Reference Bellue1932). Adoption of a continuously flooded system and use of certified seed in California allowed for presumed eradication of weedy rice from the state in the 1950s (Miller and Brandon Reference Miller and Brandon1979). After several decades of no weedy rice being detected in California, a single biotype of weedy red rice was identified in a rice field in 2003 (Londo and Schaal Reference Londo and Schaal2007). Studies of California weedy rice collected in 2008 described all samples as strawhull awned (Kanapeckas et al. Reference Kanapeckas, Vigueira, Ortiz, Gettler, Burgos and Fischer2016, Reference Kanapeckas, Tseng, Vigueira, Ortiz, Bridges, Burgos, Fischer and Lawton-Rauh2017). Weedy rice consisting of several phenotypically and genetically distinct biotypes (De Leon et al. Reference De Leon, Karn, Al-Khatib, Espino, Blank, Andaya, Andaya and Brim-DeForest2019) has since been identified infesting more than 130 fields and 5,600 ha in California as of 2018 (L Espino, personal communication, August 4, 2019). The recent rapid increase in reports of diverse weedy rice in California calls for new studies examining the biology of California weedy rice and identification of traits that could be exploited for managing weedy rice infestations.
Weedy rice around the world has diverse origins, arising from either wild rice, “de-domesticated” cultivated rice, or hybridization from multiple sources, followed by adaptation to local environments (Ellstrand et al. Reference Ellstrand, Heredia, Leak-Garcia, Heraty, Burger, Yao, Nohzadeh-Malakshah and Ridley2010; Gressel Reference Gressel2005). While populations have distinct phenotypic and biological traits, the majority of weedy rice biotypes have a red pericarp, high seed shattering and dormancy, high tillering, tall growth, and pubescent leaves (Gealy Reference Gealy2005; Huang et al. Reference Huang, Young, Reagon, Hyma, Olsen, Jia and Caicedo2017; Noldin et al. Reference Noldin, Chandler and McCauley1999). Genetic and physiological studies have shown that these shared traits may be derived from ancestral wild rice or in some cases derived independently in weedy lineages (Huang et al. Reference Huang, Kelly, Matsuo, Li, Li, Olsen, Jia and Caicedo2018; Qi et al. Reference Qi, Liu, Vigueira, Young, Caicedo, Jia, Gealy and Olsen2015; Thurber et al. Reference Thurber, Jia, Jia and Caicedo2013). Studies focused on weedy rice have identified diversity among weedy biotypes with varying growth and reproductive traits such as growth rate, tiller number, plant architecture, and flowering time (Estorninos et al. Reference Estorninos, Gealy, Gbur, Talbert and McClelland2005; Gealy et al. Reference Gealy, Yan and Rutger2006; Noldin et al. Reference Noldin, Chandler and McCauley1999; Shivrain et al. Reference Shivrain, Burgos, Scott, Gbur, Estorninos and McClelland2010). Weedy rice has considerable variation between biotypes in pigmentation in the hull and leaf sheath, ligule, and collar (Gealy Reference Gealy2005; Noldin et al. Reference Noldin, Chandler and McCauley1999), and not all weedy rice biotypes have the red pericarp trait the weed is often named for (Gross et al. Reference Gross, Reagon, Hsu, Caicedo, Jia and Olsen2010; Ziska et al. Reference Ziska, Gealy, Burgos, Caicedo, Gressel, Lawton-Rauh, Avila, Theisen, Norsworthy, Ferroro, Vidotto, Johnson, Ferreira, Marchesan and Menezes2015). While most weedy rice biotypes have high seed shattering and seed dormancy, a small number of biotypes are nondormant and non-shattering, similar to cultivated rice (Noldin et al. Reference Noldin, Chandler and McCauley1999; Tseng et al. Reference Tseng, Burgos, Shivrain, Alcober and Mauromoustakos2013, Reference Tseng, Shivrain, Lawton-Rauh and Burgos2018). Variation in seed dormancy may aid in reinforcing population structure between weedy rice biotypes, while sometimes allowing for overlapping flowering and thus gene flow with cultivated rice (Tseng et al. Reference Tseng, Shivrain, Lawton-Rauh and Burgos2018). Weedy rice biotypes also vary considerably in their competitive ability and impact on cultivated rice yield (Dai et al. Reference Dai, Dai, Song, Lu and Qiang2013; Estorninos et al. Reference Estorninos, Gealy, Gbur, Talbert and McClelland2005). Variation in seed size, timing of seedling emergence, plant height, shoot biomass, time to flowering, and time to maturation all affect weedy rice’s ability to compete with cultivated rice (Chauhan and Johnson Reference Chauhan and Johnson2010; Gealy et al. Reference Gealy, Saldain and Talbert2000; Shivrain et al. Reference Shivrain, Burgos, Scott, Gbur, Estorninos and McClelland2010; Zhao et al. Reference Zhao, Xu, Song, Dai, Dai, Zhang and Qiang2017).
The close relationship of weedy rice and cultivated rice makes management of weedy rice infestations difficult. In the vegetative stages, weedy rice has phenotypic similarity to cultivated rice varieties, making it difficult to visually identify or remove weedy rice early in the growing season. Physiological similarities eliminate the possibility of selective chemical weed control methods to control weedy rice in cultivated rice fields. In some rice-growing systems, cultivated rice varieties bred to be resistant to imidazolinone or quizalofop herbicides allow for use of these herbicides during the growing season to control weedy rice, which is not naturally resistant to these herbicides (Burgos et al. Reference Burgos, Norsworthy, Scott and Smith2008; Lancaster et al. Reference Lancaster, Norsworthy and Scott2018; Tan et al. Reference Tan, Evans, Dahmer, Singh and Shaner2005). No herbicide-resistant rice varieties are currently grown in California, and while oxyfluorfen-resistant varieties are currently being developed for California (McKenzie Reference McKenzie2017), it is not yet clear whether this will be a tool in managing weedy rice. Before the recent rediscovery of weedy rice in the region, it was believed that a continuous-flood system like that used in California rice agriculture was effective in preventing establishment of weedy rice seedlings (Miller and Brandon Reference Miller and Brandon1979). However, this has not prevented the appearance of current populations of weedy rice. Management of weed seedbanks and prevention of further seed introductions and spread through cultural practices such as using a stale seedbed, planting clean seed, or fallowing have been recommended to help reduce the magnitude of infestations in following growing seasons (UCCE 2017). However, in-season control of weedy rice remains difficult. Identification of weedy rice plants before they produce a seed head is critical so they can be removed from the field before seed shatters. By the time weedy rice plants are mature and identifiable as the weed, it may be too late to prevent their spread in the field. Even after a seed head is present, identification of weedy rice can be challenging. Seed heads of some weedy rice biotypes can appear similar to cultivated rice, but not all weedy rice looks the same, and the variation present in California weedy rice biotypes has not been previously studied. Identification of biological and phenotypic traits that differentiate cultivated and weedy rice may make it possible to identify weedy rice at early stages. This could allow growers to correctly identify weedy rice and make management decisions earlier in the growing season, including rogueing or spot treatment of small weedy rice infestations.
This study investigated the phenotypic variation between California weedy rice biotypes and other weedy rice biotypes from the southern United States, wild rice, and cultivated rice varieties in order to identify phenotypic traits that could be used to differentiate California weedy rice from cultivated rice varieties for early detection and management of weedy rice. Specifically, we examined the variation in phenotypic traits related to pigmentation, growth, and reproduction of 61 weedy rice, cultivated rice, and wild rice biotypes, including 37 California weedy rice accessions. We employed principal component analysis and factor analysis to identify biological differences that could be used to identify and manage California weedy rice.
Materials and Methods
Plant Materials
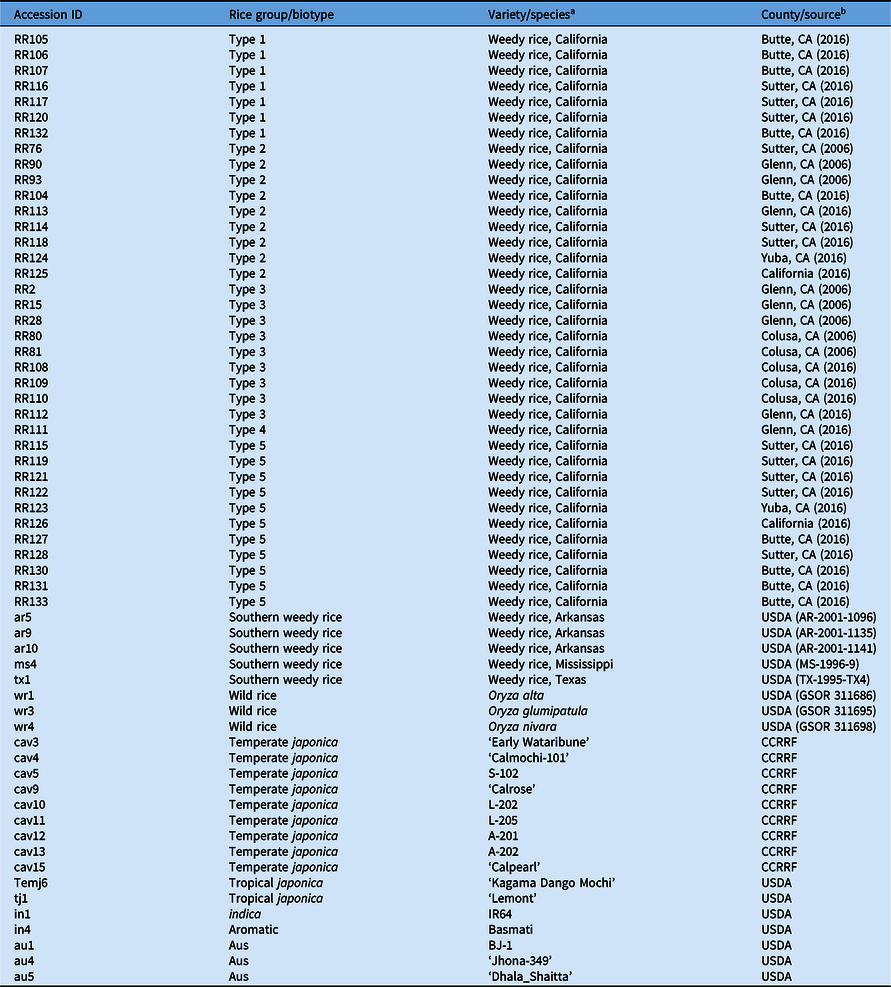
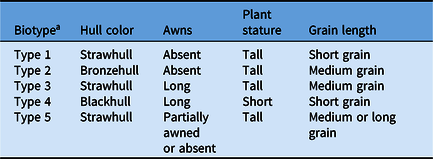
Weedy, wild, and cultivated rice accessions selected for analysis totaled 61 accessions, representing 12 rice groups (Table 1). Of the 61 accessions, 37 weedy rice accessions were included from California representing 5 biotypes, including 8 accessions collected in 2006 and 29 accessions collected in 2016. Accessions were obtained from growers’ rice fields in Glenn, Colusa, Butte, Yuba, and Sutter counties in the northern Sacramento Valley region of California. The five biotypes of California weedy rice used in this study are characterized by genetic differences (De Leon et al. Reference De Leon, Karn, Al-Khatib, Espino, Blank, Andaya, Andaya and Brim-DeForest2019), which correspond with observed differences in hull color, presence of awns, plant stature, and grain size (Table 2). To enable comparison with other weedy and wild rice, we included 5 weedy rice accessions from the southern United States (Arkansas, Mississippi, and Texas) and 3 wild rice species. We also included a total of 16 cultivated rice accessions: 9 temperate japonica varieties grown in California, 2 tropical japonica varieties, 1 indica variety, 1 aromatic variety, and 3 aus varieties.
List of rice accessions used, rice group, variety or species name, and source of rice accession.

General overview of five weedy rice biotypes found in California.

a Biotypes can be distinguished by differences in hull color, presence of awns, plant stature, and grain length.
Phenotypic Measurements
Experiments were conducted in a greenhouse at the Rice Experiment Station in Biggs, CA, arranged in a randomized complete block design, with five plants per block and two replications in time completed in 2017 and 2018. For each of the 61 rice accessions, five seeds were placed in a 4-L pot and grown in a greenhouse set at 33/17 ± 5 C temperature and 33%/84% ± 10% day/night relative humidity and ambient light. Pots were kept at water saturation and fertilized as needed. Plants were grown until harvest at maturity.
Morphological descriptors and numerical phenotype evaluation scales were modified from the standard evaluation system for rice from the International Rice Research Institute (IRRI 2002), except where otherwise noted. During the tillering stage, at 7 wk after planting, chlorophyll content was measured at the middle of the second-youngest leaf using a SPAD meter (Konica Minolta, Osaka, Japan). Plants were scored for leaf pubescence visually with a magnifying glass on a scale from 1 to 4, with 1 being smooth and 4 being fully pubescent. The color of the leaf sheath, collar, and ligule were each scored on a scale from 1 to 3, with 1 being green, 2 being greenish-purple, and 3 being purple. All leaf characteristics were measured during the tillering stage. Heading date was measured as the number of days from planting to panicle emergence from the boot by 2 to 4 cm. Plant height was measured at 92 d after planting, at the start of the heading stage. Height was measured following the method of Yoshida (Reference Yoshida1981), as the height from the base of the culm to the tip of tallest leaf. At 35 d after flowering, when grains were mature and had approximately 14% water content, panicles were harvested for seed phenotype measurements. Awn length of plants was recorded on a scale from 1 to 4, with 1 being absent or less than 1 cm in length, 2 being 1 to 2 cm, 3 being 2 to 4 cm, and 4 being more than 4 cm in length. Hull color was measured on a scale from 1 to 4, with 1 being straw, 2 being gold, 3 being bronze, and 4 being black. Pericarp color was measured on a scale from 1 to 3, with 1 being white to 3 being purple. Grain length was measured on a scale from 1 to 3, with 1 being short grain (<5.5 mm), 2 being medium grain (5.5 to 6.6 mm) and 3 being long grain (>6.6 mm). Seed shattering was evaluated in five panicles from each plant using a digital force gauge (IMADA, Northbrook, IL, USA) to measure the force needed to break each of five grains from each panicle. For seed dormancy evaluations, 20 seeds from a single panicle of three plants per collection were placed in a wet paper towel and incubated at 30 C. The number of seeds that had germinated after 7 d of incubation was recorded. While a small number of seeds may take longer to germinate than the 7 d measured in this experiment, 7 d was determined to be enough time to conclude whether accessions were dormant or nondormant relative to cultivated rice. Other dormancy testing with these same accessions showed that extending the experiment to 14 d did not substantially change the conclusions drawn about seed dormancy (unpublished data).
Data Analysis
Initial data analysis was conducted using R software v. 3.6.0 (R Development Core Team 2019). Data for each variable were tested for data normality and for equality of data variance between rice groups and between years. For quantitative variables, logarithmic transformation was applied when data failed to meet normality. For heading date, there was a significant difference between 2017 and 2018 heading dates, so a linear model was used to transform data before further analysis. For data that were transformed, nontransformed (raw) means are reported with nontransformed standard errors.
A principal component analysis (PCA) was performed using the PROC PRINQUAL in SAS v. 9.4 (SAS Institute 2018) to examine the structure of phenotypic variation among individuals and groups. For the 0.4% of data points that were missing, values were imputed based on trait mean value and variance for each rice group. A monotonic transformation was used for ordinal qualitative variables, and then a PCA with maximum total variance was performed on the combined quantitative and transformed qualitative variable correlation matrices.
Phenotypic differences between rice groups for the quantitative variables of plant height, days to heading, leaf chlorophyll content, seed tensile breaking strength, and germination rate after 7 d incubation, were determined using a one-way ANOVA with significance of differences between rice groups determined by a Tukey test in R. Differences between rice groups for the ordinal variables of awn length, grain length, pericarp color, hull color, leaf pubescence, leaf collar color, leaf sheath color, and ligule color were determined using a nonparametric Kruskal-Wallis test with significance of differences between rice groups determined by a Mann-Whitney-Wilcoxon test in R.
We conducted a factor analysis of all phenotypic traits to determine which traits best explain the observed variation in rice samples. First, missing data were imputed based on trait mean value and variance for each rice group. Then, a correlation matrix of all phenotypic variables was constructed using the hetcor function in the psych package in R, allowing for a combination of continuous, binary, and ordinal data (Revelle Reference Revelle2018). All quantitative variables were coded as continuous factors, variables with two states were coded as factors with two levels, and variables with multiple states were coded as ordinal factors with three or four levels. Factor analysis was completed with the maximum-likelihood method and varimax rotation. To determine which measured traits were most correlated with rice group and with being a weed (weediness), factor extension analysis was conducted with a maximum-likelihood method and varimax rotation. Phenotypic traits were clustered by correlation into factors that were then extended by correlation to the two demographic traits of rice group and weediness. Weediness here is defined as not being cultivated rice. Pericarp color was excluded from the factor extension analysis, because it correlated too closely with weediness, and all weedy rice plants in this study had a red pericarp.
Results and Discussion
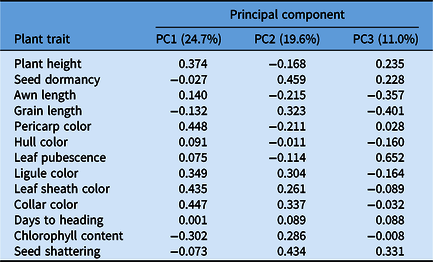
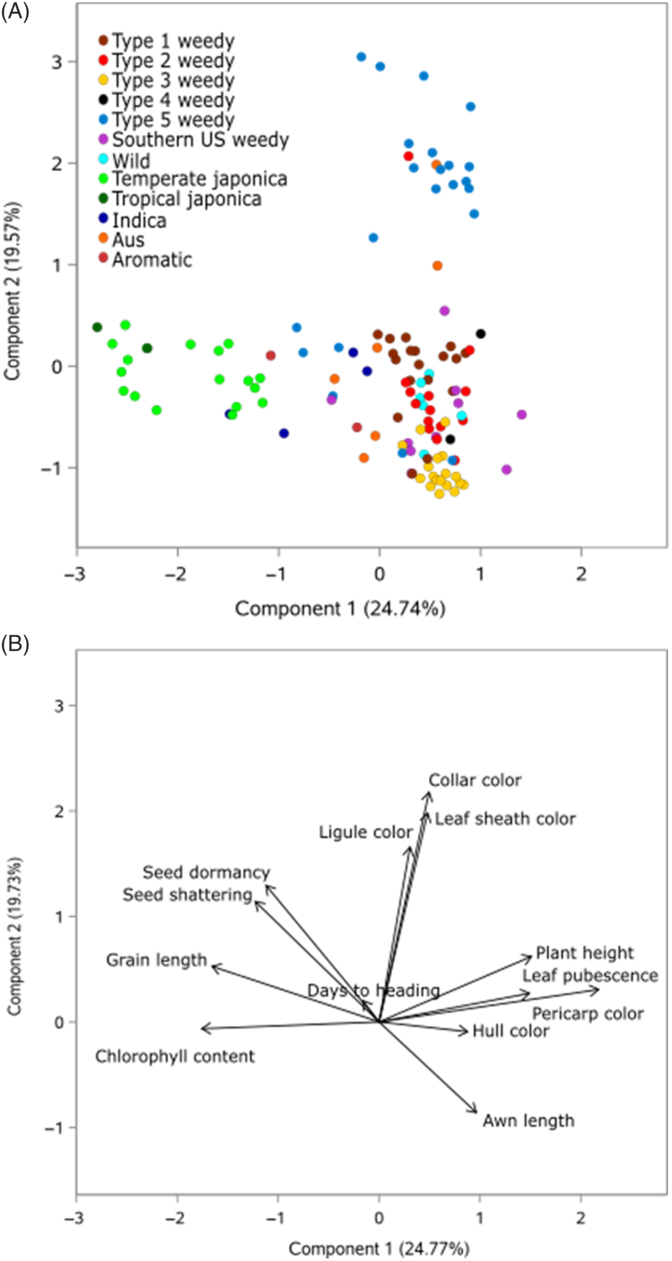
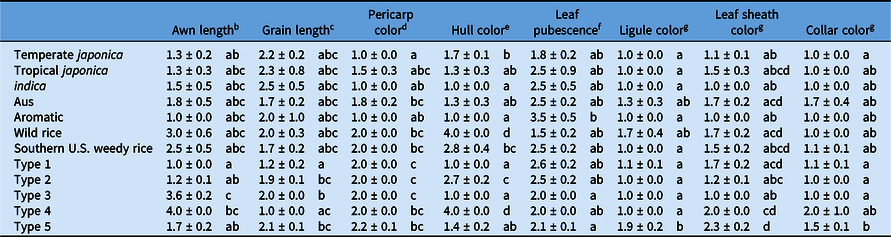
The 61 rice accessions representing 12 groups of rice showed variation in phenotype for all 13 measured traits. PCA was conducted to determine whether rice accessions within rice groups were most similar to each other based on overall phenotype and thus form cohesive groups. The first three principal components (PCs) accounted for 58.9% of the observed phenotypic variation among accessions. PC1 was predominantly composed of pericarp color, hull color, chlorophyll content, grain length (short-, medium-, or long-grain rice), plant height, and leaf pubescence, and accounted for 28.22% of the observed variation (Table 3). PC2 was predominantly composed of leaf sheath color, ligule color, and collar color, and accounted for 19.54% of the observed variation, while PC3 was predominantly composed of leaf pubescence and awn length, and accounted for 11.16% of the variation (Table 3). When rice accessions were plotted onto the first two PCs, most accessions clustered approximately by rice group (Figure 1A). The temperate japonica, tropical japonica, and indica groups were well separated on PC1 from all other groups (Figure 1). These groups tended to have shorter plants, with higher chlorophyll content, and lighter hull and pericarp colors (Table 4; Figure 2). On PC2, many Type 5 weedy rice accessions, aus rice, and one Type 2 accession were well differentiated from the other rice groups (Figure 1). These accessions generally had reddish or purplish leaf sheaths, ligules, and collars (Table 4). Accessions of some groups clustered tightly together by group, such as Type 1, Type 2, and Type 3 weedy rice, indicating that these groups are relatively cohesive with little phenotypic variation within each group (Figure 1). In contrast, Type 5 weedy rice, southern U.S. weedy rice, and temperate japonica rice groups contained a higher level of within-group variation and did not cluster tightly together.
Eigenvector values of measured phenotypic traits for the first three principal components from principal component analysis.a

a The first three principal components account for 55.3% of the total observed variation.
Rice individual clustering (A) and eigenvectors of plant traits (B) for the first two components from principal component analysis of 13 phenotypic traits. Length and direction of vectors indicates the strength and direction of the correlation between specific traits and the principal components.

Average measured value and standard error of the qualitative phenotypic traits of rice groups.a

a Letters indicate significant differences (P < 0.05) between groups.
b Awn length: 1 = 0–1 cm, 2 = 1–2 cm, 3 = 2–4 cm, 4 = >4 cm.
c Grain length: 1 = short grain (>5.5mm), 2 = medium grain (5.5–6.6 mm), 3 = long grain (>6.6 mm).
d Pericarp color: 1 = white, 2 = red, 3 = purple.
e Hull color: 1 = straw, 2 = gold, 3 = bronze, 4 = black.
f Leaf pubescence: 1 = smooth, 2 = slightly pubescent, 3 = moderately pubescent, 4 = very pubescent.
g Ligule color, leaf sheath color, and collar color: 1 = green, 2 = greenish-purple, 3 = purple.
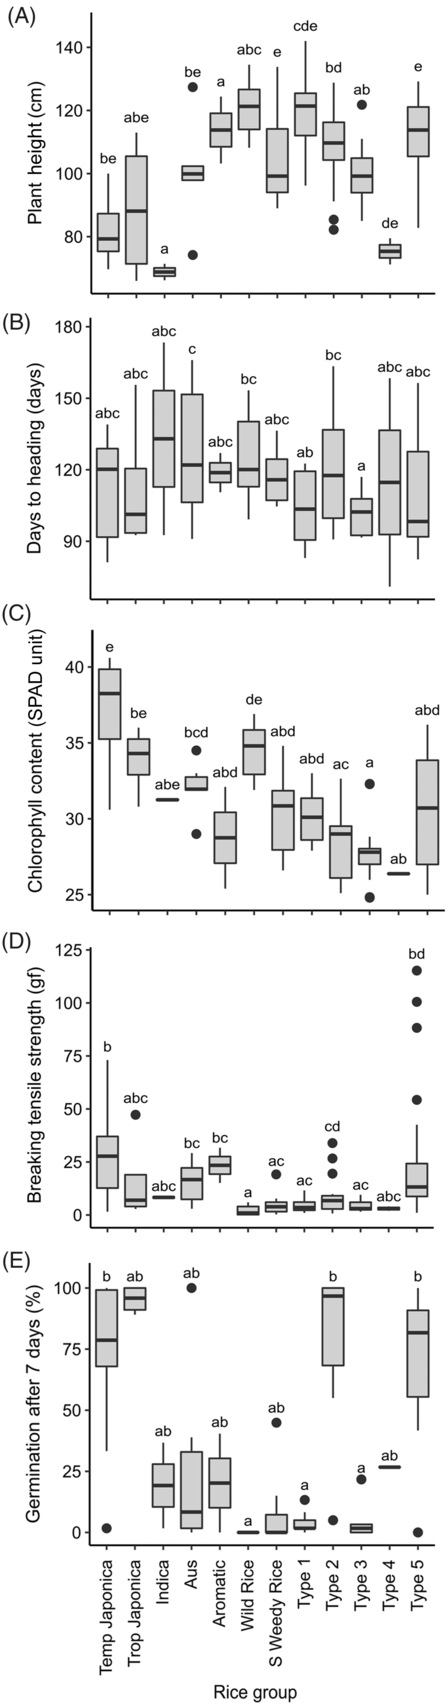
Rice biotype average measurements for plant height (A), days to heading stage (B), leaf chlorophyll content (C), seed shattering (breaking tensile strength) (D), and seed dormancy (% germination after 7 d) (E). Letters indicate significant differences between rice biotypes. Temp Japonica, temperate japonica; Trop Japonica, tropical japonica; S Weedy Rice, U.S. southern weedy rice; gf, gram-force.

For all phenotypic traits, differences were significant between at least two rice groups (Table 4). Some traits, such as ligule color and collar color, were relatively less variable within rice groups (Table 4), while traits like days to heading showed high variation within rice groups and smaller differences between rice groups (Figure 2B). Leaf pubescence varied only slightly between rice groups, with the exception of the basmati aromatic rice, which had highly pubescent leaves (Table 4). In general, rice groups that are considered weedy or wild tended to have darker color in seed pericarps and hulls; reddish or purplish color on leaf sheaths, ligules, and collars; and longer awns on seeds (Table 4). However, the aus rice variety ‘BJ-1’ also had purple leaf collars and sheaths, and the tropical japonica rice variety ‘Lemont’ had reddish leaf sheaths. Because of the small number of accessions representing some rice groups, standard errors were quite high for phenotypic measurements in these rice groups (Table 4), and so this study may not fully capture all variations and differences that exist between these groups. This is especially true for Type 4 weedy rice, which was collected from a single rice field in California. California weedy rice biotypes show phenotypes commonly associated with weedy rice. All weedy rice biotypes in this study have the characteristic red pericarp that weedy rice, or red rice, is often named for (Table 4). Type 1, Type 3, and Type 5 weedy rice plants mostly have light colored hulls (Table 4) similar to that of the ‘strawhull’ weedy rice of the southern United States (Shivrain et al. Reference Shivrain, Burgos, Scott, Gbur, Estorninos and McClelland2010). Type 2 weedy rice has a ‘bronzehull’ phenotype, which is reddish or brownish, while Type 4 weedy rice is ‘blackhull’ (Table 4). Weedy rice is commonly associated with high seed shattering and dormancy. However, California weedy rice biotypes vary in their seed shattering and seed dormancy traits. Weedy rice biotypes 1, 2, 3, and 4 had high seed shattering, as indicated by the low amount of force needed to break a seed from the panicle (0 to 8.9 gram-force), although some Type 2 individuals required up to 33.9 gram-force to break a seed from the panicle (Figure 2D). High seed shattering was also observed in wild rice species and in the weedy rice accessions from the southern United States. In contrast, Type 5 weedy rice showed high variation in breaking strength, ranging from 1.1 to 115.3 gram-force, and was not significantly different from cultivated rice groups (Figure 2D). Type 1, Type 3, and Type 4 weedy rice had high rates of dormancy, with 3.7% to 26.7% of seeds germinating in 7 d, similar to wild rice species and southern U.S. weedy rice (Figure 2E). Type 2 and Type 5 weedy rice had high germination rates of 80.0% and 70.6%, respectively, indicating low seed dormancy (Figure 2E). The reason for the lack of seed dormancy or shattering in Type 2 and Type 5 weedy rice is not entirely clear, as these traits are commonly associated with weedy rice (Noldin et al. Reference Noldin, Chandler and McCauley1999; Tseng et al. Reference Tseng, Burgos, Shivrain, Alcober and Mauromoustakos2013). Lack of shattering or dormancy, or high variation like that seen for shattering in Type 5 weedy rice, may indicate a more recent origin from or hybridization with cultivated rice, which has prevented or delayed the evolution of these traits. Studies have indicated that hybridization of weedy and cultivated rice can result in weedy rice accessions with low or variable seed dormancy and shattering (Burgos et al. Reference Burgos, Singh, Tseng, Black, Young, Huang, Hyma, Gealy and Caicedo2014; Singh et al. Reference Singh, Singh, Black, Boyett, Basu, Gealy, Gbur, Pereira, Scott, Caicedo and Burgos2017b). Management of weedy rice biotypes with seed dormancy and shattering likely requires long-term strategies, as plants will reseed in the same area of the field, and seed can remain dormant for up to 10 yr (Goss and Brown Reference Goss and Brown1939).
Some phenotypic traits could be used to differentiate California weedy rice from the temperate japonica cultivars most commonly grown in the region. While the appearance of red-pericarped grains in a field of a white-pericarped rice variety is an obvious indicator of a weedy rice infestation, it is not apparent until late in the growing season and cannot be used as a marker for early detection. However, other differences between weedy rice and cultivated rice appear before seed set and could allow growers to identify plants with these traits and make management decisions earlier in the growing season. All weedy rice biotypes had lower chlorophyll content in their leaves than temperate japonica rice at 7 wk after planting, with weedy rice biotypes averaging from 26.4 to 30.6 SPAD units compared with 37.2 SPAD units in temperate japonica accessions (Figure 2C). These plants are visually less green and slightly more yellowish in appearance than cultivated rice, similar to weedy rice observed in other studies (Noldin et al. Reference Noldin, Chandler and McCauley1999; Shivrain et al. Reference Shivrain, Burgos, Moldenhauer, McNew and Baldwin2006). All weedy rice biotypes except for Type 4 are significantly taller than temperate japonica cultivars at 92 d after planting (Figure 2A). Differences in height between California weedy rice and temperate japonica cultivars become significant as soon as 2 wk after planting (unpublished data). Differences between temperate japonica rice and California weedy rice biotypes were significant for some biotypes for leaf pubescence, leaf sheath color, ligule color, and collar color (Table 4). Leaf pubescence has been suggested previously as a marker for weedy rice (Gealy et al. Reference Gealy, Mitten and Rutger2003), as most biotypes in the southern United States have been characterized as having pubescent leaves (Noldin et al. Reference Noldin, Chandler and McCauley1999; Shivrain et al. Reference Shivrain, Burgos, Moldenhauer, McNew and Baldwin2006). However, while all weedy rice biotypes in this study were slightly to moderately pubescent, some California weedy rice biotypes are not significantly different from pubescent cultivars (Table 4). Similarly, red or purple leaf sheath color, collar color, and ligule color have been frequently observed in weedy rice biotypes (Kanapeckas et al. Reference Kanapeckas, Tseng, Vigueira, Ortiz, Bridges, Burgos, Fischer and Lawton-Rauh2017; Noldin et al. Reference Noldin, Chandler and McCauley1999). However, these traits were sometimes variable within weedy biotypes and were not uniform across biotypes (Table 4), and so may not always be helpful in identifying weedy rice. Rather, the presence of especially tall rice that appears less green than the surrounding rice in a field could be a useful indicator of a possible weedy rice infestation. The difference in height would not work to identify Type 4 weedy rice, which is similar in height to temperate japonica rice, but Type 4 is currently less commonly found than the other weedy biotypes.
Previous studies of California Type 3 weedy rice collected from four fields in 2008 indicated several traits differentiating California weedy rice and temperate japonica rice, including pigmented pericarp, presence of awns, tall plant height, high number of tillers, and panicle architecture traits (Kanapeckas et al. Reference Kanapeckas, Vigueira, Ortiz, Gettler, Burgos and Fischer2016, Reference Kanapeckas, Tseng, Vigueira, Ortiz, Bridges, Burgos, Fischer and Lawton-Rauh2017). Delayed and protracted period of flowering was also indicated in these studies. While the current study did not measure the length of the flowering period, heading date was highly variable and not significantly different from temperate japonica cultivars. This may be due to differences in experimental conditions or differences in the genetic background of the more recently collected accessions.
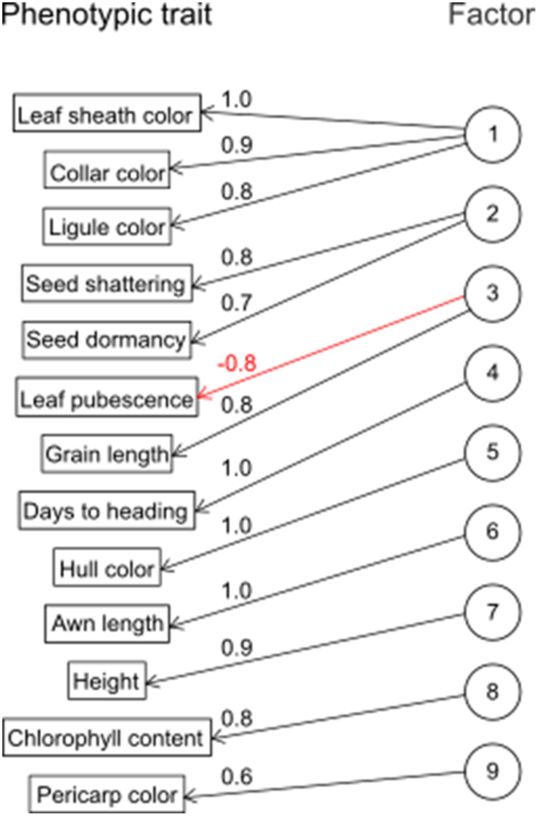
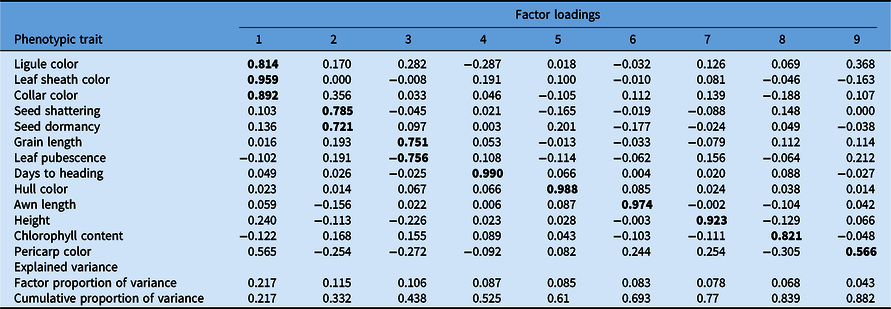
Factor analysis was conducted to determine which phenotypic traits were most useful in differentiating rice groups. Initial factor analysis of phenotypic traits indicated that variation in several of the traits measured in this study were correlated with each other and can thus be clustered into a smaller number of phenotypic factors (Figure 3; Table 5). Nine factors were extracted, as nine factors produced the simplest model that had a minimum root mean-square residual score (0.04) with maximum fit based on off-diagonal values (0.99). The first three factors accounted for 21.7%, 11.5%, and 10.6% of the observed phenotypic variation present in the rice samples (Table 5). The first factor was largely composed of leaf sheath color, ligule color, and collar color, as these traits were highly correlated with one another. The second factor was largely composed of seed shattering and seed dormancy, which are highly correlated with each other. The third factor was largely composed of leaf pubescence and grain length, which have a highly negative correlation with each other. The remaining factors were dominated by correlation with a single trait, indicating that the phenotypic variation represented by those traits is largely independent of other traits.
Plot of factor analysis showing clustering of correlated phenotypic traits into nine factors. Numbers on arrows indicate strength of correlation with the nine factors. Black indicates positive correlation and red indicates negative correlation. The factors are numbered in order from most phenotypic variance (Factor 1) to least phenotypic variance (Factor 9) explained by that factor.

Factor loadings of 13 phenotypic traits used in factor analysis, and the proportion of variation explained by each factor.a

a Values indicate the strength of correlation between a phenotypic trait and a factor, with positive values indicating positive correlation and negative values indicating negative correlation. Values in bold indicate the factor that each trait is most highly correlated with. The factors are numbered 1 to 9 in decreasing order of the proportion of phenotypic variance that they represent.
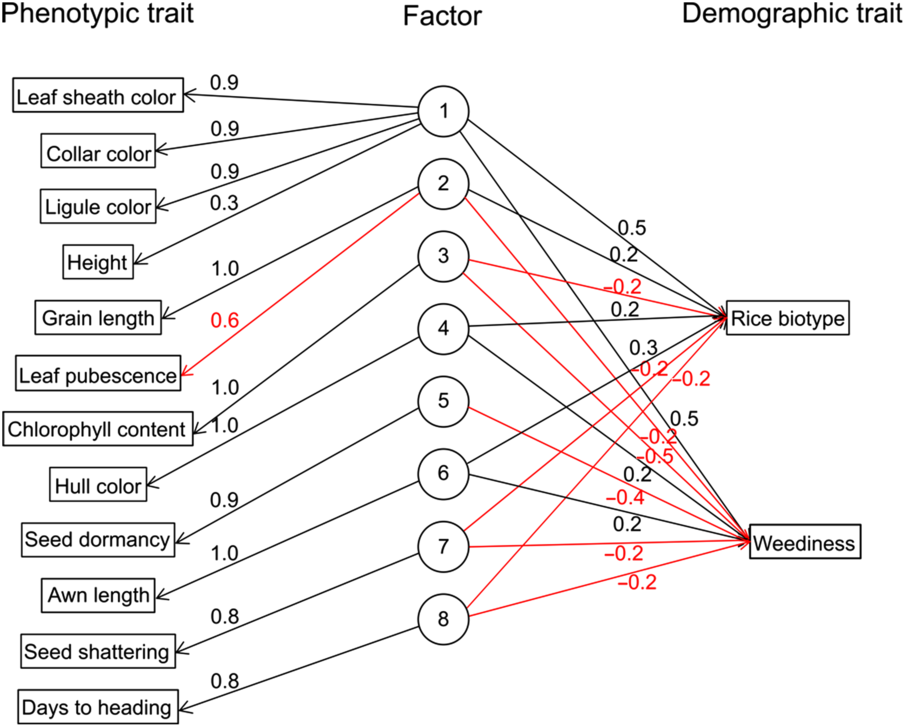
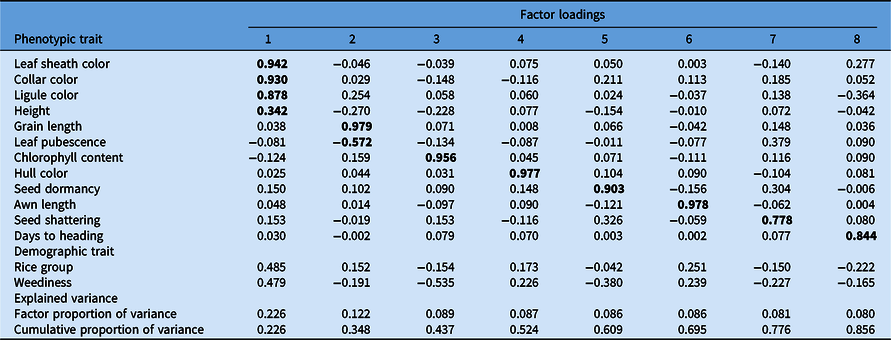
To determine which of these traits are most closely related to differences between rice groups and between weedy versus non-weedy rice accessions, we next conducted a factor extension analysis, in which a set of measured traits are clustered by correlation into factors that are then correlated with a different set of traits. Here, the phenotypic traits were clustered into eight factors that were extended to correlate with the demographic traits of rice group and weediness (Figure 4; Table 6), with a root mean-square residual of 0.03 and an off-diagonal fit of 0.99. The pericarp color trait was excluded from factor extension analysis, because it correlated too closely with weediness, as all weedy rice plants had red pericarp. The first three factors account for 22.6%, 12.2%, and 8.9% of the observed phenotypic variance (Table 6). Most of the same phenotypic traits were clustered together as in the original factor analysis. For instance, Factor 1 includes the correlated traits of leaf sheath color, collar color, and ligule color, with the addition of plant height. This factor correlates well with both rice group and weediness, indicating that variation in these traits explains a large portion of the phenotypic difference between rice groups and between weeds and non-weeds. The strongest factor indicators of weediness were based on leaf sheath, collar, and ligule colors; plant height; and chlorophyll content. The factor composed primarily of seed dormancy also correlated moderately with weediness. Thus, a rice plant that is tall with low chlorophyll content and that has red or purple leaf sheaths, collars, or ligules is likely weedy rice. These plants may also have dormant seeds. Factor extension analysis also indicated phenotypic traits that were not very informative in identifying weedy rice. The factor composed primarily of grain length and leaf pubescence was weakly correlated with weediness, but leaf pubescence was only moderately negatively correlated with this factor (Figure 4). Although many weedy rice biotypes do have pubescent leaves, this weak correlation may be due to variability in leaf pubescence between weedy biotypes and among cultivars. Seed shattering is commonly associated with weedy rice in other rice-growing regions, and so might be expected to be an indicator of weediness. However, as Type 2 and Type 5 weedy rice showed variable breaking tensile strength (Figure 2), seed shattering was not identified as a good indicator of weediness for California weedy rice. This highlights a shortcoming of current definitions of weedy rice, as weedy rice populations are very diverse, and it is unclear whether rice that does not have all of the commonly applied diagnostic traits of weedy rice, such as red pericarp, seed dormancy, seed shattering, tall plant height, or pale leaves would be considered weedy rice.
Factor extension plot showing phenotypic traits clustered into eight factors and then correlated with the demographic traits rice biotype and weediness. Numbers on arrows indicate strength of correlation with the factors. Black indicates positive correlation and red indicates negative correlation. The factors are numbered in order from most phenotypic variance (Factor 1) to least phenotypic variance (Factor 8) explained by that factor.

Factor loadings of 12 phenotypic traits used in factor extension analysis and two demographic traits of rice group and weediness, and the proportion of variation explained by each factor.a

a Pericarp color was excluded from factor extension analysis because it correlated too highly with weediness. Values indicate the strength of correlation between a phenotypic or demographic trait and a factor, with positive values indicating positive correlation and negative values indicating negative correlation. Values in bold indicate the factor that each trait is most highly correlated with. The factors are numbered 1 to 9 in decreasing order of the proportion of phenotypic variance that they represent.
A previous study of Type 3 weedy rice identified a set of traits accounting for phenotypic variation within California weedy rice, including awn length, plant height, flag leaf characteristics, and grain length (Kanapeckas et al. Reference Kanapeckas, Tseng, Vigueira, Ortiz, Bridges, Burgos, Fischer and Lawton-Rauh2017), while traits that differentiated Type 3 rice from cultivated rice included pericarp color, awn length, spreading habit, panicle characteristics, flowering time, plant height, and grain length (Kanapeckas et al. Reference Kanapeckas, Vigueira, Ortiz, Gettler, Burgos and Fischer2016). While several of these traits were also indicated in this study (with the exception of flowering time), the diversity present in recently identified California weedy rice biotypes was not fully captured in those studies, especially for awn length and color variation traits like hull, leaf sheath, ligule, and collar color.
California weedy rice shares some phenotypic traits with weedy rice biotypes in other areas of the world, but it is also distinct. Weedy rice biotypes from the southern United States are classified by hull color, typically strawhull or blackhull, and by awn length, and are generally tall with lighter green leaves compared with cultivated rice (Noldin et al. Reference Noldin, Chandler and McCauley1999). Most southern U.S. weedy biotypes have pubescent leaves and highly shattering dormant seeds, although there is some variation in these traits (Noldin et al. Reference Noldin, Chandler and McCauley1999). California Type 1 weedy rice is very similar phenotypically to the strawhull awnless weedy rice of the southern United States, although it is a short-grain rice, while most southern U.S. weedy rice has longer grains (Shivrain et al. Reference Shivrain, Burgos, Scott, Gbur, Estorninos and McClelland2010). While blackhull weedy rice is relatively common in the southern United States (Shivrain et al. Reference Shivrain, Burgos, Scott, Gbur, Estorninos and McClelland2010), it is rarely found in California, and California blackhull weedy rice (Type 4) is distinct from southern U.S. blackhull weedy rice, in that plants are shorter (75 ± 6 cm) relative to other weedy rice biotypes (ranging from 100 ± 9 to 120 ± 12 cm) (Figure 2A), with a nonemerging panicle from the boot. Studies of weedy rice biotypes in other areas typically report that weedy rice is tall (Chauhan and Johnson Reference Chauhan and Johnson2010; Noldin et al. Reference Noldin, Chandler and McCauley1999), although some rare biotypes may be quite short (Shivrain et al. Reference Shivrain, Burgos, Scott, Gbur, Estorninos and McClelland2010). Some studies of southern U.S. weedy rice have indicated that weedy rice biotypes similar in height to cultivated rice may be hybrids with local cultivars (Burgos et al. Reference Burgos, Singh, Tseng, Black, Young, Huang, Hyma, Gealy and Caicedo2014; Gealy et al. Reference Gealy, Mitten and Rutger2003; Singh et al. Reference Singh, Singh, Black, Boyett, Basu, Gealy, Gbur, Pereira, Scott, Caicedo and Burgos2017b), although there are exceptions (Gealy et al. Reference Gealy, Agrama and Jia2012). Type 4 weedy rice is likely not a hybrid with cultivated rice, as it is otherwise not phenotypically similar to California rice varieties (Figure 1A) and is genetically distant from them (De Leon et al. Reference De Leon, Karn, Al-Khatib, Espino, Blank, Andaya, Andaya and Brim-DeForest2019). Weedy rice biotypes from the southern United States have large variation in heading or flowering date, similar to California biotypes (Kanapeckas et al. Reference Kanapeckas, Tseng, Vigueira, Ortiz, Bridges, Burgos, Fischer and Lawton-Rauh2017; Shivrain et al. Reference Shivrain, Burgos, Scott, Gbur, Estorninos and McClelland2010; Thurber et al. Reference Thurber, Jia, Jia and Caicedo2013). While some of these studies indicate that strawhull biotypes tended to flower earlier than darker-hulled biotypes (Shivrain et al. Reference Shivrain, Burgos, Scott, Gbur, Estorninos and McClelland2010; Thurber et al. Reference Thurber, Jia, Jia and Caicedo2013), this difference was not significant between most California weedy rice biotypes of different hull colors (Figure 2).
Asian weedy rice biotypes are commonly strawhulled or blackhulled with long awns, and most are highly shattering, while there is large variation in flowering time and plant height (Huang et al. Reference Huang, Young, Reagon, Hyma, Olsen, Jia and Caicedo2017). In many areas of Asia, frequent crop–weed and wild–weed hybridization means that weedy populations tend to resemble either the local cultivars or wild rice species (Delouche et al. Reference Delouche, Burgos, Gealy, de San Martin, Labrada, Larinde and Rosell2007; Xia et al. Reference Xia, Wang, Xia, Zhao and Lu2011). Outside Asia, there is generally no wild rice co-occurring with cultivated rice under field conditions, but some weedy rice biotypes do resemble the locally grown cultivars, either because of crop–weed hybridization or through selection for crop mimicry. While hybridization of California weedy rice biotypes with temperate japonica cultivars is likely relatively rare (De Leon et al. Reference De Leon, Karn, Al-Khatib, Espino, Blank, Andaya, Andaya and Brim-DeForest2019), the two are similar, in that some weedy biotypes have straw-colored hulls and medium grain length and are able to germinate and grow in the continuously flooded direct-seeded rice system used in California, allowing them to evade weed management efforts.
Weedy rice is a growing problem in California rice agriculture, and an understanding of the phenotypic traits of weedy rice biotypes is critical in identification of weedy rice infestations. Ideally, weedy rice should be identified before the formation of colored or awned hulls or red pericarp, which are frequently diagnostic of weedy rice. Rather, weedy traits that are visually apparent early in the growing season would allow growers more time to make management decisions and execute interventions. Plants that are tall with lighter green leaves are most likely to be weedy rice. In addition, some weedy biotypes have greenish-purple or purple leaf sheaths, ligules, and collars on some plants. There is considerable variation between weedy biotypes for some traits, and some of these differences have important implications for management, making it important for growers to understand what type of weedy rice is present in their fields. Weedy rice biotypes with high seed shattering and dormancy present more challenges to long-term management compared with biotypes that do not have high seed shattering and dormancy. However, the presence of a suite of traits that can be used to identify weedy rice biotypes does have potential for aiding successful weed management programs, especially for biotypes with low seed dormancy and shattering.
Acknowledgments
The authors would like to thank the California Rice Research Board for providing the funding for this research. The authors would also like to thank the California Rice Experiment Station and the director, Kent McKenzie, who provided greenhouse space. Puja Upadhayay, Ryan Hall, Carson Tibbits, and James Broaddus provided assistance in the greenhouse. No conflicts of interest have been declared.