I. INTRODUCTION
The perpetual technological urge on the miniaturization of semiconductor devices has driven the demand for thin dielectric films that makes the surface and interface structure of multilayers crucial to the performance of devices. A rough surface of individual layer tends to have a higher interfacial trap density, and that induces inherent nonuniformity in the growth of subsequent overlayers. Rough surfaces are usually accompanied by columnar growth that leads to serious quality degradation of devices. Thus, understanding the surface roughness and columnar growth mechanisms involved in the bulk and suppressing them is of great significance, both for fundamental research and for device applications.
One successful method for fabricating thin films with smooth interfaces is chemical vapor deposition (CVD) at relatively high processing temperatures. High temperature provides extensive film precursor diffusion on the surface, leading to improved crystallinity.Reference Matsuda1, Reference Cheng, Xu and (Ken) Ostrikov2 The highly mobile precursor species are able to move about the surface, filling in voids, suppress the formation of porous microstructures that lead to surface roughness. Although moderately high substrate temperatures are favorable for forming smooth film interfaces, they are also incompatible with many temperature-sensitive materials such as some optical plastics. Using Ar as a diluent to the (SiH4 + H2)-plasma improved crystallinity was reported in P-doped microcrystalline (μc)-Si:H films even at a very low thickness.Reference Das and Jana3 Despite this, smooth surfaces with featureless microstructure are still obtainable; energetic particle bombardment can supply energy to the growing film and supplement low thermal energy to achieve smooth interfaces. In low-pressure CVD, increased mean free path of the reacting molecules can facilitate the energetic particle bombardment on the growing surface and thereby significantly enhance the surface diffusion of adatoms, resulting in minimization of the microstructure and formation of dense network with smooth surface.Reference Thornton4, Reference Zeuner, Neumann and Meichsner5 However, the growth rate of the material drastically reduces at low working gas pressure in the plasma. To recompense the growth rate, a combination of high-power and high-pressure plasma conditions were tried and a better control in producing Si:H network at the onset of microcrystallinity was reported.Reference Mukhopadhyay, Das and Ray6
Other than increasing the substrate temperature or reducing the gas pressure, the surface diffusion of the precursors at the growth zone can be amplified through energetic particle bombardment by applying suitable electrical bias to the substrate. Because of the operational limitations of the classical parameters like high radio frequency (RF) power and substrate temperature in device fabrication, use of reasonable substrate-bias could be a supplementary parameter, efficiently organizing the growth.Reference Sarott, Iqbal and Veprek7–Reference Wang, Liu, Wang, Liao, Wang, Zhu, Wang and Yan10 It has been identified that the RF substrate bias increases the crystalline fraction of the polycrystalline silicon network prepared by electron cyclotron resonance CVD (ECR-CVD) technique.Reference Bae, Kalkan, Cheng and Fonash11 In case of using direct current (dc) substrate bias, some report demonstrates that positive bias improves the crystallinity while the negative bias damages the material quality as well as the surface in ECR plasma CVD.Reference Nozawa, Takeda, Ito, Hori and Goto12 Using microwave CVD (MWCVD)Reference Jia, Saha, Ohse and Shirai13 or RF magnetron sputtering,Reference Kim and Chung14 on the contrary, it has been reported that the crystallinity progresses under adequate negative substrate bias itself whereas higher bias deteriorates the film quality.Reference Fukaya, Tabata and Mizutani15
Although H2-dilution to SiH4 is the most popular way for obtaining nanocrystallization in Si network,Reference Matsuda16–Reference Sriraman, Agarwal, Aydil and Maroudas18 inert gas dilution, e.g., by Ar or HeReference Das, Jana and Barua19–Reference Bhattacharya and Das21 has come up as competent alternative, providing a reasonably better throughput and enabling low-temperature deposition, altogether facilitating on issues related to commercial utilization in devices. In view of restraining all such relevant issues, present study deals with the effect of negative dc substrate bias on the promotion of nanocrystallization in Si network, particularly from He-diluted SiH4 plasma in RF-PECVD, the combination of which has never been explored earlier. By comprehensive analysis, using spectroscopic ellipsometry and various modes of electron microscopy, it has been demonstrated how negative substrate bias, within He-diluted SiH4 plasma, could control the growth morphology to construct a homogeneous nanocrystalline network, even at a low substrate temperature and improve the materials characteristics, e.g., overall crystallinity, surface roughness, void density, etc, to make it more device-friendly.
II. EXPERIMENTAL DETAILS
The film deposition system is an RF plasma CVD reactor made of a cylindrical cavity stainless steel chamber having 30 cm diameter and 23 cm height and that consists of capacitively coupled parallel plate circular electrodes of 20 cm diameter and 2.5 cm apart. For the dc biasing to the substrate, a regulated external dc power supply has been operated within the range of 0 to 150 V. The nanocrystalline (nc)-Si:H films have been prepared using a fixed flow of 1 sccm SiH4 diluted by 69 sccm helium, at a gas pressure of 0.5 Torr and 100 W of applied RF (13.56 MHz) power. Keeping all other parameters constant, a set of films were grown by varying the substrate bias (V b) from 0 to −100 V to investigate its effect in controlling the nanocrystallization to the Si network at a low substrate temperature of 200 °C, especially under He-diluted SiH4 plasma ensemble. Film thickness was maintained typically within 750 ± 100 nm, as measured by a Dektak 6M profilometer (Veeco Instruments, Inc., Plainview, NY). Structural studies were performed using a fixed angle of incidence spectroscopic ellipsometer (Jobin Yvon, Horiba Scientific, Kyoto, Japan) and a comprehensive analysis and estimate on various components of the ensemble have been carried out by proper simulation of the ellipsometry data considering specific optical model of the network. To observe the surface morphology, JEOL-JSM-6700F field emission scanning electron microscope (FE-SEM; JEOL Ltd., Tokyo, Japan) and Veeco (di CP-II) atomic force microscope (AFM; Bruker AXS, Mannheim, Germany) has been used. A detailed observation and analysis on various structural constituents along the growth direction has been performed by both plan-view and cross-sectional transmission electron microscopy (TEM) using JEOL-JEM-2000FX TEM (JEOL Ltd., Tokyo, Japan) on samples deposited on single-crystal Si wafers. Raman measurements were carried out at room temperature in a backscattering geometry using a 488nm air-cooled Ar+ laser as an excitation source. The Raman spectra were obtained using TRIAX550 single monochromator (Horiba, Edison, NJ) with an open electrode charge coupled device as a detector. The silicon–hydrogen bonding structure of the films was investigated using a Fourier transform infrared spectrometer (Nicolet Magna-IR 750, Nicolet Instruments Inc., Ramsey, MN).
III. RESULTS
A. Ellipsometric study
Ellipsometry is a powerful tool in performing comprehensive study on the film microstructure without damaging the material. The measured dielectric function, called “pseudodielectric function,” usually contains information about the entire system including the substrate–film interface, the bulk of the film, and its surface over layers. The contributions of different parts of the heterogeneous system to the pseudodielectric function are calculated based on the effective medium approximation and using Fresnel’s equation and combined. The calculated resultant dielectric function is then compared to the measured data by performing a least-square fit to the various parameters of the optical model, e.g., thickness and composition.
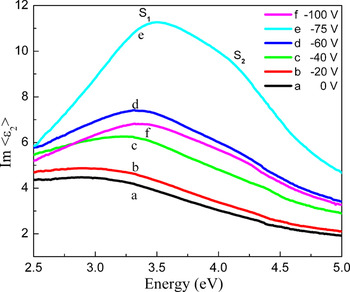
Figure 1 shows the distribution of the imaginary part of the pseudodielectric function <ε2>, above photon energy 2.5 eV, obtained from ellipsometry on the entire set of samples. The spectra a and b that correspond to the samples prepared at V b = 0 and −20 V respectively, basically represent two closely similar humps which indicate mostly amorphous dominated network structure. At enhanced V b = −40 V, the corresponding spectrum exhibits two specific shoulders S1 and S2 at E 1 = 3.4 eV and E 2 = 4.2 eV, respectively, which are attributed to the optical band transitions and indicate the appearance of the crystalline phase Reference Kumar, Drivillon and Godet22 as an effect of the applied negative substrate bias. The magnitude of <ε2> increases noticeably at a bias voltage of −75 V and simultaneously the intensity difference between two shoulders S1 and S2 enhances significantly. On further increase in V b to −100 V, however, the <ε2> spectrum reduces in intensity. The magnitude of <ε2> in the spectra depends sensitively on the crystalline volume fraction, crystallite size, surface roughness, and the film porosity,Reference Hamers, Fontcuberta i Morral, Niikura, Brenot and Roca i Cabarrocas23–Reference Das25 higher magnitude generally indicates higher density of the network. The intensity difference between two shoulders apparently corresponds qualitatively to the amount of crystallinity in the network; higher intensity difference indicates better crystallinity.Reference Das26
Comparison in the nature of distribution of the imaginary part of pseudodielectric function, <ε2> measured by spectroscopic ellipsometry, for nc-Si:H films prepared at different negative direct current (dc) substrate bias. (color online)

To obtain a comprehensive understanding on the film microstructure, the ellipsometry spectra were analyzed by a fitting procedure using Bruggeman effective medium approximationReference Bruggeman27

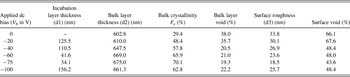
where <εi> and fi indicate the pseudodielectric function and the volume fraction of the ith component respectively. A three-layer optical model has been used to fit the spectra while the layers are considered as (i) the amorphous incubation layer, consisting of a-Si and void, (ii) the bulk layer of nc-Si, a-Si, void, and (iii) the surface layer also having nc-Si, a-Si and void, with different fraction of the individual constituents. However, in case of the film prepared without any applied bias merely a two-layer model has been considered and that gives the best fit to the data. Because of the mostly amorphous dominated structure of the material, the bulk layer and the incubation layer have been believed to have no separate identity. The contribution of F c-Si was analyzed using a reference <ε2> spectrum of fine grain poly-silicon given by Jellison.Reference Jellison, Chisholm and Gorbatkin28 The simulation is performed by minimizing the χ2, the mean square error, between the measured and the calculated ellipsometric error parameters using linear regression method,Reference Jellison29 where N and M are the numbers of the measured and calculated wavelengths, respectively, and c and m are the calculated and measured values of ψ and Δ, respectively. The fitting results obtained from the simulation of the ellipsometry data for samples prepared at different substrate bias are summarized in Table I.
Ellipsometry data for the nc-Si:H films prepared using different negative direct current (dc) substrate bias, applied during plasma processing in radio frequency plasma-enhanced chemical vapor deposition

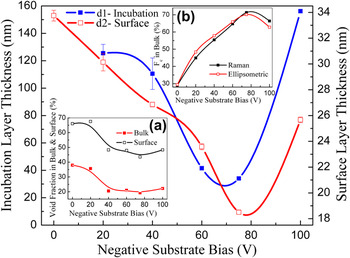
The bulk layer thickness of the series of samples has been estimated to vary within a very narrow range like 640 nm ± 6%; hence the other estimated data for different layers should be absolutely free from any influence of sample thickness and be treated as due to the sole effect of applied dc biasing on the substrate during film growth. The variation of thickness of the incubation layer as well as the surface roughness layer has been separately plotted in Fig. 2 to probe on their remarkable minimization possible by controlling the applied bias. The incubation layer on the substrate interface being typically noncrystalline in nature, its minimization ensures improvement in sample quality. Likewise surface roughness embraces the major voids hence its thinning could certainly help obtaining better interface for multilayers. The void fraction in the surface layer as well as in the bulk of the material reduces significantly on applied bias and has been found to attain a sallow minimum around V b ∼ −75 V, as shown at the inset (a) in Fig. 2. The crystalline volume fraction in the bulk of the material increases steadily from <30% for V b = 0 V to ∼70% at V b = −75 V, beyond which it reduces notably. To make a reasonable comparison on the estimations using two different spectroscopic tools, the overall crystalline volume fraction (F c in %) of the nc-Si:H films has been separately estimated from the Raman study, as:

Variations in thickness of the amorphous incubation layer and surface roughness layer of nc-Si:H films prepared under different negative dc substrate bias, as evaluated from ellipsometric modeling. The inset-(a) shows variations of the void fraction in the bulk and surface layer, while inset-(b) presents a comparison of the crystalline volume fraction in the bulk of the films, as evaluated from ellipsometric modeling and estimated from Raman measurement. (color online)

where, I a, I b, and I c are the integrated intensities of the amorphous component centered at around 480 cm−1, the intermediate ultrananocrystalline or the grain boundary component ∼510 cm−1and the regular crystalline component appeared ∼520 cm−1, respectively, in the Raman spectrum. The β is the ratio of the cross section of the amorphous phase to the crystalline phase, which has been considered to be unity during the present estimation because of the nanocrystalline nature of the material. The detailed investigation by the Raman studies on the samples has been shown in a previous publication.Reference Raha and Das30 The crystallinity in the bulk of the nc-Si:H films obtained from the ellipsometry data and the overall crystallinity estimated from the Raman study has been plotted at the inset (b) in Fig. 2 which indentifies an excellent agreement.
B. Cross-sectional TEM study
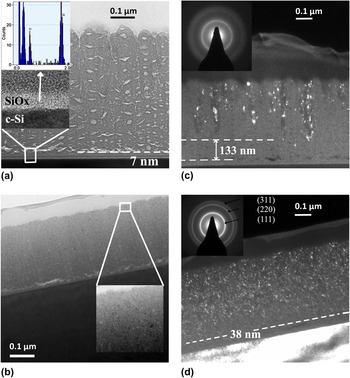
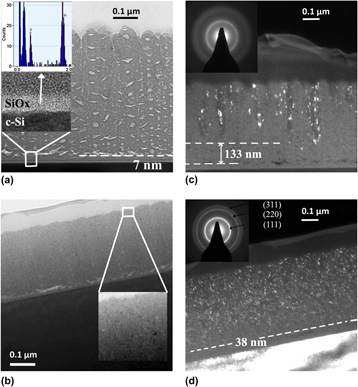
Figure 3(a) represents the bright-field image of the Si:H film prepared at V B = 0 V. The dark region in the image corresponds to the Si components that are close to Bragg position with respect to the incident electron beam. The bright patches in the micrograph exhibiting sharp contrast in the image identify typical regions of low density, like voids and structural imperfections. The voids are mostly elongated crack-like and also spherical cavities, which grow along the film thickness. The narrow and vertically elongated crack-like cavities create distinctive line of separation along the growth direction and induce columnar growth of the material.Reference Houben, Luysberg, Hapke, Carius, Finger and Wagner31 In case of the columnar structure of the network prepared at V B = 0 V, the surface is strongly corrugated, i.e., deep grooves are generated between individual columns creating huge surface roughness. The horizontal crack-like cavities are mostly limited by the width of each column; however, at the initial phase of growth, those cavities accumulate at the substrate-film interface and are extended beyond the columnar width. Careful observation reveals that a purely homogeneous amorphous interface layer of thickness ∼7 nm exists between the film and the C–Si substrate, as shown by the high-resolution image at the inset of Fig. 3(a). The interface has been identified, by energy dispersion x-ray spectroscopy mapping, as the native oxide amorphous overlayer on the C–Si substrate that retains its structural identity different from that of the substrate and the nc-Si:H film grown on it through plasma processing. However, during the initial plasma interaction at the early stage of growth, voids are generated in the form of extended horizontal cavities, at several places on the interface, to ascertain strain minimization at the growth site.
Bright-field cross-sectional transmission electron microscopy (TEM) images of the Si:H samples prepared at: (a) V b = 0 V, showing the strongly corrugated surface, the presence of columnar structure full of voids, and structural imperfections. The inset shows the high-resolution image of the homogeneous amorphous interface layer which has been identified, by energy dispersion x-ray spectroscopy mapping, as the native oxide overlayer on the C–Si substrate. (b) V b = −75 V, demonstrating the removal of surface corrugation and elimination of the columnar structure. The inset shows the high-resolution image of the bulk material close to the surface. Dark-field image of the sample for: (c) V b = 0 V, showing the presence of large crystalline grains within predominantly amorphous matrix, with the diffused selected area diffraction (SAD) rings at the inset identifying low crystallinity in the network. and (d) V b = −75 V, containing large number of tiny nanocrystalline grains homogeneously distributed above thin incubation layer, with bright and sharp SAD rings at the inset indicating superior crystallinity. (color online)

In case of films prepared without any applied bias (V B = 0 V), Si:H network is grown in the form of distinctive columns with column-width varying between 40–75 nm wherein spherical cavity voids of dimension changing within 7–25 nm are distributed along the growth direction. On the contrary, at an applied bias V B = −75 V, the spherical voids are mostly abolished, the columnar growth morphology apparently disappeared, and consequently the surface roughness is significantly reduced, as demonstrated in Fig. 3(b). The horizontal crack-like cavities still accumulate at the initial phase of growth, however, at considerably lesser extent. High-resolution image of the bulk as presented at the inset in Fig. 3(b) identifies hardly any tiny vertical cracks, but a large number of clearly visible three-dimensional nanocrystallites are randomly distributed over the entire matrix.
Figure 3(c) represents the dark-field image of the film prepared at V B = 0 V. The bright regions in the micrograph correspond to the crystalline parts of the network. The orientation of the crystallites along the growth direction identifies the columnar growth structure of the material. The individual crystalline columns start generating from different depths of the network, however, leaving a large fraction of the amorphous component below and between each column. Thus, apart from its columnar nature of growth, the Si:H film identifies its predominantly amorphous structure when prepared at V B = 0 V. In addition, the gross crystallization starts after the growth of a quite thick amorphous overlayer, leaving a virtual incubation layer of nearly 133 nm. The inset of Fig. 3(c) represents the selected area diffraction (SAD) pattern over a wide area on the bulk of the material and the blurred diffraction rings corroborate the mostly amorphous dominated structure of the material. In contrast, the film prepared at V B = −75 V represents a very high-density nanocrystalline structure as represented by the dark-field image in Fig. 3(d). The distribution of the crystallites is horizontally homogeneous, identifying the removal of the columnar growth pattern in the development of the overall network structure. In addition, a sharp elimination of the amorphous incubation layer to ∼38 nm has been well documented from the concerned dark-field image, steering crystallization to begin at an early stage of growth. The inset in Fig. 3(d) represents the SAD pattern identifying sharp crystallographic rings corresponding to <111>, <220>, and <311> planes of C–Si in the bulk of the material.
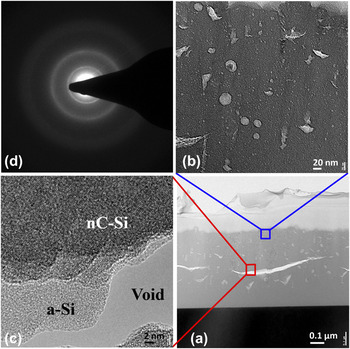
On further increase in V B to −100 V, however, the applied substrate bias identifies complementary effects, as shown in Fig. 4. As envisaged, the growth pattern becomes certainly noncolumnar and the surface becomes reasonably smooth; however, very high ion bombardment at the growth zone induces significant increase in the incubation layer, as shown in Fig. 4(a), similar to that obtained from ellipsometry data. The overall structure in the bulk identifies small voids and spherical cavities [Fig. 4(b)]. However, elongated horizontal fractures are occasionally generated to minimize strain. Figure 4(c) presents the high-resolution image around such a fracture identifying a zone of extended void, surrounded by an amorphous overlayer and nanocrystalline network starts growing beyond it. The material becomes less crystalline as demonstrated by the SAD pattern shown in Fig. 4(d), identifying a close relation to the ellipsometry and Raman data presented in Fig. 2(b).
(a) The cross-sectional TEM image of the film prepared at V B = −100 V. (b) High-resolution image identifying the overall structure in the bulk full of small voids and spherical cavities. (c) High-resolution image of elongated horizontal fracture occasionally generated to facilitate strain minimization in the bulk. Fractures are comprised of a zone of extended void, immediately surrounded by an amorphous overlayer retarding the growth of nanocrystalline network. (d) The diffused SAD pattern identifies relatively reduced nanocrystallization at very high negative substrate bias. (color online)

C. Surface morphology by FE-SEM and AFM
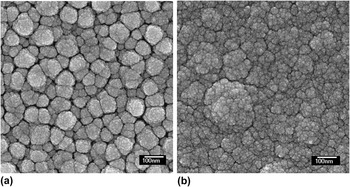
The surface morphology of the Si:H network has been studied by field emission scanning electron microscopy (FE-SEM). Figure 5(a) represents the surface profile for the film prepared at V b = 0 V. It has been demonstrated by the SEM photograph that the material form cluster-like structures at the surface; the clusters are quite large, uneven, and well separated from each other that makes the surface practically rough and the adjacent network becomes full of voids. Figure 5(b) represents a distinctly improved, smooth, and homogeneous surface morphology of the nc-Si:H network, obtained at V b = −75V from the He-diluted SiH4 plasma, that contains ∼70% crystallinity as estimated from ellipsometry studies.
Field emission scanning electron microscopy image representing the surface profile of the sample prepared at (a) V b = 0 V and (b) V b = −75 V.

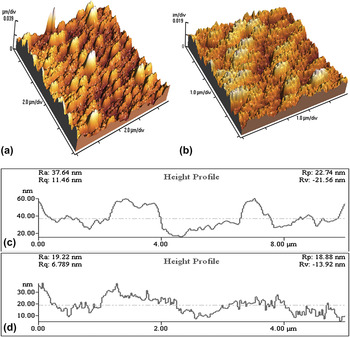
AFM can demonstrate the surface roughness directly. Figures 6(a) and 6(b) show the AFM images of the samples prepared at V b = 0 and −75 V, respectively. The average surface roughness (R a), as estimated from AFM height profile shown in Figs. 6(c) and (d), obtained from corresponding AFM images in Figs. 6(a) and 6(b), reduces from 37.6 to 19.2 nm as the substrate bias increases from 0 to −75 V, respectively. Similar estimates from the ellipsometry data identified R a reducing from 33.8 to 18.5 nm, demonstrating excellent agreement. Surface roughness of the films drastically reduced by the bombardment induced enhanced mobility of the depositing adatoms as the bias voltage is increased.Reference Kim and Chung14 These surface features are directly related to columnar structures surrounded by void regions,Reference Messier and Ross32 as has been confirmed by TEM studies.
Atomic force microscopy (AFM) images demonstrating the change in surface roughness for the samples prepared at dc substrate bias: (a) V b = 0 V and (b) V b = −75 V. Corresponding surface roughness height profiles extracted from AFM images for (c) V b = 0 V and (d) V b = −75 V. (color online)

D. Hydrogen bonding and growth rate
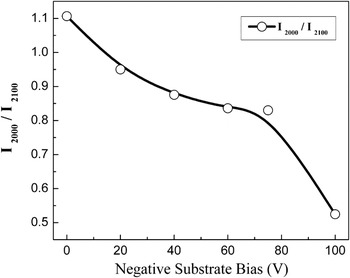
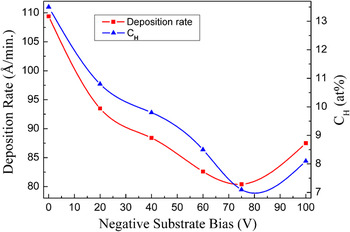
The infrared absorption studies have been performed to identify the silicon–hydrogen bonding configurations in the network. The Si–H stretching mode absorption band has been deconvoluted into two major satellite components around ∼2000 and ∼2100 cm−1 and the ratio of the integrated areas (I 2000/I 2100) has been plotted in Fig. 7. It has been identified that the magnitude of the ratio remains >1 at V b = 0 V, demonstrating mostly monohydride bonding configuration of the basic network. On application of negative bias I2000/I2100 gradually reduces identifying a systematic change of the network towards polyhydride configuration, which is the natural consequence of ion bombardment. However, the nature of changes are very slow that attains an almost saturation with I 2000/I 2100≥0.8 at around V b = −75 V above which a sharp polyhydrogenation of the network due to vigorous ion bombardment has been demonstrated. The bonded hydrogen content (C H at.%) has been estimated from the Si–H wagging mode of vibrationReference Shanks, Fang, Ley, Cardona, Demond and Kalbitzer33 and its variation with applied substrate bias is shown in Fig. 8. The variation of the growth rate of the material has also been presented in the same figure. At V b = 0 V, the film contains a relatively large amount of C H ∼13 at.%, which reduces sharply on application of the substrate bias and attains a minimum of ∼7.1 at.% at V b = −75 V, corresponding to superior crystallinity. However, on further increase in V b, the C H increases to ∼8.1 at.% at V b = −100 V. The film deposition rate attains almost similar nature of variation to that of C H, exhibiting its highest magnitude ∼11 nm/min at V b = 0 V where the network is mostly amorphous-like. The best nanocrystalline network is obtained at V b = −75 V with a deposition rate of ∼8 nm/min. Such a low growth rate of the material is due to the low applied RF power of 100 W to the plasma containing only 1sccm of the feed gas SiH4.Reference Raha and Das30
Ratio of the integrated areas (I2000/I2100) under two major satellite components of the Si–H stretching mode absorption band around ∼2000 and ∼2100 cm−1, plotted against the applied dc substrate bias.

Variation in the bonded hydrogen content estimated from wagging mode vibration of the infrared absorption band and the film deposition rate, with different applied dc substrate bias. (color online)

IV. DISCUSSION
In estimating the systematic changes in the microstructure of the Si:H network by ellipsometry, a bilayer optical model has been considered for the film prepared at V B = 0 V. This is because of the predominantly amorphous structure of the network wherein the demarcation between the amorphous incubation and the bulk layer is virtually missing. On application of the negative substrate bias when the network rapidly turned towards nanocrystalline, the incubation layer thickness gradually reduced from ∼125 nm at V B = −20 V to ∼34 nm V B = −75 V. A gross reduction in the thickness of the incubation layer as a result of applying negative bias has been obtained from cross-sectional TEM observations. The sharp enhancement of crystallinity identified by the dark-field image of the TEM micrograph supports the change in estimated bulk crystallinity from ∼29 to ∼70% on application of substrate bias from 0 to −75 V, respectively. Elimination of bulk void density from ∼37 to ∼19% obtained from ellipsometry is supported by the TEM micrographs when both the spherical cavity and elongated crack-like voids are removed by applying negative substrate bias. The overall growth pattern transforms from an amorphous dominated columnar structure to a homogeneous nanocrystalline network. Consequent changes in surface roughness observed in TEM as well as SEM micrographs support the ellipsometric estimation by its reduction from ∼33 to ∼18 nm and also from ∼37 to ∼19 nm, as obtained from AFM study.
Although ion bombardment is most commonly considered as detrimental for the electronic properties, some beneficial effects such as densification of the network and hydrogen desorption have been pointed out, keeping controversy about its role on the growth mechanisms and the structural properties. Formation of large grains with improved bulk transport properties accompanied by the presence of an amorphous interface layer with the substrate have been reported by reducing the ion energy through the increase of the total pressure and depositing on the grounded electrode, while fully crystallized films on glass substrates were obtained under conditions of high-energy ion bombardment.Reference Kalache, Kosarev, Vanderhaghen and Roca i Cabarrocas34 With the aim of tuning the ion bombardment, by independently controlling the ion energy and the ion flux, a variety of techniques have been implemented. However, no clear conclusion on the effect of ion bombardment has been inferred, and none of the proposed growth models involves ions.
Independent to the deposition process, the atomic self-shadowing and the surface diffusion are the two factors that crucially control the film microstructure.Reference Karunasiri, Bruinsma and Rudnick35 The shadowing of the valleys by peaks enhances the instability, leading to rough and columnar structure, however, surface diffusion in all cases tends to smooth out roughness on the growing surface. The physical structure of the films prepared under low surface diffusion condition generally proceeds with columnar growth pattern with relatively low-density network, e.g., voids surrounding the columns. It is generally recognized that the energetic particle bombardment at the growth zone, induced by the application of substrate bias voltage, increases surface rupturing and promotes mobility of surface adatoms, thereby reducing atomic self-shadowing conditions. Such bombardment processes eliminate the intercolumnar network of voids or low-density regions.
In case of RF glow discharge, two major gas phase reactions have been found accountable for generating charged species in SiH4 plasma.Reference Bhattacharya and Das21 The electron-impact ionization is the dominant mechanism, which is responsible for both sustaining the plasma and controlling the deposition reactions.Reference Amanatides, Mataras, Rapakoulias, van den Donker and Rech36 Penning ionization, the other probable mechanism, creates ion/electron pairs through metastable neutral collisions. With the increase in the applied RF power in the plasma, the energy gaining mechanism of the electrons changes from the so-called α-regime to the γ -regime and the energy density steadily increases in magnitude.Reference Bohm and Perrin37
In RF-PECVD, the growing films are also exposed to a high flux of energetic ions. The overall effect of ion bombardment during the growth is proportional to both the ion energy and the ion flux density. However, ion energy has been identified as a more effective parameter on the crystallinity, while larger ion flux density results in greater growth rate because of increased electron density.Reference Kondo, Fukawa, Guo and Matsuda38
Imposing a dc bias on the RF electrode acts on the voltage drop across the grounded electrode sheath namely the plasma potential V p and is therefore a supplementary way to vary the energy of the ions impinging on the substrate. If the applied dc bias voltage is lower than the self-bias voltage on the RF electrode, the plasma potential is consequently lowered to ensure the ion current balance on both electrodes. On the other hand, if the dc voltage is higher than the self-bias, the plasma potential and therefore the ion energy are increased.
In the formation of Si network from SiH4 plasma in PECVD, various charge species like SiHn + (1 ≤ n ≤ 3) and ions of the diluent gas play significant role. Their efficient interaction on the growing surface, on application of suitable substrate bias, could considerably influence the growth morphology. Because of the extremely high ion flux density created within ECR SiH4/H2 plasma, improvement in crystallinity and surface roughness has been attained in polycrystalline silicon films by reducing the impact of ions by applying positive bias on the substrate.Reference Nozawa, Takeda, Ito, Hori and Goto12 On the contrary, while using high-density microwave plasma source in which the ion density happens to be much lower than the ECR plasma, improvement in crystallinity has been reported in μc-Si films under appropriate negative dc substrate bias.Reference Jia, Saha, Ohse and Shirai13 Hence, the reactivity of ion bombardment has been found unanimous in causing gross modifications on the network leading to poly- and microcrystalline structure. In RF-PECVD with moderate power applied to the plasma, negative substrate bias happens to be effective in obtaining an ordered network structure and relatively smooth surface morphology because of further reduced ion density present therein. However, very high negative bias may again deteriorate the film microstructure and substrate interface because of rigorous effect of ion bombardment on the growing surface.
In case of He-diluted SiH4 plasma, in particular, it has been established from the mass spectroscopic studies that, in addition to SiHn + species a lot of metastable He* (20 eV) and ionized He+ (24 eV) are produced, leading to the occurrence of the Penning ionization and excitation.Reference Jia, Fujiwara, Kondo and Kuraseko39, Reference Theil and Powell40 Metastable He*, having energies sufficiently larger than the dissociation energy of SiH4 (∼10 eV), plays a vital role in the process of dissociation of SiH4 molecules to form radicals, e.g., SiH3, SiH2, etc. Also the collision cross section between He* and SiH4 is quite large. Accordingly, decomposition of SiH4 is significantly enhanced through the reaction with He* that leads to the increase in plasma density and enhance the film growth rate at a relatively low RF power.Reference Kushner41 Moreover, the crystallization process in the network could be typically controlled by the energy transfer through bombardment of metastable He* and ionized He+ in the plasma. On de-excitation of metastable and ionic helium, electron energy is transferred to the growing surface as well as to the reacting precursors, which enhances their mobility, and thereby eliminates voids and surface roughness and induces nanocrystallization.Reference Bhattacharya and Das21 The formation energy of ionized He+ being higher than that of He*, the effect of the bombardment of He+ becomes insignificant at low RF power. At elevated RF power, both He* and He+ become reactive and those are produced at larger concentrations as well. However, at higher RF power, plasma decomposition of SiH4 produces mostly lower hydride precursors like SiH which have lower mobility within Si matrix that deviates the crystallinity and encourages columnar growth, in general. Here lies the importance of applying dc substrate bias. Negative substrate bias, applied during film growth, amplifies the energy transfer phenomena and enhances nanocrystallization even at low RF power and at relatively low substrate temperature. Again, since atomic weight of helium is much lower, metastable or ionic bombardment at the growing surface is not as harmful as the bombardment of ionic precursors that simply occurs in similar negative substrate bias condition in case of H2-diluted plasma. However, very high ion bombardment at elevated negative dc bias may cause surface damage and further deviation in the degree of crystallinity.
The role of inert gas ions, such as He, is to break the surface H bonds, thereby creating a dangling bond, and allowing another silyl radical to insert itself. The inert gas ions do not penetrate deep into the substrate, but H ions do. If the surface hydrogen is not removed and Si not cross-linked, the bonded Si–H structure gets buried, new material grows around it, and a microstructure with a significant void concentration and clustered silicon–hydrogen bonds form in the lattice. Such a microstructure then leads to rapid degradation. Thus He-dilution provides some additional tools to play-with, in view of organizing nanocrystallization, like He* and He+ over the H2-diluted plasma condition wherein hydrogen coverage on the growing surface seems to have the dominant control.Reference Matsuda16 By tuning the applied negative substrate bias and exploiting the metastable and ionic helium bombardment in optimum dose, the growth morphology of nanocrystalline silicon could be controlled in various aspects, e.g., by promoting a homogeneous growth of nanocrystalline network free from columnar structure, by eliminating amorphous incubation layer thickness, increasing the overall nanocrystallinity in the bulk, removing the surface roughness, and thereby providing better interface for suitable device structures.
V. CONCLUSIONS
The present investigation deals with a comprehensive analysis by spectroscopic ellipsometry and various modes of electron microscopy, on the growth of nanocrystalline silicon network, under controlled dc substrate bias at low growth temperature. In view of organizing nanocrystalline network, controlled transmission of energy to the growing surface is needed and that we propose, in the present case, to obtain from metastable helium (He*) bombardment and, in particular, ionic helium (He+) bombardment under negative substrate bias, within He-diluted SiH4 plasma in RF glow discharge. The growth morphology has been adequately regulated to a homogeneous nanocrystalline network restraining from an exclusive columnar structure that is coherent to low-temperature growth. It has been identified that to obtain nc-Si:H network with low void density, a relatively smooth film surface, a very thin incubation thickness, and an enhanced overall crystallinity accompanied by low hydrogen content, negative dc substrate bias in RF-PECVD could be one efficient parameter which, particularly within He-diluted SiH4 plasma, has not been tried before.
ACKNOWLEDGMENTS
The work has been done under the nano-silicon projects funded by the Department of Science and Technology (DST) (under Nano-Mission Program), the Council of Scientific and Industrial Research (CSIR), Government of India, and as a part of the collaborative research program undertaken between DST, Govt. of India, and the National Science Council of Taiwan.