Implications
The use of vegetable oils at expense of fish oil is currently a common practice in the production of Atlantic salmon. A drawback of this practice is the resulting imbalance in the concentration of n-3 long chain polyunsaturated fatty acids and total n-6 fatty acids in animal tissues. This imbalance might have potential negative implications for the health, redox homeostasis, and adiposity of farmed fish. This study assessed the use of resveratrol (RESV) as a natural antioxidant in Atlantic salmon feeds. The negative impact of dietary RESV on BW and feed intake discourages its inclusion in feeds for Atlantic salmon.
Introduction
Fish consumption is an important source of protein and lipids, including the n-3 long-chain polyunsaturated fatty acids (LC-PUFAs) eicosapentaenoic acid (C20:5n-3; EPA) and docosahexaenoic acid (C22:6n-3; DHA). Atlantic salmon (Salmo salar L.), a fish species widely produced through aquaculture, is a rich source of EPA and DHA. These fatty acids are considered health-promoting nutrients because of their anti-inflammatory and cardio-protective actions (Calder, Reference Calder2012). Farmed salmon obtain EPA and DHA mainly from dietary fish oil. However, fish oil has become less readily available and expensive raw material for fish production (Turchini et al., Reference Turchini, Torstensen and Ng2009). During the past years research has focused on finding alternatives to fish oils and, as a result, vegetable oils are now commonly used in feeds for Atlantic salmon (Turchini et al., Reference Turchini, Torstensen and Ng2009). Evidence from studies reviewed by Turchini et al. (Reference Turchini, Torstensen and Ng2009) suggest that replacing fish oil entirely with vegetable oils does not influence growth, health and feed intake of Atlantic salmon. However, results from a recent study conducted under stressful conditions in sea cages question this notion (Bou et al., Reference Bou, Berge, Baeverfjord, Sigholt, Østbye and Ruyter2017). Indeed, when replacing dietary fish oil with vegetable oils tissue concentrations of n-3 LC-PUFAs decreases whereas the concentration of pro-inflammatory n-6 fatty acids, including arachidonic acid (C20:4n-6; AA), increases (Bou et al., Reference Bou, Berge, Baeverfjord, Sigholt, Østbye and Ruyter2017). Peroxidation (auto-oxidation) of lipids in vivo damages tissues leading to LC-PUFAs spoilage and inflammation. Atlantic salmon responds to different levels of dietary pro-oxidants and antioxidants by regulating their antioxidant response and synthesizing glutathione and ubiquinone (Trenzado et al., Reference Trenzado, Morales, Palma and de la Higuera2009). In a recent study in which fish oil was replaced with vegetable oil in the diet of sea bream, Saera-Vila et al. (Reference Saera-Vila, Benedito-Palos, Sitjà-Bobadilla, Nácher-Mestre, Serrano, Kaushik and Pérez-Sánchez2009) reported a decrease in endogenous antioxidants such as glutathione and metallothionein together with an increase in the respiratory burst of circulating leucocytes. In addition to the diet composition there are several other factors (e.g. environmental factors, oxygen, temperature, presence of xenobiotics) known to affect the antioxidant defence in fish (Hamre et al., Reference Hamre, Torstensen, Maage, Waagbø, Berge and Albrektsen2010). Therefore, the use of dietary antioxidants might contribute to protect tissue EPA and DHA from oxidation by reactive oxygen species and thereby contribute to maintain fish health.
Resveratrol is a lipid-soluble phytoalexin present in fruits and vegetables (López-Vélez et al., Reference López-Vélez, Martínez-Martínez and Del Valle-Ribes2003). Due to its hydroxyl groups, RESV exhibits free radical scavenging activity in vitro thereby protecting unsaturated fatty acids from lipid peroxidation (López-Vélez et al., Reference López-Vélez, Martínez-Martínez and Del Valle-Ribes2003). In addition, RESV alone but especially in combination with EPA lowers inflammation by diminishing the release of AA which is a precursor of pro-inflammatory prostaglandins (Pallarès et al., Reference Pallarès, Calay, Cedó, Castell-Auví, Raes, Pinent, Ardévol, Arola and Blay2012). Moreover, RESV can affect lipid homeostasis by modulating the expression of transcription factors such as liver X receptor (LXR) or sterol regulatory element binding protein 1 (SREBP-1) (Sevov et al., Reference Sevov, Elfineh and Cavelier2006).
The objective of this study was to evaluate the effect of supplementing a diet low in fish oil with three different levels of RESV on Atlantic salmon performance and fatty acid composition. In addition the expression of genes involved in fish antioxidant signalling and lipid peroxidation and metabolism was also studied. The hypothesis behind this study is that dietary RESV might increase salmon tissue n-3 LC-PUFAs by improving fish antioxidant status and/or by modulating lipid metabolism.
Material and methods
Animals and diets
A feeding trial was performed with 256 Atlantic salmon post-smolts at Skretting ARC Lerang Research Station, (Jørpeland, Norway). After a 2-week acclimation period feeding a commercial diet, fish weighing 148±3 g were randomly and equally distributed into eight tanks and fed four experimental diets (32 fish per tank, two 450 l tanks per diet). The fish were fed the experimental diets for 102 days in flow through systems at continuously light regime. The diets were given in 10% to 15% excess during three meals per day (1st meal; 0800 to 1000 h, 2nd meal; 1200 to 1400 h, 3rd meal; 2000 to 2200 h). Uneaten feed from each tank was collected ~30 min after the meal ended, and dried (24 h at 100°C to 110°C) and weighed daily in order to measure feed intake. The tanks were supplied with sea water (34 ppt salinity), which was kept at 11.8±0.3°C, pH 7.9, 93.7±7.6% O2 saturation.
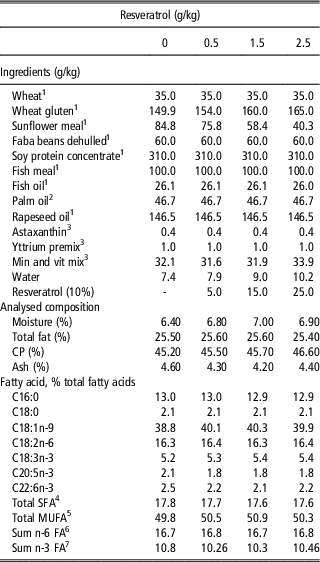
The experimental diets were formulated following the nutritional requirements of Atlantic salmon (NRC, 2011) produced at Skretting ARC Feed Technology Plant (Stavanger, Norway). With increasing levels of RESV the levels of wheat gluten was increased followed by a decrease in sunflower. Diets were formulated to be isonitrogenous and isolipidic. Animals were fed either the control diet or one of the three RESV-enriched diets (Table 1). All diets were at or above requirement of EPA and DHA (NRC, 2011). However, they were considered low according to commercial feeds at the time point of producing the diets in 2016 (4% v. 7% EPA and DHA of total fatty acids in our study and commercial feeds, respectively. The control diet did not contain any RESV (0%), whereas the remaining diets were supplemented with 0.5, 1.5, or 2.5% of a commercial product containing 10% RESV. These inclusion rates resulted in 0.5, 1.5, and 2.5 g of RESV per kg feed, respectively.
Ingredients (as-fed) and analysed chemical composition of the control and the 0.5, 1.5 and 2.5 g resveratrol enriched diets

1 Skretting, Stavanger, Norway.
2 Fritex 24, Aarhus Karlshamns, Karlshamn, Sweeden.
3 Include vitamins and minerals; Trouw Nutrition, Boxmeer, the Netherlands, proprietary composition Skretting Aquaculture Research Centre. Vitamin and mineral supplementation as estimated to cover requirements according NRC (2011).
4 Total saturated fatty acids (SFA) includes additionally C14:0.
5 Total monounsaturated fatty acids (MUFA) includes additionally C16:1, C17:1, C18:1n-7, C20:1 and C22:1.
6 Sum n-6 fatty acids includes additionally C16:2n-6 and C20:4n-6.
7 Sum n-3 fatty acids includes additionally C18:4n-3, C20:4n-3 and C22:5n-3.
Sample collection
At the beginning and end of the experimental period, fish were individually weighed and their fork length was recorded for growth monitoring. Fish were fed the experimental diets for 15 weeks and then deprived of feed for 12 h before sampling. Animals were anaesthetized and killed by a blow to the head. Four fish per tank (n=8 per diet) were selected to obtain individual samples of fillet and livers. Tissue samples were collected, snap frozen and stored at −80°C for fatty acid analysis. Additional liver samples were collected from eight fish per diet for gene expression analysis. To prevent RNA degradation, each sample was placed in a tube with 1 ml of RNAlater (Ambion, Austin, TX, USA) and stored at −80°C until analysis.
Calculations
Specific growth rate (%/day) was calculated as 100×(ln (final BW, g)−ln (initial BW, g))/days. Condition factor was calculated as 100×(BW, g)×(fork length, cm)–3. Feed conversion ratio was calculated as (kg feed fed)/(kg BW gain).
Chemical analysis
Feed proximal analyses including moisture, total fat, protein and ash were performed using in-house near-infrared spectroscopy methodology at the Skretting ARC laboratory as previously described by Torstensen et al. (Reference Torstensen, Espe, Sanden, Stubhaug, Waagbø, Hemre, Fontanillas, Nordgarden, Hevrøy, Olsvik and Berntssen2008). Fatty acid analysis of the experimental diets was conducted using gas chromatography and flame ionization detection (Grahl-Nielsen and Barnung, Reference Grahl-Nielsen and Barnung1985). To determine tissue lipids, samples of liver and fillet were freeze-dried and the lipid fraction was extracted using dichloromethane-methanol (8 : 2). Fatty acids were methylated in the presence of sulphuric acid following Segura and López-Bote (Reference Segura and López-Bote2014). The obtained methyl esters of fatty acids were analysed using a gas chromatograph equipped with a flame ionization detector (HP 6890 Series GC System). Fatty acid methyl esters were separated with a J&W GC Column, HP-Innowax Polyethylene Glycol (30 m×0.316 mm×0.25 μm). Nitrogen was used as a carrier gas. After injection at 170°C, the oven temperature was raised to 210°C at a rate 3.5°C/min, then to 250°C at a rate of 7°C/min and held constant for 1 min. The flame ionization was held at 250°C. Fatty acid methyl ester peaks were automatically identified by comparing their retention times with those of authentic standards (Sigma-Aldrich, Alcobendas, Spain).
Gene expression analysis
Total RNA extraction from salmon liver was carried out with TRIzol reagent (Invitrogen, Carlsbad, CA, USA) and the GenElute Mammalian Total RNA Miniprep Kit (Sigma-Aldrich Corporation, St. Louis, MO, USA) following the manufacturer’s instructions. Tissues were disrupted in a mixer mill MM-400 (Retsch, Stuttgart, Germany). Potential genomic DNA was eliminated using DNAse treatment (Qiagen, Hilden, Germany). Total RNA concentration was then measured by spectrophotometry (Epoch TM, BioTek, Winoosky, VT, USA) combined with the Take3TM Micro-Volume Plate (BioTek, Santa Barbara, CA, USA). The extracted A260/A280 ratio was used to calculate the quantity of RNA from reverse transcription. Reverse transcription was performed using SuperScript VILO Master Mix (Invitrogen, Carlsbad, CA, USA) to obtain cDNA from 1.5 µg of RNA of each sample.
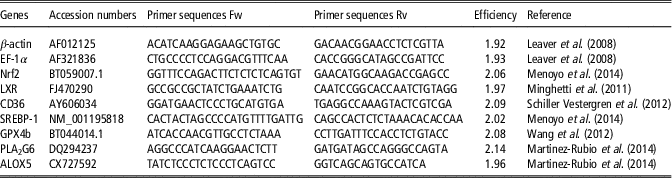
Real-time quantitative reverse transcription-polymerase chain reaction (qRT-PCR) was carried out to determine the relative gene expression of seven target genes and two control reference genes. It was performed in a 7300 Real Time PCR System (Applied Biosystems, Foster City, CA, USA). Target genes (Table 2) were analysed according to published primer pairs and conditions: LXR (Minghetti et al., Reference Minghetti, Leaver and Tocher2011), cluster of differentiation 36 (CD36) (Schiller Vestergren et al., Reference Schiller Vestergren, Wagner, Pickova, Rosenlund, Kamal-Eldin and Trattner2012), glutathione peroxidase 4b (GPX4b) (Wang et al., Reference Wang, Harris, Espinoza, McClain and Gallagher2012), SREBP-1 and nuclear factor-like 2 (Nrf2) (Menoyo et al., Reference Menoyo, Sanz-Bayón, Nessa, Esatbeyoglu, Faizan, Pallauf, de Diego, Wagner, Ipharraguerre, Stubhaug and Rimbach2014), phospholipase A2 (PLA2G6) and arachidonate 5-lipoxygenase (ALOX5) (Martinez-Rubio et al., Reference Martinez-Rubio, Evensen, Krasnov, Jørgensen, Wadsworth, Ruohonen, Vecino and Tocher2014). Housekeeping genes, β-actin and eukaryotic translation elongation factor 1 alpha (EF-1α), were assayed as described by Leaver et al. (Reference Leaver, Villeneuve, Obach, Jensen, Bron, Tocher and Taggart2008). With 20 µl as total volume of each reaction/sample, the qRT-PCR was carried out with 10 µl of SYBR® Green Master Mix (Applied Biosystems), primer concentrations according to the literature and ~90 ng of cDNA template. The mixture was heated to 95°C for 20 s, amplified during 40 cycles of which each one consisted of a denaturation step at 95°C for 15 s and an annealing-extension step at 56°C to 65°C for 30 to 60 s, also depending on the gene. Assays were performed in triplicate always including negative controls with no template but nuclease-free water. Analysis of the results was based on the Cycle threshold (C t ) using the automatic C t provided by the qPCR software (7300 System SDS Software, Version 1.4; Applied Biosystems). The gene amplification efficiencies under our experimental conditions are shown in Table 2.
Genes, accession numbers, forward (Fw) and reverse (Rv) primers used for quantitative polymerase chain reaction and amplification efficiencies

EF-1α =eukaryotic translation elongation factor 1 alpha; Nrf2=nuclear factor-like 2; LXR=liver X receptor; CD36=cluster of differentiation 36; SREBP-1=sterol regulatory element binding protein 1; GPX4b=glutathione peroxidase 4b; PLA2G6=phospholipase A2; ALOX5=arachidonate 5-lipoxygenase.
Statistical analysis
The impact of dietary RESV on animal performance and tissue fatty acid composition was analysed as a mixed-effect model in which the tank was treated as the experimental unit (random effect) and RESV inclusion level was considered a fixed effect. The Tukey’s test was used to separate treatment means and regression analysis was used to measure the linear and quadratic response to dietary RESV. Relations in gene expression among levels of RESV were examined via linear and quadratic regression analysis using a mixed-model approach. Changes in gene expression resulting from the comparison of the RESV groups 0.5, 1.5 or 2.5 relative to the control (0) were determined using a mixed-effect model in which the treatment was considered as a fixed effect and the tank as a random effect. When efficiencies were different from 2 (E≠2) they were used to transform the obtained C t -values and to make the results more comparable (Steibel et al., Reference Steibel, Poletto, Coussens and Rosa2009). Gene expression was normalized with the geometric mean of the two reference genes. Statistical analyses were performed with the software package of SAS (release 9.2; SAS Institute Inc., Cary, NC, USA).
Results
Effect of resveratrol on salmon performance
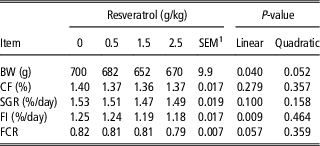
Average final BW of fish was reduced following a linear and quadratic pattern (R 2=0.73; P⩽0.05) with the maximal weight depression happening in fish fed the 1.5 g/kg RESV diet (Table 3). Feed intake decreased linearly (R 2=0.69; P=0.009) with increasing levels of dietary RESV (Table 3). In addition, feed conversion ratio tended to decrease linearly (R 2=0.47; P=0.057; Table 3) as RESV increased in the diet. Feeding RESV did not show significant effects on specific growth rate and condition factor.
Effect of the different levels of dietary resveratrol on Atlantic salmon performance

CF=condition factor; SGR=specific growth rate; FI=feed intake; FCR=feed conversion ratio.
1 SEM (n=2 tanks per treatment).
Effect of resveratrol on tissue fatty acid composition
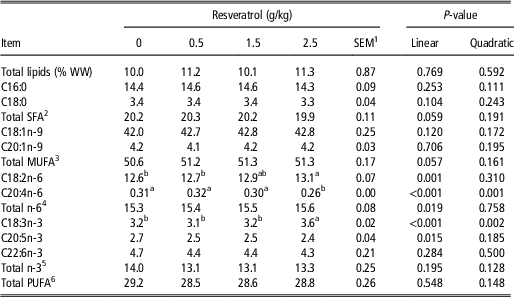
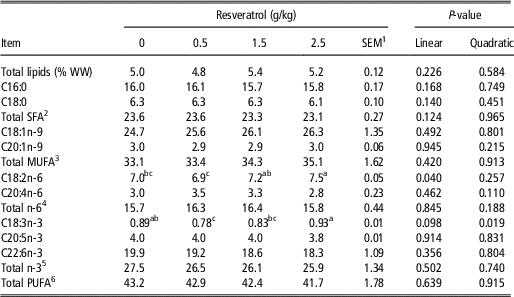
Feeding salmon with RESV did not affect the composition of total saturated fatty acids, total monounsaturated fatty acids and total lipids in the fillet (Table 4). Total polyunsaturated fatty acids composition was not affected but the percentages of some individual fatty acids changed. The percentage of C18:2n-6 increased linearly in response to the incremental levels of RESV (R 2=0.85; P=0.001). However, the percentage of AA followed a linear and a quadratic response (R 2=0.96; P<0.001 and P=0.001, respectively) achieving a maximum at 0.5 g RESV and a minimum at 2.5 g RESV. The percentages of some n-3 fatty acids were also affected by RESV. A linear and a quadratic response (R 2=0.97; P<0.001 and P=0.001, respectively) was observed for C18:3n-3, which attained a minimum percentage at 0.5 g RESV and a maximum level at 2.5 g RESV. In addition, the percentage of EPA decreased linearly with increasing levels of dietary RESV (R 2=0.64; P=0.01).
Effect of the different levels of dietary resveratrol on fatty acid composition (% of total fatty acids) in Atlantic salmon fillets

WW=wet weight.
1 SEM (eight observational units and two tanks n=2 per treatment).
2 Total saturated fatty acids (SFA) includes additionally C14:0, C17:0 and C20:0.
3 Total monounsaturated fatty acids (MUFA) includes additionally C16:1, C17:1, C18:1n-7 and C22:1.
4 Includes additionally C18:3, C20:2 and C20:3.
5 Includes additionally C18:4, C20:3, C20:4 and C22:5.
6 Total polyunsaturated fatty acids (PUFA) include the sum of total n-6 and n-3 fatty acids.Values within a row with different superscripts differ significantly at P<0.05.
As shown in Table 5, feeding RESV did not affect the hepatic composition of total lipids, total saturated fatty acids and total polyunsaturated fatty acids. This is in agreement with results obtained for fillets. The percentage of C18:2n-6 increased linearly (R 2=0.77; P=0.04) in response to the increasing levels of dietary RESV. In contrast to results for the fillet, RESV did not influence the percentages of AA and proportion of EPA in the liver. Finally, the percentage of C18:3n-3 was lowest in fish fed the 0.5 g RESV and highest in fish fed the 2.5 g RESV (R 2=0.75; P=0.01), as observed in the fillet.
Effect of the different levels of dietary resveratrol on fatty acid composition (% of total fatty acids) in Atlantic salmon livers

WW=wet weight.
1 SEM (8 observational units and two tanks n=2 per treatment).
2 Total saturated fatty acids (SFA) includes additionally C14:0, C17:0 and C20:0.
3 Total monounsaturated fatty acids (MUFA) includes additionally C16:1, C17:1, C18:1n-7, C22:1 and C24:1.
4 Includes additionally C18:3, C20:2 and C20:3.
5 Includes additionally C18:4, C20:3, C20:4 and C22:5.
6 Total polyunsaturated fatty acids (PUFA) include the sum of total n-6 and n-3 fatty acids. Values within a row with different superscripts differ significantly at P<0.05.
Effect of resveratrol on gene expression
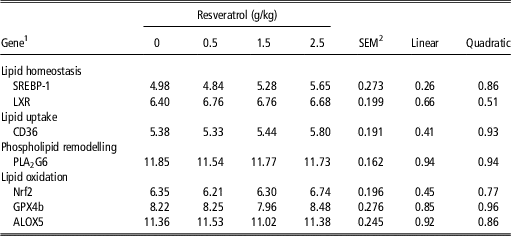
Dietary RESV had no significant effects on the relative expression of genes involved in lipid homeostasis (SREBP-1, LXR), lipid uptake (CD36), phospholipid remodelling (PLA2G6) and lipid oxidation (Nrf2, GPX4b, ALOX5) (Table 6).
Effect of dietary resveratrol on Atlantic salmon liver gene expression

1 Values are increments of cycle threshold (ΔC t ) of target gene relative to the housekeeping. C t values are inversely related to the mRNA abundance.
Nuclear factor-like 2 (Nrf2); liver X receptor (LXR); cluster of differentiation 36 (CD36); sterol regulatory element binding protein 1 (SREBP-1); glutathione peroxidase 4b (GPX4b); phospholipase A2 (PLA2G6); arachidonate 5-lipoxygenase (ALOX5).
2 SEM (eight observational units and two tanks n=2 per treatment).
Discussion
Effect of resveratrol on salmon productive traits
In the present study, increasing dietary RESV concentrations reduced salmon final BW and decreased feed intake, especially at the highest concentrations (1.5 and 2.5 g/kg RESV). Dietary RESV depressed feed intake and weight gain in rodents (reviewed by Malhotra et al., Reference Malhotra, Bath and Elbarbry2015) as well as in blunt snout bream (Zhang et al., Reference Zhang, Yan, Tian, Jiang, Li and Liu2018) and rainbow trout (Torno et al., Reference Torno, Staats, Pascual-Teresa, Rimbach and Schulz2017). However, Valenzano et al. (Reference Valenzano, Terzibasi, Genade, Cattaneo, Domenici and Cellerino2006) reported that the inclusion of up to 0.6 g/kg RESV in the diets of Nothobranchius furzeri did not affect fish feed intake or growth. Considering that grape-derived phenolic compounds are bitter it is possible that poor diet palatability contributed to the intake-depressing effect of RESV (Torno et al., Reference Torno, Staats, Pascual-Teresa, Rimbach and Schulz2017). Also, it has been hypothesized that RESV might negatively affect feed intake by regulating neuropeptide Y and agouti-related protein expression (Kim et al., Reference Kim, Lee, Han, Mar, Kim and Nam2010). Despite its negative impact on feed intake, feeding RESV tended to improve feed conversion ratio (linear decrease from 0.82 at 0 g/kg RESV to 0.79 at 2.5 g/kg RESV, P=0.057). Fiesel et al. (Reference Fiesel, Gessner, Most and Eder2014) reported improved feed efficiency in pigs fed diets rich in grape polyphenols. These authors (Fiesel et al., Reference Fiesel, Gessner, Most and Eder2014) speculated that improvements in feed conversion ratio from RESV feeding might involve changes in gut microbiota.
Effect of resveratrol on tissue fatty acid composition and lipid metabolism
In contrast to previous reports in which RESV was found to reduce palmitic acid in rat hepatocytes (Momchilova et al., Reference Momchilova, Petkova, Staneva, Markovska, Pankov, Skrobanska, Nikolova-Karakashian and Koumanov2014), in our study RESV did not affect the composition of saturated fatty acids in the fillet and liver of salmon. On the other hand, the impact of dietary RESV on single PUFAs was tissue specific. In liver, RESV did not affect the percentages of total n-3 and n-6 fatty acids. Conversely, the percentages of C18:2n-6 increased in the fillet and liver of fish fed the 2.5 g/kg RESV diet, which is in agreement with previous findings in rat hepatocytes (Momchilova et al., Reference Momchilova, Petkova, Staneva, Markovska, Pankov, Skrobanska, Nikolova-Karakashian and Koumanov2014). Also, the percentages of C18:3n-3 increased with dietary RESV in both fillet and liver. In contrast to results from the same report (Momchilova et al., Reference Momchilova, Petkova, Staneva, Markovska, Pankov, Skrobanska, Nikolova-Karakashian and Koumanov2014), however, we found that EPA decreased in the fillet of fish fed the 1.5 g/kg RESV diet. Moreover, the percentages of DHA in the fillet and those of EPA and DHA in the liver were not affected by dietary RESV. Unlike present data in salmon dietary RESV has recently been shown to increase EPA and DHA levels in farmed rainbow trout fed diets low in fish oil (Torno et al., Reference Torno, Staats, Pascual-Teresa, Rimbach and Schulz2017). According to Torno et al. (Reference Torno, Staats, Pascual-Teresa, Rimbach and Schulz2017) the higher EPA and DHA in trout fed RESV are partially explained by an increase on delta 6 desaturase activity in the liver. This enhanced bioconversion from C18:3n-3 to EPA and DHA exerted by dietary RESV is not observed in the present study. By contrast, we observed C18:3n-3 accumulation in the liver and fillet and a lack of effect on DHA and even a decrease of EPA percentages in the fillet. Trout species are more active than salmon in fatty acid desaturation and differences exist on this pathway regulation by fatty acids (Turchini et al., Reference Turchini, Torstensen and Ng2009). Therefore it might be plausive to speculate that RESV effects on delta 6 desaturase activity and hence on the pathway of the biosynthesis of n-3 LC-PUFAs is species-specific. As expected, we noted that the amount of AA in salmon fillets was reduced by RESV. Resveratrol has been shown to inhibit the membrane release of AA by decreasing PLA2 activity (Moreno, Reference Moreno2000). In the present study, the expression of liver PLA2G6, the calcium independent form, was not affected by RESV. Moreover, the expression of ALOX5, an enzyme responsible for the synthesis of leucotrienes from AA (Gilbert et al., Reference Gilbert, Bartlett, Waight, Neau, Boeglin, Brash and Newcomer2011), remained unchanged across treatments. Therefore, the herein reported effect of RESV on fillet AA remains elusive.
Total fat in fillet and liver was not affected by RESV feeding, which is consistent with the lack of effects on the expression of genes encoding proteins involved in lipid homeostasis (LXR and SREBP-1) and uptake (CD36). This is in agreement with Torno et al. (Reference Torno, Staats, Pascual-Teresa, Rimbach and Schulz2017) who observed negligible changes in mRNA expression of genes involved in lipid metabolism such as peroxisome proliferator-activated receptor alpha, carnitine palmitoyltransferase a and c in the liver of rainbow trout fed RESV. By contrast, Zhang et al. (Reference Zhang, Yan, Tian, Jiang, Li and Liu2018) reported changes in hepatic mRNA expression of adipose triglyceride lipase, carnitine palmitoyltransferase a, SREBP-1c and, peroxisome proliferator-activated receptor gamma in blunt snout bream fed high fat diets supplemented with RESV. Also, the mRNA expression of peroxisome proliferator-activated receptor gamma and SREBP was not affected but that of carnitine palmitoyltransferase b and fatty acid synthase increased in zebra fish embryos exposed to RESV (Caro et al., Reference Caro, Sansone, Amézaga, Navarro, Ferreri and Tueros2017). Discrepancies between studies might be related to species differences. Also the dosage of RESV used is different among studies and this is might be an important fact to detect differences on gene expression as noticed by Torno et al. (Reference Torno, Staats, Pascual-Teresa, Rimbach and Schulz2017).
Effect of resveratrol on antioxidant signalling
Resveratrol has been reported to prevent oxidative damage in obese rats by reducing superoxide production (Avila et al., Reference Avila, Marques, Luciano, Vitto, Engelmann, Souza, Pereira, Pinho, Lira and De Souza2013). Furthermore, RESV has been found to enhance endogenous antioxidant enzymes (Robb et al., Reference Robb, Page, Wiens and Stuart2008). Nonetheless, in the present study we were unable to detect changes in Nrf2 and GPX4b gene expression. The transcription factor Nrf2 orchestrates the expression of a number of antioxidant enzymes such as superoxide dismutase and glutathione contributing thereby regulating the cellular redox homeostasis (Keum and Choi, Reference Keum and Choi2014). In the present study RESV did not affect steady state mRNA levels of Nrf2, GPX4b, ALOX5 and PLA2G6 which might be attributable to its low bioavailability and tissue distribution. After 6 h of intra-gastric administration of RESV to pigs, only 0.5% of the administered dose was recovered in tissues such as the liver (Azorín-Ortuño et al., Reference Azorín-Ortuño, Yáñez-Gascón, Vallejo, Pallarés, Larrosa, Lucas, Morales, Tomás-Barberán, García-Conesa and Espín2011). In addition, it has been shown that dietary fat decreases RESV absorption (La Porte et al., Reference La Porte, Voduc, Zhang, Seguin, Tardiff, Singhal and Cameron2010). It is likely, therefore, that the high fat content of salmon diets might have contributed to aggravate the relatively low bioavailability of RESV. Based on data reported herein it seems reasonable to suggest that dietary RESV impairs final BW without favourably altering fatty acid composition in Atlantic salmon. Moreover, the negative impact of RESV on FI and BW even at the lowest dietary concentration questions its inclusion in Atlantic salmon feeds.
Acknowledgements
This research was supported by the EU grant MC-IAPP GA285856. The authors gratefully acknowledge the support of a fellowship from Escuela Internacional de Posgrado(EIP) from Campus de Excelencia Internacional Moncloa, Madrid and the H. Wilhelm Schaumann foundation (Hamburg, Germany) for one of the authors (G. Kühn).
Declaration of interest
The authors declare no conflict of interest.
Ethics statement
All experimental procedures were performed according to the Norwegian Animal Research Authority (FDU) guidelines.
Software and data repository resources
None of the data sets were deposited in an official repository.