

Spatialization and disease control have been a major theme in scholarship on the history of medicine and public health in various contexts in the world. This is especially the case for the colonial British in India and Australia, imperial US in the Philippines, and the hyper- and semi-colonial contexts in East Asia (see respectively Arnold Reference Arnold1993; Anderson Reference Anderson2003; Anderson Reference Anderson2006; Rogaski Reference Rogaski2004). From examining how the state responded to epidemics and race to map San Francisco's Chinatown (Shah Reference Shah2001) to critiquing “dominant Western views of all of Asia as a singularly pathological space” (Peckham Reference Peckham2016), space, surveillance, and disease control over humans and non-human factors during epidemics have been inextricably intertwined. Attention to the role of actual disease maps in processes of disease surveillance and control in specific places, however, has been largely absent in this scholarship. Some kind of maps are present in all of these works but they are mostly neighborhood, city, regional, or national maps of the places studied, or the exceptional climographic, white settlement and race-based “hybrid” maps of Australia,Footnote 1 but not specifically disease maps.
Scholars have extensively written on the history of cartography of the world as well as the different but comparably sophisticated cartographic traditions within East Asia,Footnote 2 but just a few geographers have focused on medical mapmaking within the European cartographic tradition. One approach they have taken is to see how disease maps are as important for medical surveillance as they are for warfare and military defense and, although often presented as research tools, medical maps are just as much “persuasive graphics,” namely visual rhetorical strategies that promote an argument, a viewpoint, general public awareness, or the goals of a specific institution.Footnote 3 Following along this line of reasoning, medical maps have been read as statements in an argument or as evidence furthering a specific hypothesis. In these cases, they functioned to visualize a possible causal relationship. On the one hand, disease incidence, and on the other, possible causes – the climate or weather, water and air quality, geological features such as elevation, waterways and mountains, or something else, such as an unknown poison or contaminant in the environment. Researchers often used them to think through the relationship between the nature of any given disease and the specific environment that produced it.Footnote 4
Chinese medical and other sources contain extensive evidence of how Chinese physicians linked geography and climate to many different types of diseases (see Hanson Reference Hanson2011). Disease maps, however, did not appear in China until western physicians starting publishing them between 1878 and 1897 in their medical reports for the China Imperial Maritime Customs Bureau's Customs Gazette. Disease maps appear in Europe rather late as well. The earliest European example of disease maps relate to a plague epidemic during 1690–92 in Bari province of Naples, Italy. The then royal auditor and military governor of the province included two maps in his official report on a plague outbreak that occurred there to justify the expenses incurred from the troops he used to cordon off infected areas from non-infected ones.Footnote 5 To support an argument on financial outlay, these earliest late-seventeenth-century Italian plague maps focused more on the military means to contain the epidemic than its diffusion or possible etiology. Focus on disease diffusion first occurred a century later in a map of the 1797 yellow fever epidemic in Philadelphia.Footnote 6 During the next eighty years before the first maps of diseases in East Asia were published, disease mapping became an increasingly important visual technology for physicians working out answers to the pressing epidemiological questions of their day. John Snow's map of the 1854 cholera epidemic in London demonstrating a cluster of cases around the Broad street pump in the Soho neighborhood is the most exemplary and well-studied map in this graphic genre.Footnote 7
Thus in the history of medicine and public health the presence of disease maps themselves raise various historical questions: when did they first appear in publications, in what kinds of sources, what made them possible, who found them useful, and what kind of work did they do for those who created them? Their production required at least two requirements: namely a medical consensus on disease classification and formal institutions that gathered vital statistics on mortality and morbidity. The maps themselves made disease across space within large populations newly visible. They thereby lent further support to more coercive public health interventions during wide-scale epidemics such as mandatory quarantine measures, forced restrictions on movement, compulsory removal of the sick from their homes to hospitals, and mass incineration of corpses.
Although disease maps were neither indigenous to China nor part of the Chinese medical tradition they were integral to western medical expansion and scientific exploration within China. These new disease maps in China depended on the late nineteenth-century consensus on disease classification as well as a western network of institutions collecting data on epidemics and vital statistics related to global imperial and military expansion. In this article, I examine the major transformations in the various functions the earliest maps of disease in China served in their first 50 years from the late 1870s to the end of the 1920s. What made these disease maps newly possible, what they made newly visible, and the various work they did for their authors form the core questions of this analysis. They played roles not only in forming new conceptions of epidemic diseases but also in legitimating new forms of public-health governance over both human and non-human populations.
Medical maps may also perform a different type of rhetorical work when people marshaled them to legitimate colonial public-health governance, such as quarantine measures, mass burials, cremation, and other forms of state management of the living and dead bodies during epidemics. Mapping diseases thus offered a means for other ends when they legitimated new medical concepts and related novel public health practices. As such they also left traces in what they depicted of the extent as well as limits of power of public health authorities over local populations.Footnote 8 As persuasive graphics, disease maps did complex work ranging from analytical tools to clarify yet unknown causal relationships to post-facto legitimating devices as tools of empire and national sovereignty for expanding governmental control over human and non-human populations.Footnote 9
Maps of Diseases in China
More than 50 maps of diseases in China were published from 1878 to 1929. Their changes over this period reveal a visual history of the major transformations in modern medicine from the mid-nineteenth-century peak of medical geography through the early-twentieth-century ascent of bacteriology, virology, and laboratory medicine. They went hand in hand with the new medical statistics of the nineteenth century: both medical maps and numbers made visible causal relations never before seen in large human populations. Disease maps were comparable in this way to the petri dishes that took on a new role in Robert Koch's laboratory in the 1870s not only to visualize microorganisms in a different way than the microscope but also to prove they caused disease. Disease maps were also a state-of-the-art scientific technique for isolating the underlying causes of disease before the 1870s and through the end of the nineteenth century. These Chinese disease maps not only trace a transition in visualizing the geography of disease in China, but also graphically illustrate the major transformations of modern biomedicine, particularly of human and sylvatic plague from the 1870s to the 1920s, wrought on East Asian soil.
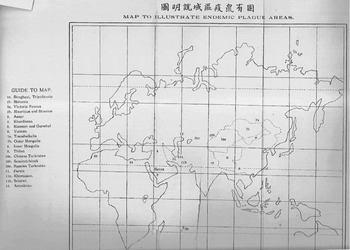
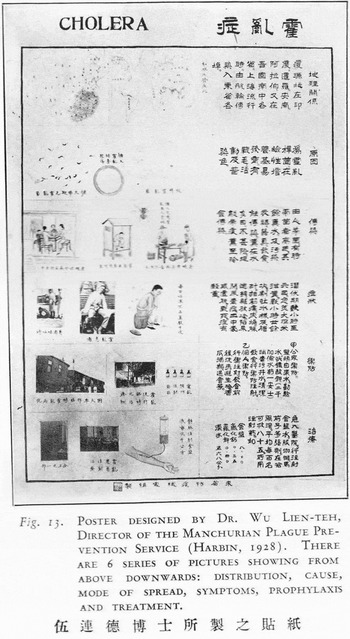
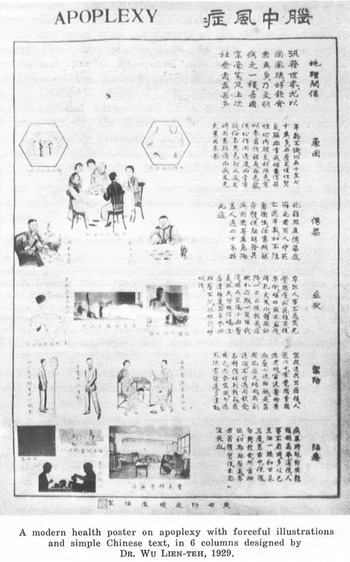
During the first 50 years of their use, they functioned as analytical tools intended to visualize the relationship between space and disease as well as the technologies of power that legitimated colonial, semi-colonial, hypercolonial, and nationalist control. City streets and governmental infrastructure become significantly visible, for instance, only in the maps of the 1894 plague epidemic in British Hong Kong and the 1910–11 Manchurian plague epidemic in Russian-controlled Harbin.Footnote 10 Other maps of the Manchurian plague epidemic, by contrast, provided evidence of Chinese state power over its population and reinforced its sovereignty in regions over which other nation states also claimed rights. The earliest Chinese disease maps, like nineteenth-century vital statistics and laboratory medicine's microscope and petri dishes, attempted to make causal relations newly visible and thus work out what caused the deadly epidemics of the time. During the plague epidemics of first 1894 in Hong Kong, later in 1910, and again in 1921 in China, however, new kinds of disease maps functioned more to legitimate colonial-colonized power dynamics and, later, Chinese state-populace relationships than to elucidate causal disease-agent connections. Finally, the first disease maps that were published in vernacular Chinese (not in English, German, French, Japanese, or Russian) and intended for the Chinese populace (not fellow physicians and scientists) compared the distribution of bubonic plague, pneumonic plague, cholera, and apoplexy in China with that of their world distribution. Published on public-health posters in 1921 (bubonic and pneumonic plague), 1928 (cholera), and 1929 (apoplexy), they attempted to convince a wary public of a novel way of seeing epidemic disease, themselves, and their place in a newly globalizing world.Footnote 11
The Centrality of Nosology
Western publications first began to include reports on medical work and health conditions in China after the First Opium War (1839–42) that granted indemnity to Britain, opened up five treaty ports (Shanghai, Canton, Ningbo, Fuzhou, Amoy), and ceded Hong Kong Island to the British.Footnote 12 An important change in documentation on epidemics followed the even more humiliating Second Opium War (1856–60). One of the many consequences of Chinese defeat was that ten more treaty ports were forced open and through them foreign powers gained more access into China's interior. Physicians settled in China closely behind the French, British, Russian, and U.S. military and diplomatic corps. Sir Patrick Manson (1844–1922), retrospectively considered the founder of tropical medicine, was based first for five years in Formosa (now Taiwan, 1866–70), then for thirteen years in Amoy (now Xiamen, 1870–83), one of the newly opened treaty ports on the southeast Chinese coast, and finally, spent another six years in British Hong Kong (1883–89).Footnote 13
Within a year after Manson moved to Amoy, in 1871, the British official Robert Hart (1835–1911), then the Inspector General of China's Imperial Maritime Customs Service (IMCS), decided to take advantage of the newly expanded infrastructure of the Customs Service as a clearing-house for medical reports across the Qing empire, showing how closely linked were commerce and public health concerns in the relatively new treaty-ports of Qing China.Footnote 14
It has been suggested to me that it would be well to take advantage of the circumstances in which the Customs’ Establishment is placed to procure information with regard to disease amongst foreigners and natives in China, and I have, in consequence, come to the resolution of publishing half-yearly in collected form all that may be obtainable. (Hart Reference Hart1871, 112)Footnote 15
Hart assigned Dr. Robert Alexander Jamieson of Shanghai to be in charge of readying the medical reports from physicians stationed in various regions and cities of China for publication that year.Footnote 16 For the next forty years, the Inspector General published semi-annual Medical Reports in the Customs Gazette from European and American physicians stationed inland, along the coastline in China's treaty ports, and in Japan. The authors of the first History of Chinese Medicine (1936) in English remarked: “The importance of the early volumes of the Customs Medical Reports can hardly be exaggerated” (see Wong and Wu Reference Wong and Lien-teh1936, v. 1, 398–9). This was the first time a publication regularly published reports intended for physicians without the limitations on space in contemporary medical journals.
In order to be able to compare the data in these new medical reports about China in a meaningful way all the physicians had to agree on the same disease classification system. These unprecedented detailed reports themselves reinforced western nosology (i.e., disease classification) through the new efforts to determine the geographic distribution of disease in China. Through Jamieson's editorship of these medical reports, Western disease concepts based on the nosology of English physician and statistician William Farr (1807–83) became standard for studying China's medical geography and epidemics.Footnote 17 The following quotation from Jamieson's first 1871 editorial in the Medical Reports demonstrates how this new nosology was practically enforced:
I take this opportunity of suggesting through you to the Surgeons to the Customs at the various ports, that for purposes of comparison it is advisable for all to adopt some one recognized classification of disease. The Nomenclature of Diseases (London 1869), drawn up by a Committee appointed by the Royal College of Physicians of London, though doubtless not the best possible, is in the hands of nearly every member of the profession, and adherence to it would for this reason, if for no other, facilitate the collection of statistics from the tables supplied by the Surgeons. I shall be happy to receive and compare opinions on this question, and I will, if such expressions of opinion are forwarded to me, inform each Surgeon as soon as possible in what direction the majority incline. (Jamieson Reference Jamieson1871, 3)
This was carried out through the expectation that all physicians sending medical reports to Jamieson should rely on the Royal College of Physician's recently published The Nomenclature of Diseases (1869) (see Royal College of Physicians 1869). Jamieson had little patience with Chinese concepts of disease, stating his position clearly from the beginning of his editorship. Twice, in his Reports of 1872, he juxtaposed mortality tables based on Chinese and on western nosology in order to denigrate the former:
Premising that the ignorance of Chinese practitioners is only equaled by their conceit, and that their nosology is only slightly more absurd than their therapeutics, I give the following table of causes of death, compiled from Chinese sources. As a classification it is utterly worthless, but from it one or two important facts can be extracted.Footnote 18
Jamieson acquired this morbidity data on Chinese “nosology” (disease classification) from a certain Mr. Penfold, the Superintendent of Police for the English and American settlements in Shanghai, who was in a liminal position between civic and sanitary policing. As medical liaison with the IMCS in Shanghai, Jamieson could thus gain access to contemporary medical data on the native population from the new police institutions established in the by now decade-old foreign settlements. His commentary reveals ambivalence toward Chinese nosology, however, by sometimes translating Chinese terms into one-to-one western equivalents and other times either narrowing down their range of conceptual possibilities or indicating his disdain for their coverage of too many symptoms.
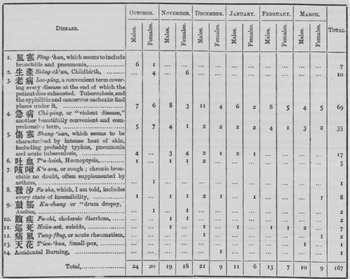
In one of the disease tables (fig. 1), for example, he easily translated some Chinese illness categories into what he considered to be obvious western equivalents: “2. 生產 Shêng-ch'an, Childbirth”; “6. 吐血 T'u-hsieh, Haeomoptysis (coughing up blood)”; “10. 腹疾 Fu-chi, choleraic diarrhea”; “11. 巡死 Hsün-szû, suicide”; “12. 通風 T'ung-fêng, or acute rheumatism”; and 13. 天花 T'ien-‘hua, Small-pox.” Other Chinese medical terms, however, he realized covered a wider range than just one western disease so he attempted to narrow down their possibilities: “1. 風寒 Fêng-‘han, which seems to include bronchitis and pneumonia”; “5. 傷寒 Shang-‘han, which seems to be characterized by intense heat of skin, including probably typhus, pneumonia, and acute tuberculosis”; “7. 咳嗽 K'o-sou, or cough; chronic bronchitis no doubt, often supplemented by asthma”; and “9. 鼓脹 K'u-chang or ‘drum dropsy,’ Ascites.”
Alexander Jamieson, Report on the Health of Shanghai, 1872.

Yet other Chinese terms Jamison clearly found too broad to be useful: “3. 老病 Lao-ping, a convenient term covering every disease at the end of which the patient dies exhausted. Tuberculosis, and the syphilitic and cancerous cachexia (severe wasting away) find places under it”; “4. 急病 Chi-ping, or ‘violent disease,’ another beautifully convenient and comprehensive term”; and “8. 發沙 Fa-sha, which, I am told, includes every state of insensibility.”Footnote 19 Jamieson's attempt at translation in this table thus notably reveals three early translation strategies for dealing with issues of medical commensurability (i.e., Shêng-ch'an=childbirth), similitude (i.e., Fêng-han=bronchitis and pneumonia), and incommensurability (i.e., Chi-ping= “‘violent disease,’ another beautifully convenient and comprehensive term”).Footnote 20
Although the sample size of just 167 total patients over six months from October 1871 to March 1872 is far too small to make any generalizations about the health of the native population at that time, the 13 Chinese disease categories nonetheless indicate some of the worst illnesses among the Chinese people that came to the attention of the office of the Settlement's Police Superintendent: most died from Lao-bing (69), or “tuberculosis, and syphilitic and cancerous cachexia,” according to Jamieson. Then they died from Chi-ping (35), or the “violent disease,” which Jamieson found too broad to be useful, but likely referred to a range of acute infectious diseases. The third largest class of disorders came under Shang-‘han (17), which he thought included typhus, pneumonia, and acute tuberculosis, and recognized that it broadly covered the symptom of “intense heat of skin.” Childbirth (10), Fa-sha or “insensibility” (8), Fêng-‘han or “bronchitis and pneumonia” (7), suicide (7), and T'u-hsieh, or “Haemoptysis” (5) were also significant medical problems that came under the purview of the Shanghai settlement police. What Jamieson considered to be cases of chronic bronchitis, ancitoes, choleraic diarrhea, acute rheumatism, smallpox, and accidental burning entered this record with just one or two deaths. Jamieson's disease table is an early example of the effort not only to fit Chinese nosological terms into western nosology but also to record the rudimentary vital statistics among the local Chinese population that would later be required to create the first maps of diseases in China.Footnote 21
Etiology: Maps as Analytical Tools
Foreign physicians dispersed across China gathered medical data, collected vital statistics, and published the first maps of diseases in China in their Medical Reports for the next 40 years between 1871 and 1910. In these Medical Reports the first maps of disease in China were published over two decades between 1878 and 1898. Among these six disease maps, we find the first maps of plague in China, focusing first on the 1871–3 outbreaks in Yunnan and then the 1897–8 outbreaks in Manchuria. Another map is the first to depict the courses of cholera throughout East Asia and over the course of the nineteenth century. Two more maps focus on beriberi for the first time depicting its distribution in Japan and also situating its East Asian presence within a world map. These six maps can be divided into two categories: they either depicted the geographic distribution of a disease, namely beriberi in Japan and the World (1880) or traced the course of a particular epidemic – plague in Yunnan (1878) and in Manchuria (1898) and also cholera in East Asia (1879). In addition to the existence of the IMCS, institutionalization of regular medical reports, and presence of medical officers in Chinese cities, a shared western medical nosology was one of the key factors that made visualizing disease in East Asia newly possible at that time. The maps themselves arguably instantiate the epistemological rupture between traditional Chinese and western medical nosology; even though many traces of native Chinese disease concepts can be found in these same Medical Reports, they are completely absent from the disease maps themselves.Footnote 22
The First Maps of Plague in China, Yunnan, 1878–79
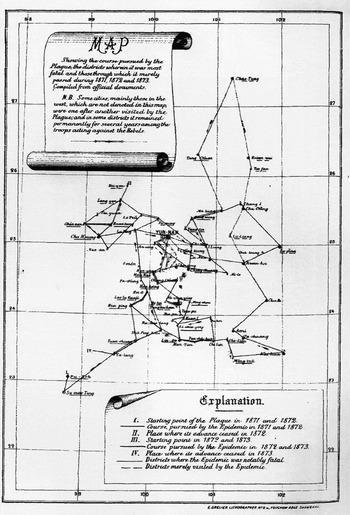
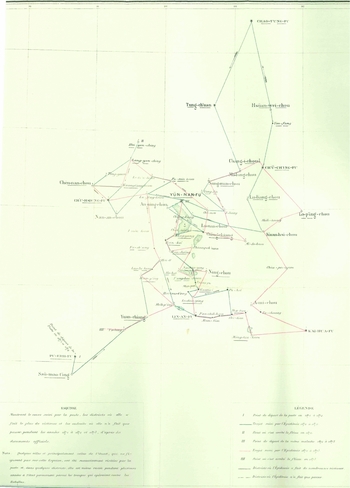
While Dr. Patrick Manson was still stationed in the Amoy treaty port he published the medical report “Notes on the Plague in Yunnan” in 1878, which included not only the first map of a specific epidemic in China but also the first map of plague anywhere outside of Europe.Footnote 23 The map traced the known paths of the plague epidemics there just several years earlier from 1871 to 1873 (fig. 2) (Manson Reference Manson1878, 25–7). He based his report primarily on notes on the plague in Yunnan that the French diplomat Émile Rocher (another member of the IMCS) had submitted, in addition to “private and official memoranda,” and his own observations during a visit there at the time (ibid.).Footnote 24 The following year Rocher included a larger color-coded version of Manson's original in the first volume of his La Province Chinoise de Yün-nan (fig. 3).
Patrick Manson, Map of Plague in Yunnan 1871–3, 1878.

Émile Rocher, Map of Plague in Yunnan, La Province du Yün-nan, 1879.

The first two published disease maps in China thus came out of the context of the Muslim led but multiethnic Panthay Rebellion (1856–1873) against the Qing dynasty in Yunnan. They also represent the efforts of two members of the medical and diplomatic community that witnessed the Rebellion to work out what caused the plague to spread beyond the obvious social chaos and mass migrations during the rebellion.Footnote 25 Manson makes this connection clear on a “scroll-like” note on the upper-left hand side of his map: “N.B. Some cities, mainly those in the west, which are not denoted in this map, were one after another visited by the Plague, and in some districts it remained permanently for several years among the troops acting against the Rebels.” We thus see in these two maps an acknowledgement of the plague's endemicity among the Qing troops as well as diffusion along known commercial routes. Both maps also recorded the local Chinese term for the epidemic, Yang-tzŭ 痒子, meaning severe itching of the skin or pruritus, although both also confidently called the 1871–73 epidemics in Yunnan “bubonic plague.” In the 1882 Epitome that summed up the most important findings of the first decade of these medical reports, the editor C.A. Gordon clarified what was most significant about their observations and, most importantly, designation: “These notes are believed to prove the existence of bubonic plague in China, that of late years the disease spread over a large area of the empire, and that it did not in reality disappear, as believed by some writers” (Gordon Reference Gordon1884, 123–24).Footnote 26
In terms of the political shift “from Qing to China,” with the end of imperial China in 1911 and establishment of a new Chinese nation-state there is neither indication of Yunnan as a Qing province nor specification of its place within the larger Qing empire, or even in the Central Asian region. The map depicts the path of the epidemic from town to town along trade routes using Qing-era district names to ground the epidemic's spread across the region. There are, however, neither political boundaries nor other local geographic markers on either Manson's black-and-white original or Rocher's colored revision. One sees a comparable vagueness of pre-modern boundaries implicit in an earlier map of cholera in the Presidency of Bengal India in 1819, which highlights major waterways along which cholera occurred rather than political boundaries. Just over a decade later an 1831 map of cholera in Poland, by contrast, places Poland as landlocked by Prussian, Russian, and Austrian boundaries.Footnote 27 In the first global map of cholera of 1832 a year later, however, Poland is not even delineated within the large swath of land covered by “Europe” and no provincial boundaries are even given within the “Chinese empire,” perhaps because the map's primary focus is on cholera's transmission across vast expanses of land and seas from India west to Europe and the United States and East to Southeast Asia and East Asia.Footnote 28
In lieu of the Qing provincial boundaries, the 1871–3 plague epidemics in Yunnan province were instead situated in a numerical grid between 22.8–27.4 latitude and 98.7–102 longitude. The international geographic location standard, namely the graticule, that established Greenwich as the zero-reference line (or prime meridian) within the longitude-latitude webbing would not be established for another six years at the 1884 International Meridian Conference. Still Manson's original plague map follows the model of the 1830s global cholera maps, most of which placed the pandemic's course within the global longitude-latitude web.Footnote 29 Yet his connect-the-dots approach reveals the limitations of his data “Compiled from official documents” (see note on map) in the context of the Panthay Rebellion. He concluded the medical report that accompanies this map on the limits of his information in such a context:
I have not been able to include in it the towns of the west; this part of the province being at that time the seat of war between Imperialists and Mahomedans, the information obtainable was quite untrustworthy. However, I am quite certain that the epidemic was constantly present among the Imperial troops operating in this part of the province. (Manson Reference Manson1878, 27)
By placing the locations where plague visited within the longitude-latitude graticule rather than Yunnan's provincial or prefectural boundaries, Manson compensates for the incomplete information by integrating what he considered to be trustworthy data points into an internationally recognized geographic grid. Although bubonic plague was transmitted along more intensely used commercial routes,Footnote 30 the borderless quality of Manson's map of plague in Yunnan also brings into focus the colonialist's attention to inland trading towns, where the French diplomat Rocher and other French were based in Yunnan, and to the commerce as well as plague and military movement that linked them during the Panthay Rebellion.
The Yunnan plague epidemics of the 1870s became later known as the starting point of the “third plague pandemic” that lasted well into the mid-twentieth century and killed an estimated 12 million in China and India alone. However, it was the cholera pandemics of the 1830s and 1860s, and especially the 1873 cholera epidemic in the U.S. (just when the Panthay Rebellion was spreading a plague epidemic across Yunnan), that inspired the first global mapping of cholera to the Americas.Footnote 31 Although China also suffered during the first cholera pandemic in the 1830s, it was the third cholera pandemic that hit many of the new treaty ports along China's coastline, thus threatening the relatively new imperialist European intentions in Chinese markets.
The First Maps of Cholera in East Asia, 1879
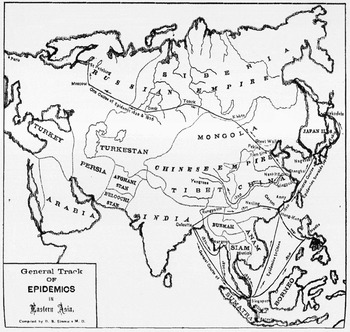
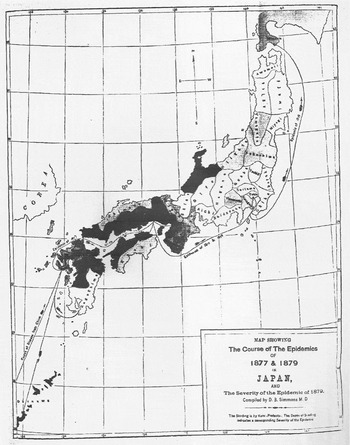
The year after Manson's report on plague in Yunnan, the Medical Reports published in 1879 its second and third disease maps. This time the maps brought into focus for the first time the spread of cholera in “Eastern Asia” from an aerial perspective and scaled dramatically up to include nearly all of the Euro-Asian continent as well as all of Japan (fig. 5). In contrast to the then newly emergent plague epidemic in Yunnan, which had not yet become pandemic on the global stage, the physician Dr. Duane Simmons, who was based in Japan, could rely on Western medical reports from the past half a century on cholera's global spread as well as new comparable medical reports on cholera in Japan.Footnote 32 He was thus able to depict the routes of cholera since 1820 from India, Indonesia, and Thailand to the Philippines, Japan, Russia, and China (Simmons Reference Simmons1879, 9–30).Footnote 33 In contrast to the Lancet's first global maps of cholera in 1831 and 1832 and the 1874 US Congressional Report's US-Euro-centric map of the 1873 cholera epidemic, this East Asian map left out all of Europe and the Americas, only listing “Arabia” and Turkey at the western border and “Paris” at the far western end of an unnamed Europe.Footnote 34
Duane B. Simmons, Map of Cholera in Eastern Asia, 1879.

Duane B. Simmons, 1877 and 1879, Cholera Epidemics in Japan, 1879.

Simmon's “Eastern Asia” cholera map is several orders of magnitude larger in scale than Manson's Yunnan plague map, which may account in part for why he left out the graticule of longitude and latitude lines. He sought to trace instead the “general track” of the epidemics across a vast “Eastern Asia” region. Both doctors nonetheless focused on the direction of the spread of the epidemics, trying to isolate their underlying causes via directionality and temporality.
One can see this clearly in Simmon's second map of cholera, which focused on the epidemics in Japan in 1877 and 1879 (fig. 5). In this map he emphasized the hypothesis of geographic location by using latitudinal and longitudinal lines that indicated cholera's concentration in southwestern Japan between longitude 128 138 and latitude 26 38. Yet in the far lower left hand corner of the map of cholera in Japan, Simmons also noted the “Course of disease from China,” showing that he did not think cholera originated in, or was even endemic to, Japan but rather was transmitted over water from China to Japan. Although the western scientific community had not yet formed a consensus on the cause of either plague or cholera by the late 1870s, it had reached agreement on the nomenclature of these two distinctly different diseases. The emphasis on tracking the spread of the epidemic through time and space in all three medical maps reinforced their authors’ assumptions that some contaminated substance or foul air spread along commercial routes.
The First Map of Beriberi in East Asia, 1880
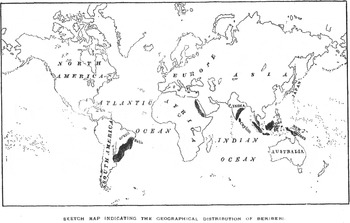
A couple of years later in 1880 within the first major medical report on beriberi in East Asia, Simmons included a distribution map of beriberi in the world (fig. 6). His interpretation represented the opposite conception from that previously of cholera, namely that beriberi's range varied according to geographic location (Simmons Reference Simmons1880, 9–30).Footnote 35 Simmons also produced the two earlier 1879 maps of cholera's spread in Eastern Asia and in Japan, which demonstrates that the two conceptions of cause – anti-contagionist (local environmental factors) versus contagionist (portable contagion or contaminant) – that were often in conceptual conflict with each other could both be reasonable conceptions to a physician who considered the varied character of epidemic diseases at a time when the nosology was agreed upon while the etiology was still being debated.
Duane B. Simmons, Map of Geographical Distribution of Beriberi, 1880.

Within fifteen years after the Medical Reports published Simmons's cholera and beriberi reports, Rocher's and Manson's earlier reports on the 1871–3 plague epidemics in Yunnan proved to be a warning of worse to come in the Far South when in 1894 plague finally reached the British colony Hong Kong. This resulted in the first quarantines imposed on the Chinese population, draconian public health measures to dispose of infected bodies, and the first incidence of organized Chinese protest to western medical interventions.Footnote 36 This was also the same year when, in the same location, two scientists claimed they had discovered the bacterium. The Swiss-French physician from the Pasteur Institute, Alexandre Émile Jean Yersin (1863–1843), isolated the bacterial cause of plague from the buboes – the Yersinia pestis is now named after him – and the Japanese protégé of Koch, Kitasato Shibasaburo (1852–1931), originally thought he had isolated the same bacteria through the blood.Footnote 37 Focused on their bacteriological work, however, neither Yersin nor Kitasato published any maps to complement their competing laboratory research. Nor were maps of the Hong Kong plague epidemic published in the IMCS Medical Reports of the same period. Plague was also transmitted to Japanese-occupied Taiwan shortly afterwards in 1896 and remained a problem during the following decade. Although Japanese physicians recorded plague cases in their medical reports and published articles in German as well as Japanese on their plague research, they did not produce any disease maps of plague in Taiwan either in the 1890s.Footnote 38
The First Maps of Plague in Manchuria, 1897
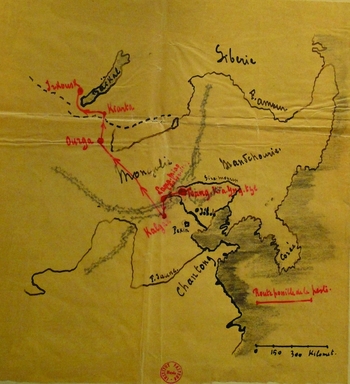
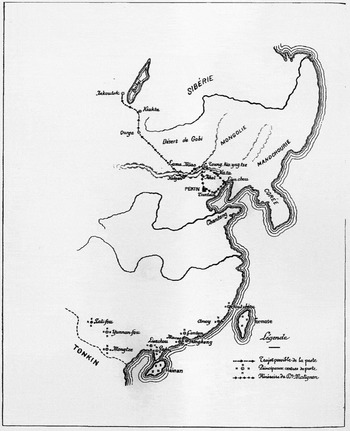
When an epidemic of bubonic plague hit just a year later in 1897 but in the far northeastern Manchuria, the French physician Jean-Jacques Matignon, who, like Yersin, was also associated with the Institut Pasteur in Paris, submitted a medical report to the ICMS that included two maps. He published his observations of the environment and people as well as his medical research on plague and testing of a new plague serum on patients. In the draft of his report, he first roughly sketched the “Route possible de la peste” (“possible route of the plague”), highlighting in red the possible route of the plague from “Toung-kia-yng-tze” and “Kalgan” just north of “Jehol” (Chengde, Rehe province) all the way to “Irkoutsk” (Irkutsk) on Lake Baikal (fig. 7) (Matignon Reference Matignon1898a, Institut Pasteur manuscript). In contrast to Manson's borderless Yunnan plague map, the Manchurian plague epidemic is clearly marked within distinct Qing-era territories: going clockwise from “noon” it reads Siberia, Mandchourie, Corée, Chantong (i.e., Shandong province) with the “F. Jaune” (the Yellow River drawn with a looping line going west), and Mongolie. He submitted two maps with his final 1898 report to the IMCS Customs Gazette (figs. 8–9): the first is an expanded version of his original draft map that now includes the entire southeastern coastline, a second line representing the Yangzi River, Formosa, and Tonkin (i.e., Vietnam) (Matignon Reference Matignon1898b, 1–19).Footnote 39 In addition to the route of the plague epidemic in the far north, this revision also includes the “Principaux centres de peste” (“Principal plague centers”) in the far south, which represents a new conception since Manson's earlier report of “plague reservoirs.”
Jean-Jacques Matignon, “Route possible de la peste” in Manchuria, 1898.

Jean-Jacques Matignon, Map of Possible Route of Plague, Principal Centers of Plague in China, and Matignon's Itinerary, 1898.

Jean-Jacques Matignon, 1896–97 Plague Epidemics in Manchuria, 1898.

This map thus placed the very local epidemic not only along the specific routes “la peste” took, and Matignon's own itinerary as medical observer, but also within the broader scientific conception of principal plague centers (fig. 8) that would be developed even further in the 1920s (see later figs. 24–25). Matignon's revision of his original manuscript map in this way emphasized his own position as observer while at the same time placing this particular epidemic within the broader regional phenomenon of both “Trajet possible de la peste” (“possible path of the plague”) and the “Principaux centres de peste” (“principal plague centers”). Again it is interesting to note that Qing China is not specified as the main political unit but rather placed in a broader geo-political region with its capital indicated as “Pekin” just south of the plague's course and marked politically by its boundary further north from west to east – Sibérie, Mongolie, Mandchourie, and Corée – and to the south with Tonkin.
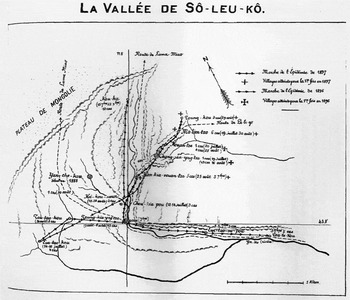
Based on his own observations and collection of reports on the plague epidemic there, Matignon also included a detailed local map of the “Marche de l’Épidemie” of 1896 and 1897 in La Vallée de Sô-leu-kô where he did most of his research on the plague. In contrast to his manuscript map and overview map, this map significantly includes the longitude 11.8 and latitude 43.8 to orient geographically anyone in the world reading his report to the specific location of the plague epidemic's epicenter (fig. 9).
Meanwhile during the same years, following China's construction concession to Russia in 1896, work started on the railway line in July 1897. Russia intended to link the Siberian city Chita through Harbin to the Russian port Vladivostock on the Sea of Japan. Russian workers for the Chinese Eastern Railway (later known as the Southern Manchurian Railway) ended up settling in, and building up Harbin, the town halfway between Chita to the northwest and Vladivostock to the southeast. A plague broke out in the area and threatened Russian imperial intentions over the region. Thus the 1896–97 epidemic of plague that Matignon described and mapped in detail foreshadowed the international crisis over the more famous 1910–11 pneumonic plague epidemic that would put Manchuria at the center of the global stage. In the intervening decade before this crisis, however, medical research in China was building on the previous decades of IMCS medical reports as well as international science such that a consensus on the etiology of bubonic plague was in the process of being worked out within China as well as elsewhere.
Maps as Tools of Empire
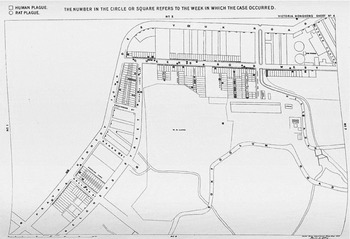
Nearly a decade after the 1894 Hong Kong plague epidemic, William John Ritchie Simpson (1855–1931), Chair of Hygiene at King's College London since 1898, a colleague of Patrick Manson, and one of the founders of the London School of Hygiene and Tropical Medicine established in 1899, included a summary of the scientific findings from that epidemic, and other plague epidemics in the world since then, in his 1903 Report on the Causes and Continuance of Plague in Hong Kong. The coordinated British response to the epidemic in “Victoria Hong Kong” also enabled Simpson to have four detailed disease maps of the extent of plague infection throughout Hong Kong published with his report. The dotted houses in these maps (fig. 10),Footnote 40 indicating the door-to-door occurrence of plague in 1894 Hong Kong, recall John Snow's cholera map centered on the Broad street pump 40 years previously in 1854 London.Footnote 41
W. J. Ritchie Simpson, Map of Human and Rat Plague, Report of the Causes and Continuence of Plague in Hong Kong, 1903.

Yet there were significant differences. These maps depicted not just house-to-house occurrence of human cases, they also gave week-by-week occurrence of sylvatic plague in the colony (see Simpson Reference Simpson1903, 45).Footnote 42 Furthermore, besides much more territory covered as well as records of weekly temporal demarcation, Hong Kong had no comparable Broad Street pump epicenter. Plague's different manifestations among humans and the role of rats in its spread made it entirely different from that of cholera. Still the most striking feature of these 1894 plague maps from all the previous examples of disease maps in China is the first emergence of a city, Hong Kong, itself. The level of detail of the Hong Kong streets, and the precision of medical surveillance at the house level where plague cases had been recorded, make these four plague maps the first of their kind for both the history of plague in China and its urban surveillance in British Hong Kong.
By the time Simpson published these maps in 1903, already nine years had passed since Alexandre Yersin had isolated the causative agent in Hong Kong.Footnote 43 Since a scientific consensus had already formed about the etiology of plague and how it spread in Hong Kong at the time, these maps instead made newly visible not just its extent in Hong Kong, but, perhaps more importantly, the ability of British authorities to track and control it. Simpson's Hong Kong plague maps functioned as a new tool of empire legitimating British colonial rule more than as an analytical tool for sorting out plague's epidemiology, as Simpson's colleague Manson had used his Yunnan plague map 25 years earlier.
That kind of scientific work was being done more in the laboratory (Yersin and Kitasato), but also in the field where, for instance, in 1901 Charles Rothschild (1877–1923) along with entomologist Karl Jordan (1861–1959) collected the rat flea that transmitted plague while on an expedition in Egypt. They named it Xenopsylla cheopis (after the Cheops pyramids), and described it in an article published the same year as Simpson's report on plague in Hong Kong. Yet, the simultaneous tracking of cases of sylvatic as well as human plague seen in Simpson's 1903 maps of the 1894 Hong Kong plague epidemic signifies that the Hong Kong plague maps still appear to retain some of their older function as analytical tools to help work out remaining questions concerning human-sylvatic connections albeit within a new colonial British context.
Disease Maps as Analytical Tools in the Hypercolonial Chinese Context
After nearly 50 years of Medical Reports from the China Imperial Maritime Custom Service's Customs Gazette, two medical missionaries, William Hamilton Jefferys based in Shanghai and James L. Maxwell based in Formosa, published a major synthesis of available medical research about China in their 1910 The Diseases of China, Including Formosa and Korea.Footnote 44 Japan is noticeably absent in this synthesis of the diseases of three of the major countries of East Asia–China, Formosa, and Korea – despite the fact that the Meiji government had since the early 1880s adopted western medicine and science, using both to further Japan's own colonial expansion first in Taiwan (1895-1945) and then in Korea (starting in the 1880s, and through annexation in 1910–45).Footnote 45 By 1910, Japan, like its European counterparts at the time, was also playing a significant military, colonial, medical, and public health role in Taiwan, Korea, and Manchuria. Although Diseases of China did not integrate Japanese-language sources on medicine or medical data stated as coming directly from Japanese imperial medicine in Formosa or Korea, Japan's colonizing presence in both regions by 1910 must nonetheless be acknowledged as part of the larger geo-political context.
In Diseases of China, Jefferys and Maxwell summarized the nosological profile of China, Taiwan, and Korea, introduced the latest results in germ theory, bacteriology, and parasitology, and even offered instructions on how to set up a laboratory in different contexts across China.Footnote 46 The authors rather relied on mostly English-language sources from the range of British, American, and other European medical missionaries and physicians stationed across the entire East Asian region within what Ruth Rogaski has called hypercolonalism, namely the multiple imperialisms that Britain, France, the US, and Japan represented as they vied for control of different parts of China to differing degrees and levels of success.Footnote 47 The special hypercolonial context of certain treaty-port cities in China when Jefferys and Maxwell were medical missionaries and wrote The Diseases of China best describes the combination of uneven but nonetheless increasingly influential, sometimes oppressive, other times ineffective, but indisputably transformative medical research and public health interventions Europeans, Americans, and Japanese carried out in China, Taiwan, and Korea from the 1880s to 1920s.
In fact, I argue that the ten unprecedented maps of the geographic distribution of what were considered the most important diseases in China – plague, cholera, leprosy, beriberi, malaria, elephantiasis and filariasis, Schistosomum japonicum, and two types of intestinal worms (Ankylostomum duodenal and Necator americanus), goiter, and vesical calculus (bladder stones) – that were published in this book could not have been possible at the time without the hypercolonial context within which European, American, and Japanese variously and unevenly carried out their medical research in China.Footnote 48 Although the statistics on which these maps were based were rudimentary, the maps they generated nonetheless created for the first time a visual survey of what Jefferys, Maxwell, and their medical colleagues were researching in East Asia at the time. All the maps placed China, Korea, and Formosa within the global graticule's net, facilitating comparison with any other region in the world along the same latitudes. The turn-of-the-nineteenth-century global “imperial net” that made this book and its maps possible was nonetheless dependent on both the hypercolonial infrastructures established in China's treaty ports and the expansion of Japanese imperialism in the newly colonized Formosa (1895) and annexed Korea (1910) where medical missionaries, including Maxwell, continued their work.Footnote 49
Map of the Noso-geological Divisions of China, 1910
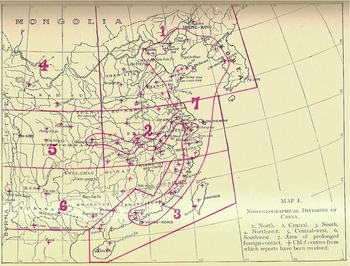
The first of a total of eleven maps notably focused not on the geographic distribution of a single, or the most important diseases, in China but rather on what they called the “noso-geographical divisions” of China. Separated out from the first six metageographic regions – North, Central, South, Northwest, Central-west, and Southwest – the seventh division sweeps along the entire coastline and up the Yangzi River like a huge two-handled club (fig. 11). Starting from Hong Kong in Guangdong province, this “club” moves up the southeastern coastline, where at Shanghai it goes inward along the Yangzi River all the way to Chongqing in Sichuan province, and then, returning to the sea coast, includes all of the Shandong peninsula widening across the Yellow Sea and Korean Bay to include the Manchurian and Korean coastlines. Named descriptively as the “Area of prolonged foreign contact,” division seven notably also contains the crosses that indicate “chief centres from which reports have been received” more than in any other division – one clear example of the hypercolonial nature of most of China's cities along the coastline. The remaining ten maps of specific diseases must therefore be interpreted with this limitation of reports for the remaining regions always in mind. The authors explicitly stated their mapping logic for their nosological map:
It may be taken as a starting-point that, as in our past experience in other land, the distribution of disease in China will be largely governed by climatic conditions; and if we add to this factor that of the influence of lines of travel, and especially of foreign contact with the formerly for centuries undisturbed China, we have named the two points which will have the most influence on any diagrammatic representation of the subject that we may attempt. (Jefferys and Maxwell Reference Jefferys and Maxwell1910, 30, emphasis in the original; map on page 31)
They argued that food and behavior also played parts but that these were factors relevant to nosology (i.e., disease classification) not nosogeography (i.e., disease mapping), their primary concern in all of the medical maps. From their perspective, these maps had three key analytical functions: to impart local information, contribute to future findings, and suggest “limited and tentative generalizations.” These maps explicitly functioned for the authors as tools of analysis, though their function as persuasive graphics was also clear in their maps focused on specific diseases.Footnote 50
Jeffreys & Maxwell, Map of the Noso-geographical Divisions of China, 1910.

The First Map of Cholera in China, 1910
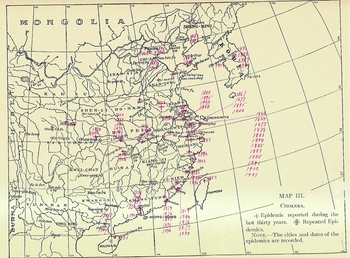
Much had changed in the thirty years since Simmons's cholera in “Eastern Asia” map and beriberi maps were published in the Medical Reports. Whereas Simmons's first cholera map of 1879 emphasized how cholera traveled across seafaring routes from South Asia into Southeast and East Asia, 31 years later the Diseases of China cholera map focused on the entry ports as spatial loci of contamination (fig. 12).Footnote 51 This first map of cholera in China itself emphasized the years of occurrence in Korea and Formosa, as well as in China, highlighting its foreign origin along the coastlines and indicating its spread westward along the major waterways both in the Far South and along the Yangzi River. Red crosses indicate where a cholera epidemic had occurred once within the last 30 years and double crosses indicate repeated epidemics followed by the years when it occurred there. Due to the limits on reports from inland China, as noted in the noso-geographical map, these years indicate more where western observers were in place to record it rather than the full extent of the cholera pandemic throughout China. The authors themselves admitted this:
Periodically cholera sweeps over China. The last great epidemic was in 1902, though 1908 was a bad year. The map (no. 3) is accurate as far as it goes, but undoubtedly these epidemics are farther-reaching than is indicated. That is, they really sweep pretty much all over the country from Hainan northward to the Great Wall and beyond. The big cities, owing to their congestion, are most severely affected, but the country districts by no means escape. There is no established free spot as far as we are aware. It travels rapidly and dies out with the approach of cold weather. Shanghai has a noble record of epidemics, but probably merely because its Board of Health has kept careful notes of the same. (Jefferys and Maxwell Reference Jefferys and Maxwell1910, 45, 46)
Although Koch isolated the comma bacillus in 1883 as the cause of cholera, nonetheless the map clearly conveys that with cholera epidemics still occurring through 1908–9 in China (Shanghai, Pak-hoi in the far south) and Korea (Seoul), much work still remained to be done to stem its spread and prevent further epidemics in the future. In fact, the opening paragraph of the section on cholera's distribution forcefully drove this point home.
Cholera shares with plague the distinction of being the most serious epidemic disease of China, and of the two it is easily the first in its frequency and extent. There is probably not a city of importance in China which has not been visited by cholera during the last half-century. Shanghai has had at least twelve severe epidemics during this period, but we have also reports, though much less complete, of epidemics of cholera in the extreme north, extreme south, and extreme west of the empire, as well as from many intermediate places. In 1820–21 the disease seems to have swept over the whole empire, causing an incalculable mortality, but it need hardly be said that details of such epidemics in China are difficult to obtain and seldom reliable. (Ibid., 86)
The very details provided in Diseases of China, including these maps, were intended as well to remedy this previously scattered and unreliable historical record.
Jeffreys & Maxwell, Map of Cholera in China, 1910.

First Map of Beriberi in China, 1910
An uncertain etiology combined with an insecure nosology stimulated considerable medical debate about the etiology of beriberi: “There is probably no known disease, certainly none in the tropical world, about the aetiology of which such fierce discussion rages as about beri-beri. Let us note first the facts about the disease which may be regarded as proven” (ibid., 105). Then the authors state that it is first known to be a peripheral neuritis disease, one that resembles those “caused by the toxins of alcohol and diphtheria.” And then they clarify that the toxins of alcohol are outside the body and absorbed through consumption, while the toxins of diphtheria are produced within the body. The second known fact is that beri-beri was “associated with the collection of people together, whether in gangs, prisons, asylums, schools, or on shipboard” (ibid., 105–6; emphasis in original). They continue that since a consensus had formed around these two facts, one question had to be answered: “Is the disease one of place or one of food?” The authors gave the pros and cons of both positions, including a summary of the then current rice theory, and concluded that “it behooves us at the present moment rather to acknowledge that no theory has been yet promulgated which covers the whole ground, and to determine, therefore, to keep a perfectly open mind on the subject” (ibid.,109; emphasis in original).
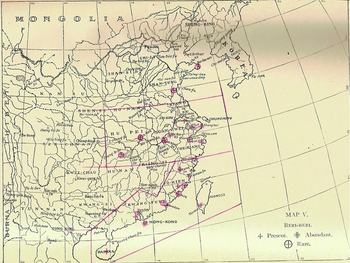
Whereas Simmons's map of beriberi in Japan specified years and indicated transmission from China over the South China Sea, the Diseases of China beriberi map emphasized only endemicity within China (fig. 13). The map thus staked a position more on place rather than the transmission of beriberi, as the earlier map of beriberi in Japan indicated going from China to Japan (fig. 6), but not yet food, as was discussed as another possible etiology within the text but not indicated on the map.Footnote 52 Three symbols indicate three statuses of beriberi: a cross indicated that it was present, a double cross meant it was abundant, and an encircled cross meant it was rare. Red lines demarcate three main divisions of China: 1) from the south where it was present in Hainan and Canton and abundant in Hong Kong and Tainan in Formosa up along the coast, where it was mostly rare but present in Wenzhou; 2) covering most of the provinces of the middle and lower reaches of the Yangzi centering on Shanghai where it is indicated as abundant; and 3) from northern Jiangsu through Shandong provinces where it is rare in two coastal towns. In contrast to cholera, by 1910 a consensus had not yet formed about the etiology of beriberi such that geographic distribution remained a viable way to visually represent it while defining it remained problematic.
Beri-beri (Map 5). – Except for men of at least moderate experience, beri-beri is not very quickly recognized, being apt to be confused with multiple neuritis and so forth. We notice, therefore, a natural hesitation on the part of a large number of younger practitioners to report the disease definitely. Such reports as we have all come from the seacoast and the Yangtze Valley. We have really no evidence for saying whether the intervening districts exhibit it or not. Apparently Szechuan is almost free from it. (Jeffreys and Maxwell Reference Jefferys and Maxwell1910, 47)
Jeffreys & Maxwell, Map of Beriberi in China, 1910.

The authors drew as well from Chinese nosology in their opening paragraph about its distribution while also highlighting its geographic features, which were reinforced as well by the beriberi map:
Beri-beri is a disease which in China has been recognized for many centuries. Macgowan* says that beri-beri, called kioh-ki or chiao-chi, “malarial leg,” has been described in a medical treatise attributed to Hwang-ti, B.C. 2697 (?). There is also a monograph on the same subject named in the imperial catalogue between 1100 and 1200 A.D. The two forms of the disease are described with some accuracy. “Malarial leg” is caused by a poison emanating from a moist soil. Besides moisture, errors in diet are named as predisposing causes.Footnote 53
The disease occurs in all latitudes, but is much more common in tropical regions. It would seem in China to be especially a coast disease only encroaching on the hinterlands along the course of the great rivers. It is quite common in Formosa.
For such an inconclusive case as was beriberi at that time, Jefferys and Maxwell remained open to drawing on Chinese sources, especially when they found in them support for both the place and the food sides of the then raging debate in western medicine about its etiology. Both the text and particularly the map, however, provided more evidence that the particularities of place remained the side of the argument that was winning at the time. The specificities of the causal element related to food, especially the understanding of vitamins B1 and B2, the related problems of vitamin-deficient polished rice, and vitamin deficiency diseases generally, still needed to be conclusively worked out before a scientific consensus linking its nosology with its etiology could form.Footnote 54
First Map of Plague for all of China, 1910
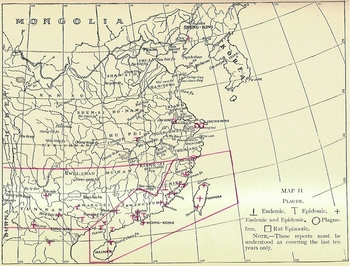
Although the above beriberi map divided up China into three parallel sections, the Diseases of China description of the map of plague in China (fig. 14) charted out where plague remains prevalent in China based on the original seven divisions depicted in the first noso-geographical map:
Plague (Map 2.) – At the present time plague is found only in Divisions 3, and 6, and at the port of Niuchwang. There is very little at Newchwang, and it is hoped that it is dying out there, though every year some is reported. There was an epidemic of rat plague in Shanghai in 1909, but no single case of human plague.Footnote 55 Hongkong is badly infected, and the prospects, after repeated energetic efforts to stamp it out, are not encouraging. Our reports are only from the principal cities, but the inland villages and smaller towns of Fukien and Kwangtung are very badly treated by the disease from time to time. There is very little plague at the present time in Yunnan and Kwangsi. Possibly it is dying out, though we fear this hope is over-sanguine. Formosa and Hainan both have it endemically. Maybe Hongkong [sic] and the Amoy district are worst off of all. Hankow reports a few cases of plague, autumn of 1909, sporadic and imported. (Jeffreys and Maxwell Reference Jefferys and Maxwell1910, 45)
Despite the British display of house-to-house control over the 1894 plague epidemic in Simpson's 1903 maps, Hong Kong remained one of the worst urban-centers of plague along with Amoy in all of China. The opening paragraph of the chapter on infectious diseases opens with the following paragraph on the distribution of plague, which furthermore emphasized its endemicity in other regions of China as well:
The distribution of plague in China is of special interest as exemplifying the laws that affect the progress of this disease throughout the world at large. Essentially plague is a tropical disease, and through tropical and subtropical China it is endemic. The endemic nature of the disease, however, does not prevent its frequently appearing in a severe epidemic form. Indeed, there is good reason to believe that the last great series of epidemics commenced from the province of Yunnan. Generally speaking, then, plague may be considered endemic and epidemic to the south of the twenty-eighth parallel of north latitude in China, including Formosa and French Indo-China, but is only met with in its epidemic form north of that line, and arising from imported cases of the disease. Like other rules, however, this is not quite free from exceptions. Sporadic cases have been reported from the Yangtze Valley (Hume), and plague is endemic and epidemic at Niuchwang in north latitude 40° 58’. The year 1894 may be considered the date of the modern plague revival.Footnote 56
The Diseases of China map of plague, itself, reinforced this argument from the text on plague's endemicity in that it differentiated where the disease was endemic, epidemic, or both (fig. 14) (ibid., map on page 69). In contrast to the 1894 plague maps of Hong Kong (published in 1903) that functioned in part as analytical tool for working out human-sylvatic relations and in part as tool of empire that legitimated British colonial power, these later 1910 maps on beriberi as well as plague still primarily functioned as analytical tools for working out the relationship between the Chinese environment and disease occurrence.
Jeffreys & Maxwell, Map of Plague in China, 1910.

Although this plague map clearly marks in red the divisions three and six as the primary loci of plague in the far south, one single red cross at Niu Chuang in northeast Manchuria reminds the observer of the plague epidemic that broke out nearby in 1897 (figs. 7–9), just over a decade earlier. In fact, it would soon break out again before the end of 1910. Still working out plague's relationship between sylvatic and human populations, the map also designates where rat plagues occurred, suggesting how important China was as a field site for the international gathering of scientific knowledge on sylvatic plague.
By the end of the same year that Diseases of China was published, the plague remained chronically present in southwestern China while the specter of plague returned to Manchuria with a vengeance. This time it dramatically revealed the imperialist ambitions of Russia as well as Japan through their control respectively of the Eastern and South Manchurian railway lines. The 1910–11 Manchurian plague epidemic, in fact, made the hypercolonial reality of Manchuria starkly clear as the international question of what country – Russia, Japan, or China – was going to be able to control it, seriously challenged China's own national sovereignty in the region.Footnote 57
Disease Maps as Tools of National Sovereignty
It all came down to European fur markets; the region's ample supply of rodents – Tarbagan marmots – made decent imitation marten and sable, with which great profits could be made in the fur trade. However, the inexperienced boom-time Chinese trappers did not know enough to leave behind the plague-infested coats of sick animals. The trappers also slept in makeshift shelters with coolie laborers along the railway towns. When the first infected migrant trapper entered Manchouli (northwest of Harbin) on Oct 13, 1910, dying three days later, the Yersinia pestis in its most contagious form as pneumonic plague had vulnerable hosts and ideal transport along the railway lines to spread. By March the next year, the most virulent epidemic of pneumonic plague in recorded history had claimed over 60,000 lives.Footnote 58
Despite the high mortality, it would have been much worse epidemiologically if the Chinese state, in response to international pressure had not stepped in with personnel, resources, and the first Chinese state-funded medical institution based on the modern science of the day. The key personnel they hired was the ethnically Chinese but Malaysian born and British educated, Wu Lien-teh (1879–1960), who was also the first Chinese trained in medicine at Cambridge University where he was a student of Emmanuel College. The Councilor of Foreign Affairs, Dr. Alfred Sao-ke Sze (1877–1958), had graduated from Cornell and knew Wu through overseas Chinese networks, which helps explain why he sent Dr. Wu an urgent telegram in November 1910. He clarified that the imperial government wanted a bacteriologist to figure out the cause of the virulent epidemic and control it, if possible, and asked him if he would accept a position as head of the state's efforts to control the epidemic. Seeing it as an opportunity to conduct autopsies, carry out laboratory research (possibly even discover a new bacterial agent), and bring the latest medical knowledge to China, Wu accepted.Footnote 59
The Qing government's main reason for intervening, however, were largely political since the Japanese and Russians had plans to use what they considered to be superior ability to control the epidemic and thus provide a shield for the international community against a potential pandemic as a pretext to justify claiming more Siberian territory. A watershed moment in the history of public health in China, many scholars have already written on the range of significance of this Manchurian epidemic.Footnote 60 It marked many firsts: public health as a national Chinese responsibility, state acceptance of the superiority of modern medicine, the state's recognition of the ability to control epidemics as a gauge of international credibility, and public health interventions as a site of imperialist rivalry.Footnote 61 Furthermore, it was during the Manchurian plague epidemic that the microscope and the laboratory science Wu Lien-teh brought with him from Cambridge was fully integrated into determining the validity of plague cases and also was implicated as well in Chinese struggle for national sovereignty in the region.Footnote 62 Once the epidemic had been controlled by March, 1911, working with the Qing government and in competition against the Japanese who wanted it held in Japan, Wu succeeded in having the International Plague Conference hosted by the Chinese government in Mukden (present-day Shenyang) a month later in April.
English Maps of the Plague Epidemic in Manchuria, 1911
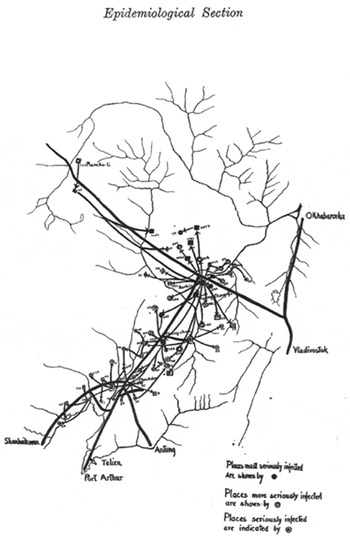
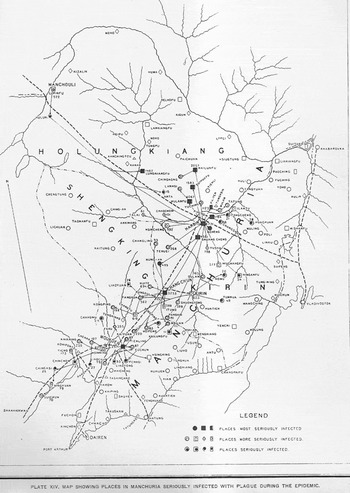
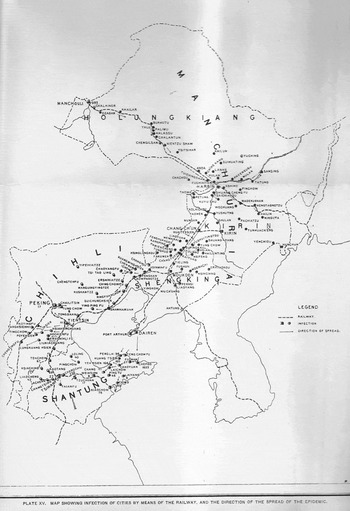
Participants in this conference published for an international audience three maps in English that portrayed the spread of the Manchurian plague throughout the region. The first came out in the Proceedings of the Royal Society of Medicine in Britain (fig. 15). The other two were published in the first “Report of the International Plague Conference Held at Mukden, April 1911” (figures 16–17). The first and second examples are nearly identical except that the first (fig. 15) looks like the original hand-drawn version of what became a more detailed printed copy in the Mukden report (fig. 16).Footnote 63 Whereas the first drawn version only indicates three types of places – seriously infected, more seriously infected, and most seriously infected – the printed copy has added all the major cities in the outlying regions where plague had not reached. The third English version titled “Map Showing Inspection of Cities by Means of the Railway, and the Direction of the Spread of the Epidemic” was also printed in the Mukden Report (fig. 17). It added the clear boundaries of the provinces that made up Manchuria (written as Holungkiang, Kirin, Shengking provinces) as well as the region around Beijing known then as Chihli and Shantung (or Shandong) province that were missing in the previous two versions. It thus made visually clear not just the “direction of the spread of the epidemic” along the railway tracks (figs 15–16) but also the provincial boundaries of the Qing empire at the time. None of these maps of the Manchurian pneumonic plague epidemic, however, included the longitudinal and latitudinal coordinates of the graticule for the region that was indicated in nearly all of the maps previously published in the IMCS's Medical Reports and The Diseases of China, Including Formosa and Korea. That kind of geographic specificity appears to have been no longer considered necessary for the intended audience.
Royal Society of Medicine, Plague Epidemic in Manchuria, 1911.

April 1911 Mukden Report, Plate XIV, Plague Epidemic in Manchuria, 1911.

April 1911 Mukden Report, Plate XV, Manchurian Plague Epidemic, 1911.

These three English-language maps of plague in Manchuria indicate only the directionality and extent of its spread throughout the region, with no governmental institutions in these maps, beyond the railway lines. Harbin remains clearly the epicenter out of which the plague spreads like spokes in an enormous carriage wheel. What the maps make visible are the Eastern and Southern Manchurian railway lines, and the side roads taken when, in January 1911, passengers who were denied tickets took plague along with them as they walked on foot along the roads into the countryside. The maps presented the extent of the epidemic and demonstrated plague's limited spread well within China's borders.
Pneumonic plague certainly spread widely but the lines marking its course do not go beyond Chinese port cities. Since the International Plague Conference was held in April 1911 in Mukden (present-day Shenyang) and not in Russia, Japan, Europe, or the US, and the first of its kind for the Chinese government to sponsor, China's national sovereignty was also being performed there. The underlying message in the English maps was the necessity and ability of state power to control an unprecedented plague epidemic. But the two maps published in the final Mukden report of 1911 also can be interpreted as demonstrating to the international scientific and diplomatic communities for whom they were simultaneously intended that China could not only successfully host an international scientific conference but also could manage its own domestic affairs.
The Russian Map of the Manchurian Plague Epidemic in Harbin, 1912
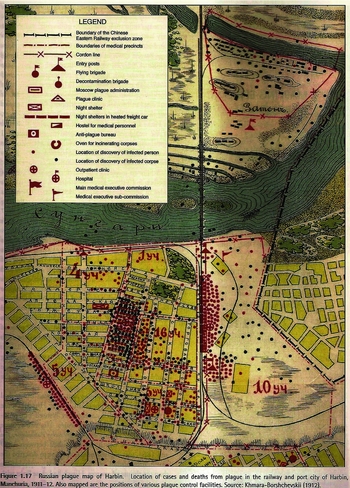
But the English maps were not the only ones to come of this epidemic.Footnote 64 The first Russian map depicted just the city Harbin and was intended only for a Russian audience (fig. 18), as it was the Trans-Siberian Railway Company that produced it (see Cliff, Haggett, Smallman-Raynor Reference Cliff, Haggett and Smallman-Raynor2004, 12).Footnote 65 The most striking difference between the two types of disease maps of the 1910–11 Manchurian plague epidemic presented here – three in English and the one in Russian – is their scale. In the Russian plague map, the red and black dots indicate respectively plague occurrence and deaths at the level of households in Harbin. Other lines clearly delineate the “Boundary of the Chinese Eastern Railway exclusion zone,” “Boundaries of medical precincts,” “Cordon line,” and the railway's tracks. Different symbols represent the presence of the “Moscow plague administration,” such as flying and decontamination brigades, night and outpatient clinics, hospitals, heated-freight-car shelters, and even the ovens for incinerating corpses. The Russian Harbin map of pneumonic plague is even more detailed than the comparable British 1894 map of bubonic plague in Hong Kong in terms of the public health infrastructure they had put in place. Such level of detail not only suggests Russians had even greater control over Harbin than Britain had had earlier in Hong Kong but also notably depicts the multiple means by which they were able to control not only the epidemic but also the dominantly Chinese population within it.Footnote 66
Russian Map of Manchurian Plague Epidemic in Harbin, 1912.

First Maps of Diseases in China with Chinese Characters
Contemporaries and later scholars largely credit Wu Lien-teh with controlling the epidemic and its successful outcome for the Qing government, although obviously many other forces were at play. As reward for his eventual success and acknowledgement of leadership at the International Plague Conference in Mukden (3–28 April 1911), the government appointed him director of the new North Manchurian Plague Prevention Service (NMPPS). Government officials, as well as the scientists, understood well after coming through the chaos of the plague epidemic that, in order to have a voice in the League of Nations and the International Red Cross, they needed to commit to western-style medicine and establish a national public health institution (Lieu Reference Lieu and Borowy2009).Footnote 67 After the success in controlling the plague epidemic and holding the first International Plague Conference in Mukden, Wu Lien-teh was the obvious political and scientific choice to lead this new institution. As director of the NMPPS, he thereafter made the institution the central clearinghouse for all information on plague in China. Through it he integrated China's periphery into multiple centers of calculation gathering vital statistics and epidemiological data throughout the world in London, Paris, Berlin, Moscow, and Washington D.C. The new NMPPS Reports he edited thus became a vehicle to communicate China's plague research and control efforts to the world and bring human and sylvatic plague research around the world to China.Footnote 68
Maps of the Plague Region, Manchuria, 1921
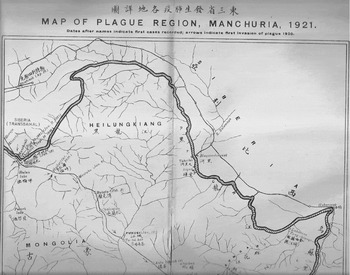
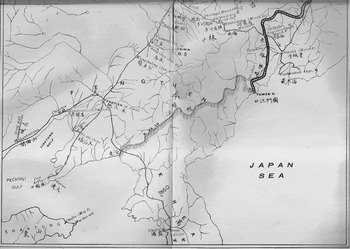
The primary functions of the NMPPS in the decade following its establishment in 1911 were largely to establish plague hospitals, do research, and educate on hygiene and sanitation (Flohr Reference Flohr1996, 373). The Reports that covered the decade from 1918 to 1928 published just four disease maps, all related to when plague returned to China (see Wu Lien-teh, ed., Reference Lien-teh1936a). A decade after its establishment, an epidemic of pneumonic plague occurred again in 1921. The first large folded map thus depicts where the second major pneumonic plague epidemic occurred, clarifying the extent of its spread (figs. 19–20). Once again the longitude-latitude graticule was not applied, suggesting it was no longer necessary for the intended audience. Similar to the three previous English-language maps of pneumonic plague in 1910–11, the epidemic followed the railway lines and ended at their termini, demonstrating again its containment within China proper.
North Manchurian Plague Prevention Service Reports, Map of Plague Region, Manchuria, 1921, Upper Part.

North Manchurian Plague Prevention Service Reports, Map of Plague Region, Manchuria, 1921, Lower Part.

However, for the first time Chinese characters were used to translate the map's title, names of provinces, regions (Siberia), countries (Korea), and cities. The English reads left to right whereas the Chinese translation is written right to left. Although the inclusion of Chinese characters was obviously not necessary for the largely cosmopolitan and multilingual audience of these reports, their presence here suggests an attempt to reinforce China's sovereignty over the region at a time of great anxiety following Japan's victory in the Russo-Japanese War (1904–5), which resulted in Japan effectively taking control of the South Manchuria Railway zone from Russia. The Chinese characters may also signify that the Chinese state produced this map within the new NMPPB, which it supported and within which it now employed native Chinese scientists literate in mandarin Chinese (which Wu Lien-teh was not). Furthermore, Chinese characters would widen the audience well beyond just the foreign-educated one that read English.
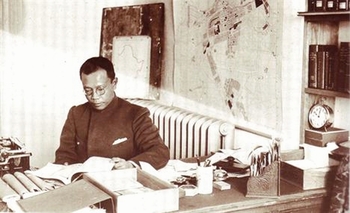
The same map can be seen in a 1921 photo of Wu Lien-teh in his Harbin office directly behind his left shoulder (fig. 21).Footnote 69 To the right of that map is the city map of Harbin where Wu's new laboratory was completed the previous year in 1920. The presence of this map in Wu Lien-teh's new office also shows its practical use, comparable to a military map, for organizing public health campaigns to control the epidemic. This large foldout map was not merely produced for rhetorical ends but was also intended strategically to guide actions in specific locations.
Wu Lien-teh in his office, Harbin, 1920, with the “Map of Plague Region, Manchuria, 1921” behind his left shoulder.

The Propaganda Posters of Bubonic and Pneumonic Plague, 1921
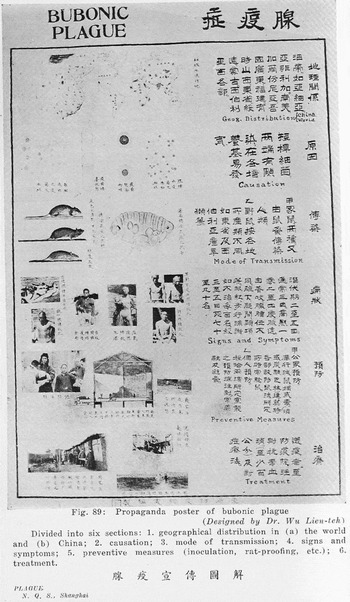
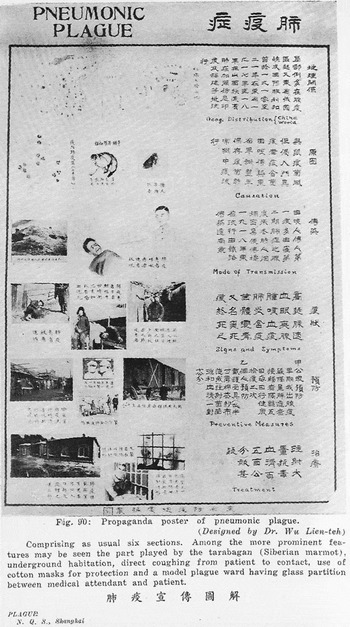
Yet as the contrasting 1921 “propaganda posters” for the bubonic plague (fig. 22) and for the pneumonic plague (fig. 23) illustrate, the most difficult factors to control were not bacilli, fleas, rats, or Tarbagan marmots but rather people. Printed in response to the recurrence of the pneumonic plague in Manchuria, Wu Lien-teh took credit for their design (see the appendices to Wu Reference Lien-teh1936b). They are some of the first examples of public health posters in China and contain in the upper register the first disease maps in vernacular Chinese for ordinary Chinese. Wu wrote that he had made the posters in response to resistance to his quarantine measures, especially the practice of taking the sick to hospitals against their will, quarantining households with cases of plague, and burying the dead in mass graves. From top to bottom, each one of the six levels explains one aspect of plague he thought the Chinese populace needed to understand: “1. geographical distribution in (a) the world and (b) China; 2. causation; 3. mode of transmission; 4. signs and symptoms; 5. preventive measures (inoculation, rat proofing, etc.); 6. treatment.”Footnote 70 Wu sought, in short, through better comprehension to ensure better cooperation.
Wu Lien-teh, Propaganda Poster of Bubonic Plague, 1921.

Wu Lien-teh, Propaganda Poster of Pneumonic Plague, 1921.

The disease maps had pride of place at the top of both posters and expressed that China's national problem with plague epidemics was global in scope. Then the posters radically switch scale to illustrate the petri dish and explain in vernacular Chinese that an invisible microbe or bacillus is the cause. This dramatic shift in the scale from global and national disease distribution maps to what the microscope allows the scientist to see in the petri dish, both laboratory's iconic tools, visually places control over the epidemic in the hands of the scientist and therefore as well in the state's new medical institution in which he works.Footnote 71 The illustrations on the third level show how the bacillus travels through the fleas on rats and other rodents. Next, the photographs of buboes depict the major clinical signs for bubonic plague and, just below, more photographs show preventive measures.
The pneumonic plague poster, by contrast, illustrates its transmission via the Tarbagan marmot and then between humans via coughing and through the air, making it more contagious than the bubonic variety. It also emphasizes the need for cotton masks as well as glass partitions in a model plague ward to prevent transmission from patient to attendant. Although each poster pulls out the distinctive aspects of pneumonic and bubonic plague, the visual narrative of both concludes that those who suspect plague infection should seek treatment from the same hospitals, clinics, and physicians they have distrusted, avoided, and even resisted.
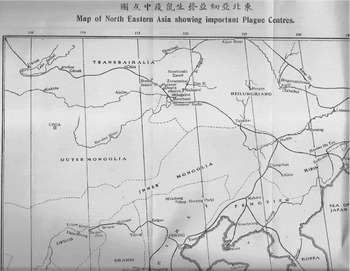
“Map of North Eastern Asia Showing Important Plague Centres,” 1923
Dated two years later in 1923, the second foldout map included in the NMPPB was titled the “Map of North Eastern Asia showing important Plague Centres.” It shifted the focus from the dissemination of a specific epidemic in time among humans to the locations where plague was known to be endemic in northwestern China in the early 1920s (fig. 24). It also significantly situates North Eastern Asia within the international graticule. Susan Jones has argued in her recent work on the Manchurian plague, that Wu's fieldwork on sylvatic plague reservoirs in Manchuria significantly influenced a new research direction on sylvatic plague in the international scientific community. First, the directionality of the epidemic from inland out along the railroads in the 1910–11 pneumonic epidemic suggested to Wu endemicity of plague among the rodents themselves. All of Wu's interviews with his patients before they died during that first epidemic also signaled to him the significance of human contact with the tarbagans.Footnote 72 What is not clear in the English term “plague” is, by contrast, explicit in the Chinese translation shuyi 鼠疫 (lit., “rat epidemic”) that is written in the translation of the titles for both maps on plague centers in China and the world. Wu and his cohort were drawing the net closer between rodent and human outbreaks of plague through what may well be the first Chinese and global distribution maps of locations of sylvatic plague reservoirs.
North Manchurian Plague Prevention Service Reports, “Map of North Eastern Asia showing important Plague Centres,” 1923.

The third “Map to illustrate endemic plague areas” complements the second by placing China's plague centers (6–10b on map) in a global context (fig. 25). In contrast to the bilingual map of the plague region that hung on Wu Lien-teh's office wall behind his desk, both of these two maps of “North Eastern Asia plague centres” and “endemic plague areas” were written only in English and place plague occurrence within the immediately recognized graticule thus signaling a different more international audience for them. These maps of plague centers within China and in the world no longer function analytically to narrow the range of potential causative factors since scientific consensus had already formed on this problem. Rather they work rhetorically to convey the scientific knowledge that the Chinese NMPPS had of plague reservoirs within China and across the globe, and thus legitimated its international role as the central (not merely Chinese) institution with the power to manage them. The power to define disease as well as to carry out public health campaigns became clearly linked with Chinese nationalism. This historical linkage seen clearly here carries through other public health campaigns and state building in Republican China.Footnote 73
North Manchurian Plague Prevention Service Reports, “Map to Illustrate Endemic Plague Areas” in the World, 1923.

The Propaganda Poster of Cholera, 1928
Seven years after the first two propaganda posters on bubonic and pneumonic plague, Wu Lien-teh published in 1928 a public health poster for cholera (fig. 26) similar in structure to the earlier ones (see the appendices to Wu Reference Lien-teh1936b). It followed their same structure from top to bottom showing: 1) distribution globally and nationally, 2) cause, 3) mode of spread, 4) symptoms, 5) prophylaxis, and 6) treatment. Six short paragraphs on the right explained in simple Chinese the main points of the illustrations to the left. The first sentence that explains the disease maps clarifies that cholera, significantly translated into the Chinese disease category “sudden turmoil” (huoluanzheng 霍亂症, read right to left),Footnote 74 originally came from India. Here an ancient Chinese disease concept that covered a much wider range of symptoms became equated in a one-to-one correspondence with the western disease concept “cholera” to facilitate communication with the Chinese populace about a new conceptualization of what that older term now meant.
Wu Lien-teh, Propaganda Poster of Cholera, 1928.

The poster describes how cholera entered China from the southern and central provinces and then from Shanghai traveled on boats throughout the eastern provinces. The microscope's version of what can be seen in the petri dish appears again in the second register as the primary means to isolate the cholera bacillus, the necessary cause of cholera. As in the early 1920 plague posters, the petri dish has trumped the disease maps above as a scientific technique for isolating the relationship between disease occurrence and specific agent. The global and national maps of cholera (as with the earlier maps of pneumonic and bubonic plague) function now as visual narratives of the disease's trajectory through the world and recent arrival in China. Rather than being an analytical tool for thinking through epidemiological problems, they have become an integral aspect of public health campaigns to counter popular resistance to the new state measures to control them. The maps of bubonic plague, pneumonic plague, and cholera on these “propaganda posters” from the 1920s appear to be some of the first examples of such maps in Chinese for a popular audience. The posters themselves may also be examples of the earliest Chinese state-sponsored public health propaganda that would reach new levels of sophistication, variation, and distribution in the later Republican and People's Republic of China periods.Footnote 75
Disease Maps as Obsolete, or Not?
The change in function of these disease maps also represents the much broader transformation from medical geography to laboratory medicine. The former emphasis on the geography of disease gave way to the latter's new model of microorganisms. The second edition of The Diseases of China, published in the same year as Wu Lien-teh's 1928 cholera poster, illustrates well this final dénouement. One of the two original authors, Hamilton Jefferys took charge of the revision nearly two decades later and wrote the following comments about the maps included in the original: “With the exception of the attempt made in the first edition of this work, we are unaware of any systematic study of the geographic distribution of disease in China” (Jefferys Reference Jefferys1928, 15).Footnote 76 Furthermore, Jefferys argued that the former noso-geographical map that established the overview of the entire contents of the 1910 edition was now outdated:
In the earlier edition, an attempt was made to divide China into different areas corresponding to climatic conditions, regions of foreign contact and parts of the country about which our medical knowledge was more or less strictly limited. In the light of our knowledge at the time such attempted divisions were amply justified but we doubt whether they are now of any great value and we propose to omit them entirely. In the past quarter of a century, there have been considerable additions to our information, and reasons for the distribution of disease, which were formerly regarded as geographical can now be explained in other ways (Ibid., 17).
Finally, Jefferys recognized that the wars fought in China since the fall of the Qing government in 1911 had integrated its former nosological profile: “Further, the last few years have seen the country swept from end to end by huge armies, –northerners have invaded the south and southerners have penetrated to the north, and in each case diseases have been carried by the troops in a way that tends to a more equalised [sic] distribution of all general infective conditions” (ibid., 17). Visualizing the geography of disease, so central in the ten maps of disease distribution in the 1910 edition, by 1928 had become useless in light of the new China and for scientific medicine; perhaps they were still necessary for the education of the masses, but now they no longer held sway among educated physicians.
The Modern Health Poster on Apoplexy, 1929
The following year Wu Lien-teh, however, printed another poster that was similar in structure to the preceding three ones from 1921 and 1928. Instead of focusing on such deadly epidemic diseases of bubonic and pneumonic plague and cholera, he focused on apoplexy (fig. 27).Footnote 77 From the Greek term that means, “a striking away,” apoplexy refers to the sudden loss of consciousness, often but not always followed closely by death, and is the older name for what is now called stroke (bleeding within internal organs). The choice to translate apoplexy into the Chinese disease category naozhong fengzheng 腦中風症 (“brain struck-by-wind syndrome”), comparable to the translation of cholera into huoluanzheng 霍亂症 the year before, also further illustrates the original posters’ intention to educate the Chinese populace translating new Western nosology into preexisting common Chinese disease concepts. In their creator Wu Lien-teh's own words, the “forceful illustrations and simple Chinese text” also marked it as a “modern health poster.”
Wu Lien-teh, A Modern Health Poster on Apoplexy, 1929.

Disease maps still figured prominently at the top register, indicating their continued role in situating this disease in a global and then national perspective, but now they were only for educating ordinary Chinese and no longer used as analytical tool, tool of empire, or a tool for national sovereignty. Traditional Chinese medical terms such as zhongfeng “struck-by-wind” for apoplexy and disease concepts such as huoluan “sudden chaos” for cholera could come back into circulation on “propaganda posters” for the purpose of public health education since the consensus on the scientific nomenclature of diseases had long been settled. Modern biomedical nosology may have completely subordinated traditional Chinese nosology but it had not yet made it entirely obsolete either, at least not for the other external propaganda functions public health posters were intended to communicate with a broader Chinese public.Footnote 78
The Many Functions of Disease Maps
The medical maps of diseases in China from 1878 to 1929 thus reveal a major transformation from their use as an analytical tool to isolate the primary cause of epidemic diseases to their final obsolescence as research tool – at least in the second 1928 edition of The Diseases of China, Including Formosa and Korea. They continued to contain rhetorical force, but for different types of arguments and political purposes in new political contexts. These transformations also reveal the significant role of the western medical experience of plague in China for the eventual scientific consensus on plague etiology as well as scientific research on sylvatic plague. In the first 50 years of their history, the different forms the disease maps of China took signified the same means for new ends once their primary function as analytical tools changed to legitimating tools of empire as well as national sovereignty. Finally, disease maps took on new rhetorical roles of persuasion on modern health posters intended to convince the Chinese populace of the scientific knowledge as well as medical benefits to society of the very new public health institutions – such as the Northern Manchurian Plague Prevention Bureau and National Quarantine Service – that Dr. Wu directed in the first two decades of Republican China.
Previous studies on disease maps have focused on their history in western cartography and medicine as forms of persuasive graphics that have internal and external propaganda functions and as analytical tools used as research methods and evidence in scientific arguments.Footnote 79 This article has shifted the geographical focus from being primarily on the history western disease maps from European and US contexts to western disease maps specifically coming out of the East Asian context from 1878 to 1910. It then examined their assimilation via mainly Wu Lien-teh from 1921 to 1929 within new Republican-era state-supported Chinese public health institutions.
This article also integrated insights from the literature on how medicine and science were used as tools of empire in the history of British and American imperialism to analyze how specific disease maps functioned in a comparable way. For example, the four 1903 maps illustrating the 1894 plague epidemic brought British imperial control over Hong Kong into focus and the 1912 map depicting Russian public health infrastructure in Harbin during the 1910–11 plague epidemic similarly demonstrated Russian control over Harbin. Furthermore, this article clarified the additional dimension of how the English-language disease maps dealing with the plague epidemics in China in 1910–11 and the bilingual ones from 1921 also functioned to assert China's national sovereignty at a time when it was being challenged from various geopolitical angles.
The later disease maps integrated into the Chinese-language public health posters of the 1920s illustrate yet another function of these maps, that is, to convince the general Chinese populace that this new way of visualizing the geography of diseases in the world and within China (including the scientific way of understanding them via microscopes and laboratory sciences) was in their own as well as the new Chinese nation-state's best interest. The global circulation of western medical concepts had by then certainly had a great impact on China.Footnote 80 But the new visual technology of western disease maps was no less impactful than western medical concepts in China and was as varied in its functions as it was useful in its assimilation in the early years of the Republican period. This could be argued both for modernizing medicine for the Chinese state's own ends as a new player on the political and scientific global arena and, perhaps surprisingly, for also reintegrating traditional Chinese disease concepts into the new western public health propaganda intended to teach the masses within China the modern medical ways of understanding and visualizing the diseases of China.
Acknowledgments
This article was made possible by several research stays over the course of five years between 2011–2016 at the International Consortium for Research in the Humanities “Fate, Freedom and Prognostication: Strategies for Coping with the Future in East Asia and Europe” at Friedrich-Alexander-Universität Erlangen-Nürnberg, which is funded by the Federal Ministry of Education and Research's (BMBF). While working on a new book project at the Consortium, I also presented new research on disease maps related to my first book. I also thank colleagues and students at the University of Toronto, Yale University, University of Nevada Reno, the Modern China seminar at Columbia University, Johns Hopkins History seminar, Oxford and Cambridge University, Heidelberg University, Erlangen University, Tel Aviv University, Academia Sinica at Berkeley and Stanford, for opportunities to discuss earlier versions of this research. Special thanks are due to Bill Summers, Mary Brazelton, and Richard Sosa (Yale), Meaghan Marian (Toronto), Graham Mooney (Johns Hopkins), Angela Leung (Hong Kong University), Daniel Ham (Oxford), Robert John Perrins (Acadia University), Christos Lynteris and Lukas Engelmann (CRASSH, Cambridge University), Michele Thompson (Southern Connecticut State University), Hsinhsuan Pamela Lee (Taiwan National University) and Michael Shiyung Liu (Academia Sinica) for generously sharing with me the medical maps of China, Japan, and Taiwan that they had come across in their own research. I also owe gratitude to my colleagues Chu Ping-yi and Ling Hong Lam for critical comments that proved decisive. The comments of one anonymous reviewer for this article were exceptionally well formulated and considerably improved the final revision of this article. Finally, I thank my late colleague Harry Marks with whom I had my first and formative conversations on the history of disease maps.