Contemporary pediatric cardiovascular intensive care units (CICUs) include children (50% <1 years of age) recovering from or waiting for cardiac surgery (66% of admissions) and childrenr admitted for critical illness related to underlying cardiac disease (ie, acute decompensated heart failure; https://pc4quality.org/). CICU patients have increased infection risk due to surgical wounds, invasive medical devices and extracorporeal support, medication-related immunosuppression, immune dysregulation following cardiopulmonary bypass, and prolonged length of stay. Reference Alten, Rahman and Zaccagni1 Infections in this population are associated with increased morbidity, mortality, and resource utilization. Reference Alten, Rahman and Zaccagni1 Timely treatment is essential to mitigate complications from bacterial infections, Reference Rhodes, Evans and Alhazzani2,Reference Kansy, Jacobs and Pastuszko3 and there is a low threshold for antibiotic initiation as part of the infection diagnosis protocol in this high-risk cohort. Differentiating between early infection and other pathologic state, such as postoperative inflammation, low cardiac output or heart failure, and sedative and/or opioid withdrawal, is challenging because these pathologies present with overlapping, nonspecific clinical signs (eg, fever, tachycardia, tachypnea, increased markers of inflammation). Reference Alten, Rahman and Zaccagni1,Reference Schwenk, Kruger and Sacks4 This quandary contributes to a high antibiotic utilization rate (>70% across CICUs). Reference Rhodes, Evans and Alhazzani2,Reference Blinova, Lau and Bitnun5 Traditionally, if cultures remain negative during an infection diagnosis and there is a low suspicion for infection, antibiotics are discontinued after 48–72 hours. However, even short courses of antibiotics are not without risk for harm, including gastrointestinal microbiome alteration, emergence of multidrug-resistant organisms, and Clostridioides difficile infection. Reference Alten, Rahman and Zaccagni1,Reference Schwenk, Kruger and Sacks4,Reference Arulkumaran, Routledge and Schlebusch6,Reference McKamy, Hernandez and Jahng7
In infants, most pathogens grow in blood cultures within 24 hours. Reference Aronson, Wang and Nigrovic8–Reference Marks, de Waal and Ferguson14 Thus, current guidelines for non-ICU febrile neonates and infants recommend monitoring cultures in well-appearing patients for <30 hours prior to hospital discharge. Reference Biondi, McCulloh and Staggs15 We sought to demonstrate the feasibility of extending this practice to a higher-risk population: patients undergoing an infection diagnosis process in the CICU. We implemented a quality improvement project aimed at reducing unnecessary antibiotic exposure (1) by increasing team awareness of antibiotic utilization during the infection diagnosis process, (2) by limiting empiric treatment to 24 hours, and (3) by discouraging indiscriminate use of vancomycin. We hypothesized that targeting inappropriate antibiotic use as part of the infection diagnosis protocol could safely decrease total antibiotic exposure by eliminating 1–2 days from the antibiotic duration.
Materials and methods
Study setting
Our CICU is a medium–large specialty unit with ∼600 admissions per year; 60% of these patients have cardiac surgery during admission. Our case-mix and patient demographics are very similar to those of standard North American dedicated CICUs, including a busy transplantation and ventricular assistance program. In our CICU, ∼20% of patients are neonates and ∼30% are aged <1 year. During this project, no stewardship activities related to blood culture or antibiotics were underway. Prior to this project, antibiotic duration for all infection diagnoses was a minimum of 48 hours. Almost all antibiotics prescribed as part of an infection diagnosis protocol consisted of cefepime and vancomycin due to the high rate of methicillin-resistant Staphylococcus aureus (MRSA). Blood cultures were processed utilizing the BACT/ALERT VIRTUO automated system (bioMèrieux, Marcy-l'Étoile, France) for rapid detection of bacterial growth and the Luminex Verigene BC-GP system (Luminex, Austin TX) to process genus, species, and resistance data. These tests allowed clinicians to alter therapy based on bacteria identification and antimicrobial resistance data. Reference Beckman, Washam and DeBurger16,Reference Hill, Tran and Barton17 Blood cultures were monitored continuously, and growth was identified in real time. Institutional mean time to positivity was 13.2 hours, with 97% positivity at <24 hours.
Project development
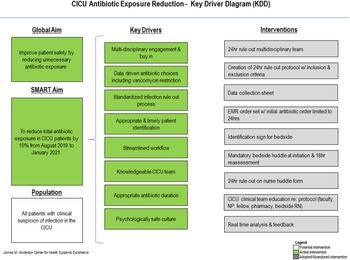
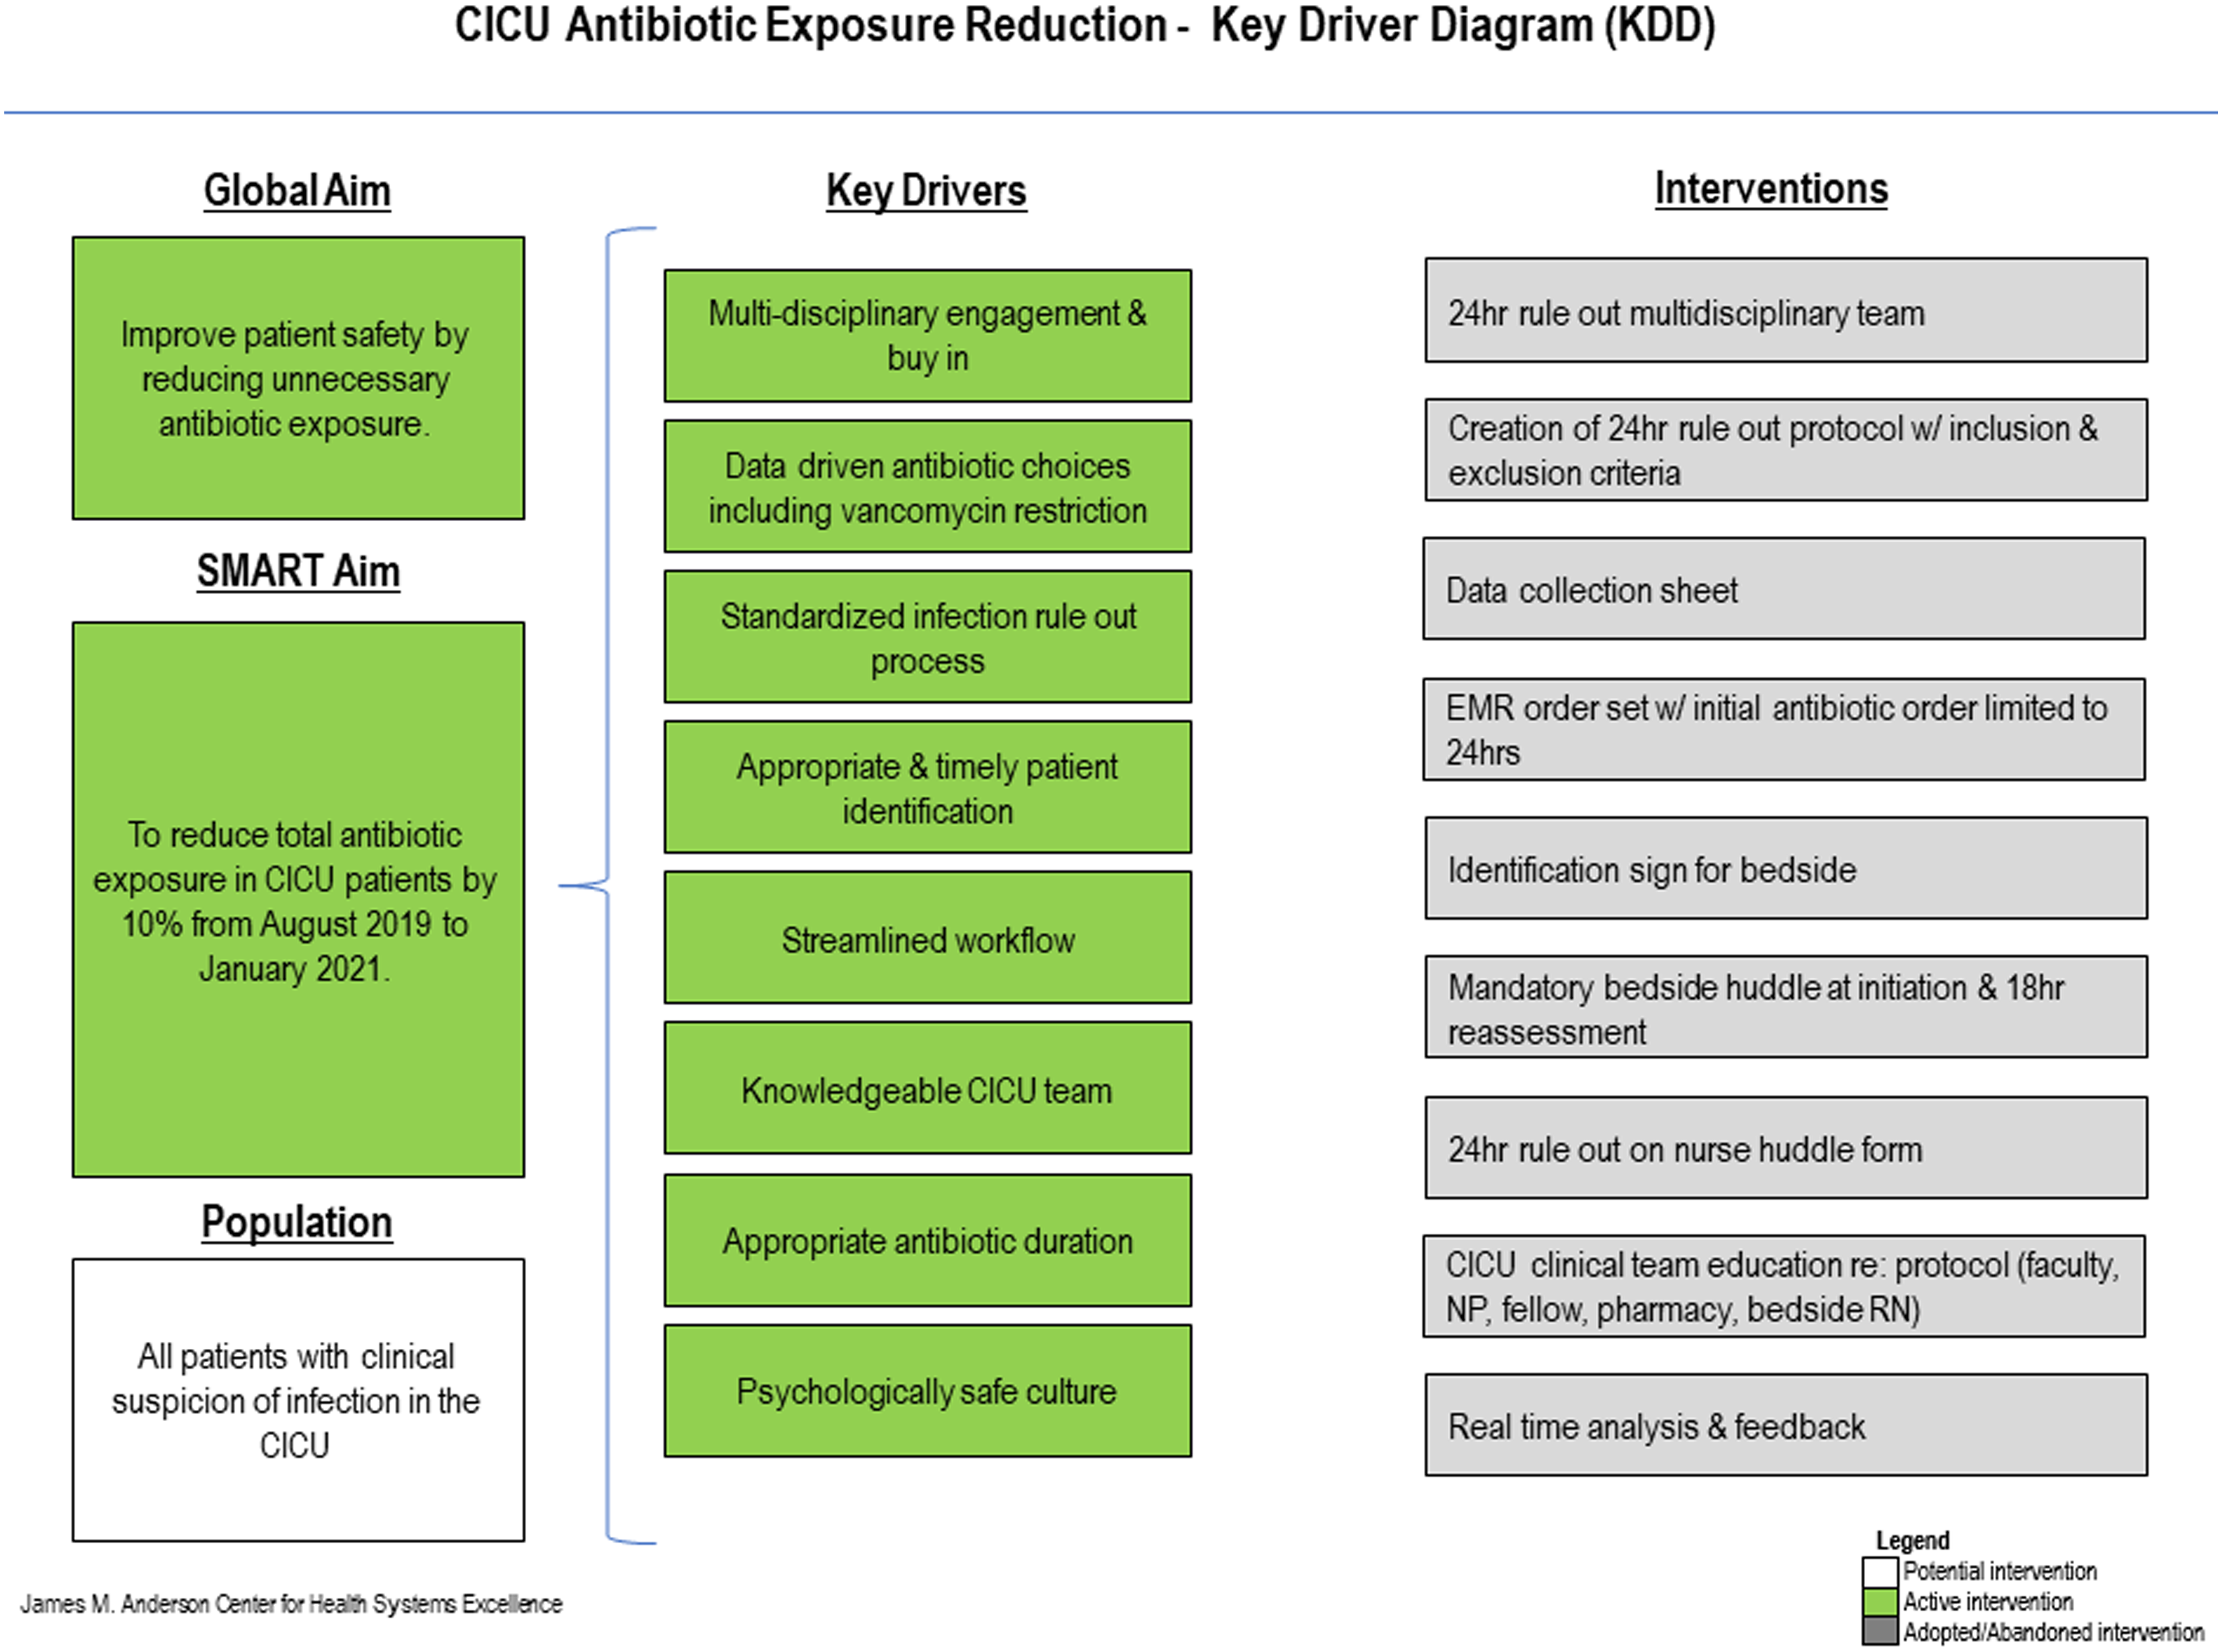
This quality improvement project was exempt from approval by the institutional review board. We followed SQUIRE 2.0 guidelines for design, analysis, and presentation of this project. Reference Ogrinc, Davies and Goodman18 A multidisciplinary team (ie, pharmacist, quality specialist, bedside nurses, pediatric advanced nurse practitioners, and attending physicians) developed and implemented this project using the model for quality improvement methodology with plan–do–study–act (PDSA) testing. Reference Crowl, Sharma and Sorge19 The project was directly endorsed by the CICU and nursing directors to improve buy-in. The primary key drivers for reducing the total antibiotic utilization rate were unit-based standardization of the infection diagnosis process, limitation of initial antibiotic prescription to 24 hours, decreasing indiscriminate use of vancomycin, improving bedside communication and situational awareness regarding antibiotic treatment as part of the infection diagnosis protocol (Fig. 1), and bacteria identification and discussion of all patients treated with 24-hour antibiotics during the morning unit-wide huddle of nursing and physician leads. Our specific, measurable, achievable, relevant, and time-bound (SMART) aim was to reduce total antibiotic utilization by 10% within 1 year.
Key driver diagram. Key driver diagram for our quality improvement project with the global aim to improve patient safety by reducing unnecessary antibiotic exposure. The theory for improvement is depicted with the specific interventions that drove plan–do–study–act (PDSA) cycles on the right. The primary intervention was the creation of a standardized 24-hour infection diagnosis protocol. Using a specific, measurable, achievable, relevant, and time-bound (SMART) process, we aimed to decrease total antibiotic utilization rate by 10% within 1 year.
24-hour protocol inclusion/exclusion
All CICU patients who did not meet the exclusion criteria were eligible for the protocol. No guidelines or stewardship protocols were in place regarding which patients should be evaluated for infection with cultures and antibiotics. The medical team had independent discretion for starting antibiotics as part of the infection diagnosis protocol; our quality improvement initiative provided guidance on antibiotic selection and duration. We included any patient with provider-determined concerns for infection without an obvious source (ie, fever, tachycardia, increased WBC count, etc). Patients meeting severe sepsis criteria were excluded before enrollment (ie, initiation or escalation of vasoactive inotropic support, fluid boluses >40 mL per kilogram per 24 hours, or respiratory support escalation). Reference Weiss, Peters and Alhazzani20 Patients with immunodeficiency, mechanical circulatory support, open sternum, and/or culture-proven infection within 72 hours were also excluded.
Standardized infection diagnosis protocol and order set
Upon meeting inclusion criteria, the entire clinical team was notified, and the 24-hour protocol electronic medical record (EMR) order set was activated (Supplementary Fig. 1 online). In this order set, blood and urine cultures, laboratory tests, and cefepime (with 24-hour hard stop) were prepopulated to facilitate standardization and to increase provider compliance. Prepopulated laboratory tests included complete blood count (CBC) with differential, C-reactive protein (CRP), and procalcitonin at initiation and 18 hours. Given the high rate of colonization and false-positive infection rates, respiratory cultures and viral PCR panels were discouraged unless respiratory symptoms were present. A data collection sheet was placed at the bedside upon protocol initiation to record laboratory values, culture results, antibiotics, and other details (Supplementary Fig. 2 online). Reasons for extending antibiotics beyond 24 hours were collected (eg, persistent fevers, increased inflammatory markers, or provider preference). The protocol recommended cefepime monotherapy, although the final antibiotic(s) treatment decision was determined by the treating team. Vancomycin use was strongly discouraged, with consideration for patients hospitalized ≥14 days or history of MRSA.
24-hour huddle
When the protocol was initiated, a visual identifier was placed on patient’s door displaying first antibiotic dose and time for bedside huddle, mandated at the time of the last antibiotic dose (Supplementary Fig. 3 online). Huddles were incorporated into the normal clinical workflow and were attended by the entire multidisciplinary treatment team; compliance was tracked. Patients receiving 24-hour antibiotics were identified, and their cases were reviewed during huddle times each morning during unit-wide situational awareness rounds led by physician and nurse leaders. The goals of huddle times were to ensure team communication, accountability, and consensus about the antibiotic plan. Laboratory values, clinical status, and vital-sign trends of antibiotic treatment were used to guide decision making for or against extending antibiotic treatment. Any extension with negative culture and no sepsis criteria was considered a protocol violation. A quality improvement team member provided real-time feedback for all antibiotic extensions that were deemed unnecessary. Cultures with positive results after 24-hour protocol antibiotics were administered were tracked.
Study periods and measures
A 12-month baseline period (August 2018–July 2019) was followed by an 18-month intervention period (August 2019 through January 2021). The primary outcome measure was the antibiotic utilization rate: percentage of CICU patient days with exposure to ≥1 antibiotic. Cefazolin was excluded in the denominator because all surgical patients receive it for 48 hours; thus, its use would not be affected by this project. The secondary outcome measure was the vancomycin utilization rate, defined as the percentage of CICU patient days with ≥1 dose. The process measure was the number of protocol violations. Balancing measures were the number of patients with positive cultures after discontinuation of protocol antibiotics and harm associated with initial vancomycin avoidance. The institutional pharmacy database provided the antibiotic use data.
Statistical process control and data analysis
Monthly total antibiotic and vancomycin utilization rates were tracked over time in p-charts, with PDSA cycles annotated. Standard statistical process control (SPC) rules for special-cause variation were used to identify significant system changes. Reference Bramwell21 The centerline represented the mean monthly antibiotic utilization rate and shifted during the intervention period at the first of 8 consecutive months below the baseline antibiotic utilization rate, which indicated special-cause variation. An exploratory analysis was performed in which CBC and inflammatory marker data were compared in those with and without culture-proven infection to determine potential utility in future antibiotic-continuation decision making. Continuous data are presented as means with standard deviation (SD) or medians with interquartile range (IQR). Categorical data are summarized as rates and percentages. Comparisons were made using the Student t test or the Mann-Whitney U test for continuous data and the χ2 test for categorical data. P < .05 was considered significant. All analyses were performed using SPSS version 27 software (IBM, Armonk, NY).
Results
Patients
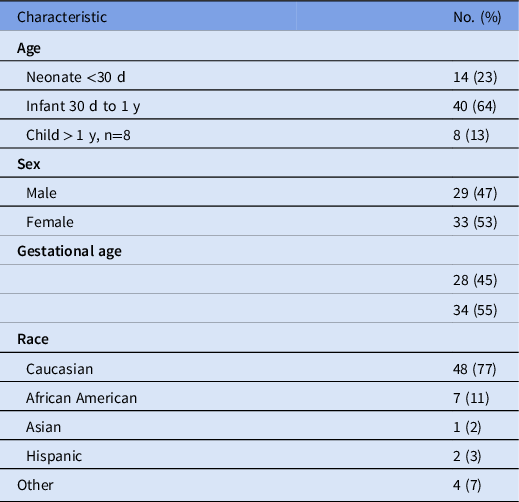
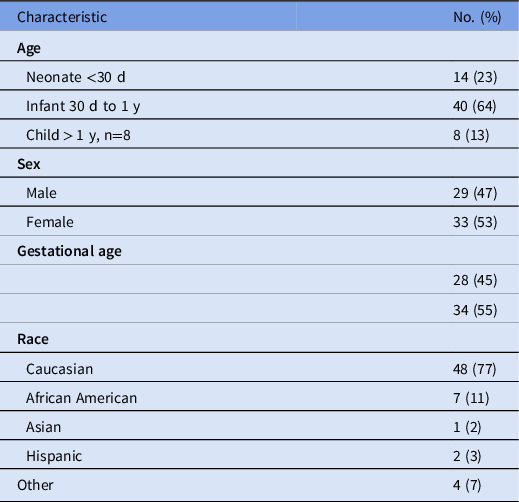
During the intervention, 950 unique patient admissions occurred, and 109 antibiotic treatments were initiated in 62 patients as part of the infection diagnosis protocol. Patient characteristics are shown in Table 1. All patients had central-venous access devices. Almost all of these patients were infants and neonates, and most were postoperative surgical patients. At the time of 24-hour antibiotics for the infection diagnosis protocol, 17 (16%) of 109 patients were already on antibiotic therapy.
Patient Characteristics (N = 62)
Clinical course of protocol patients
Of 109 24-hour antibiotics administered, 72 (66%) were completed without protocol violation. In total, 37 patients (34%) received >24 hours of antibiotics. Of these 37 patients, 10 (27%) received extended courses that were stopped between 48 and 72 hours after they were initiated. Indications for continuing antibiotics beyond 24 hours included sepsis or hemodynamic instability developing after protocol initiation (n = 5), positive culture or Gram stain (n = 13), persistent fever (n = 6), and provider preference without any objective infection signs (n = 13). There were no positive cultures in the provider-preference cohort. Furthermore, 6 patients had antibiotics reinitiated within 24 hours for the following indications: positive cultures (n = 2), elevated inflammatory markers (n = 2), fever (n = 1), and 1, briefly, for blood-culture contaminant. Among these 109 patients, 98 (90%) received cefepime and 35 (32%) received both cefepime and vancomycin.
Antibiotic exposure, primary and secondary outcomes
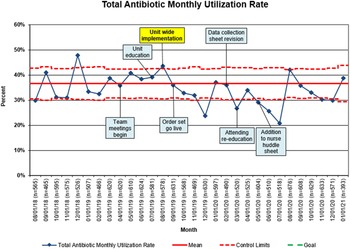
The total antibiotic utilization rate was 32.6% (SD, 6.1%) during intervention period, compared to 36.6% (SD, 5.4%) during the baseline period (mean difference, 4; 95% CI, −0.5 to −8.5; P = .07). In the SPC analysis, there was no change in the monthly mean total antibiotic utilization rate in the intervention period compared to the baseline period (Fig. 2). However, a trend for improvement occurred. We detected 6 intervention data points below the centerline mean after the EMR order set was initiated (February 1, 2020), which signaled a change in the system according to SPC rules. Reference Bramwell21
Total antibiotic monthly utilization rate. Statistical process control p-chart showing mean monthly total antibiotic utilization rate, representing percentage of patient days with exposure to any antibiotic except surgical prophylaxis. The baseline period was the first 12 months. The intervention period was the next 18 months, denoted by the yellow annotation box. There was no statistical change in rate (36.6%) during the intervention period, using traditional statistical process control rules. However, 6 data points are below the baseline centerline after the EMR order set was initiated, which signals a trend and change in the system.
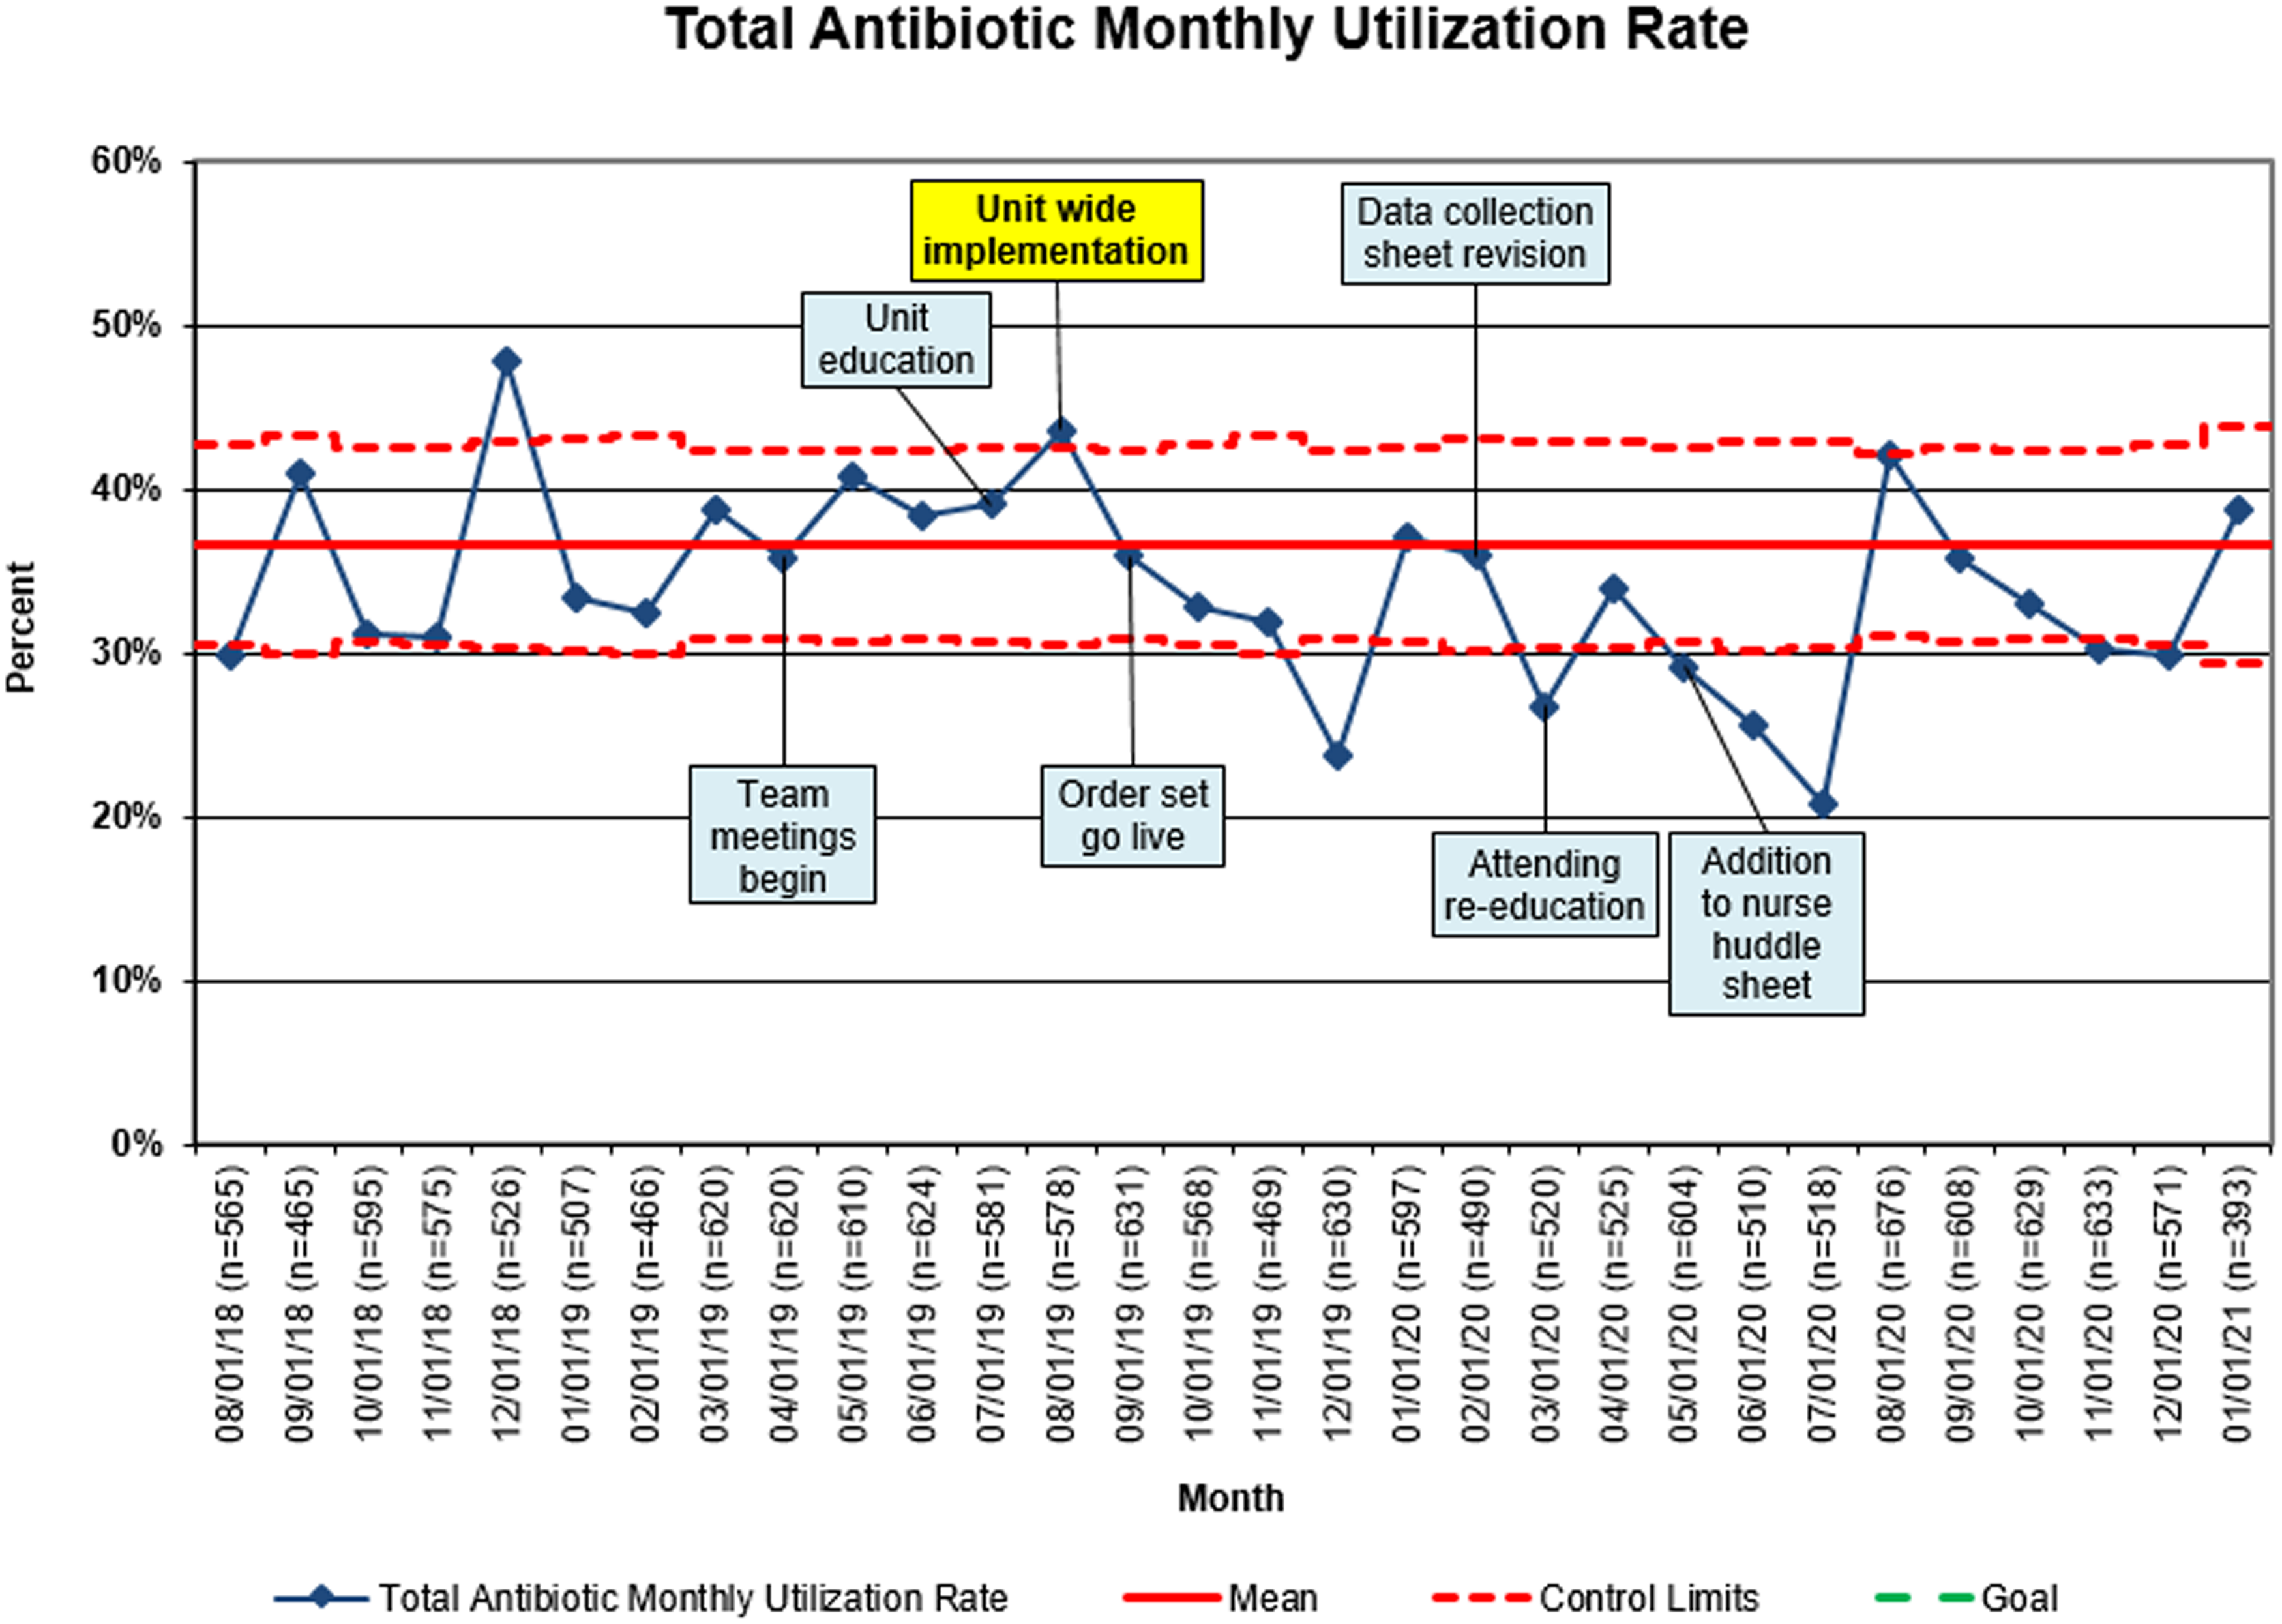
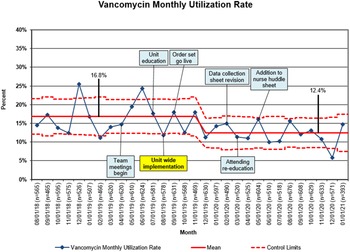
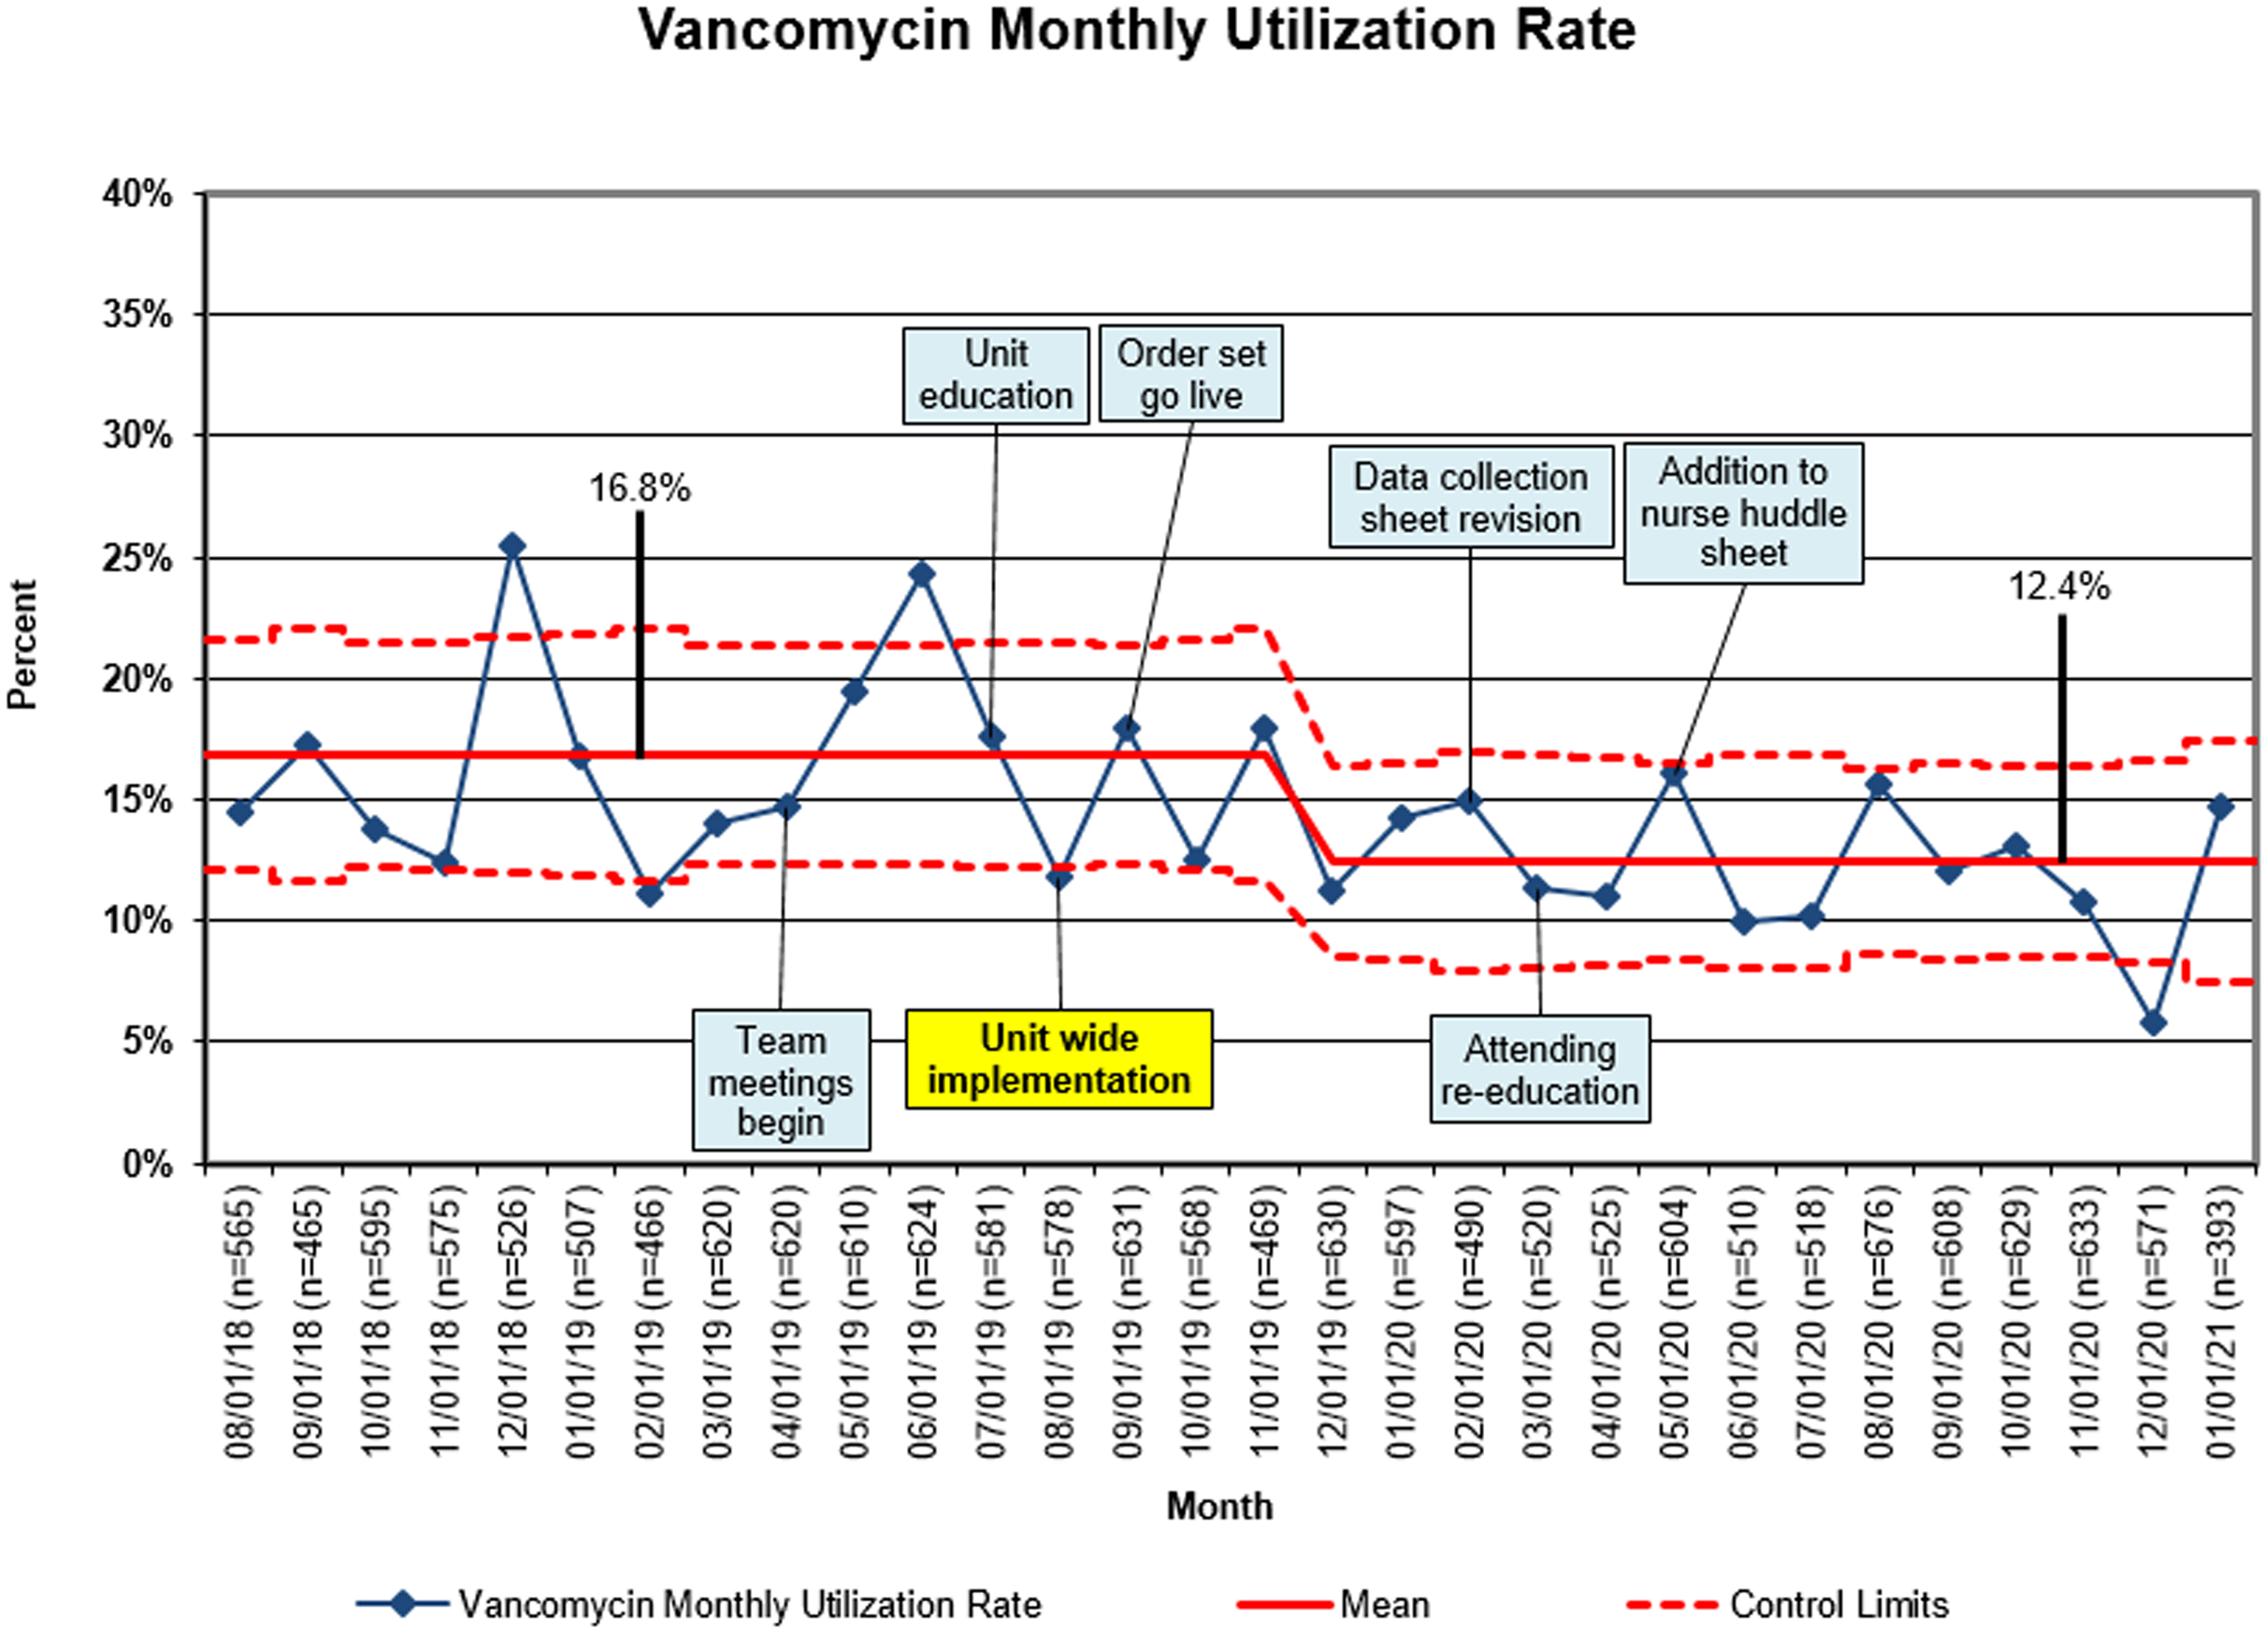
Figure 3 shows our secondary outcome, vancomycin utilization rate. There was special-cause variation with 13 consecutive intervention data points below the centerline mean starting December 1, 2019. This trend resulted in a downward centerline shift, representing a 26% reduction in mean monthly vancomycin utilization rate during the intervention period. The vancomycin utilization rate was 12.8% (SD, 3%) in the intervention period versus 16.8% (SD 4.4%) during the baseline period (mean difference, 4%; 95% CI, 1.2%–6.7%; P = .008).
Vancomycin monthly utilization rate. Statistical process control p-chart showing mean monthly vancomycin utilization rate, representing percentage of patient days with exposure to ≥1 dose of vancomycin. The baseline was the first 12 months. The intervention period was the next 18 months, denoted by the yellow annotation box. Starting during month 4 of the intervention, a special-cause variation occurred, as determined by 8 consecutive months below the baseline rate. A centerline shift represents a significant 26% reduction in the vancomycin utilization rate from 16.8% to 12.4% during the intervention period.
Positive cultures and balancing measures
In total, there were 13 positive cultures; 4 were blood cultures (Supplementary Table 1 online). We detected wide variability in hospital length of stay at the time of the infection diagnosis protocol that resulted in positive cultures (range, 5–326 days). Of 13 positive cultures, 11 grew during the 24 hours of observation, and antibiotics were appropriately extended. After protocol completion, 2 positive blood cultures and 1 positive respiratory culture occurred. One blood culture (methicillin-susceptible Staphylococcus aureus) was reported 26 hours after the first antibiotic dose, and antibiotics were reinitiated with a 2.5-hour treatment delay. The other blood culture was determined a contaminant by treating clinicians, and antibiotics treatment was stopped after 2 additional doses. The respiratory culture did not grow until 48 hours after culture collection; however, the patient had remained on antibiotics due to a positive Gram stain. All 3 of these patients had no cardiorespiratory instability.
Laboratory data
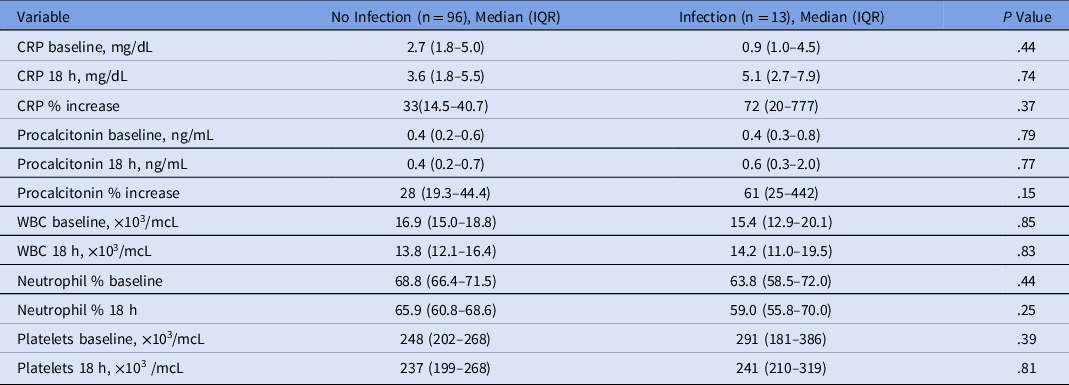
Table 2 shows an exploratory analysis of initial and 18-hour laboratory results stratified by presence of culture-positive infection. We did not detect a statistically significant difference in patients with and without infection in either baseline or 18-hour WBC, platelet, neutrophil, CRP, or procalcitonin metrics.
Infectious Laboratory Values
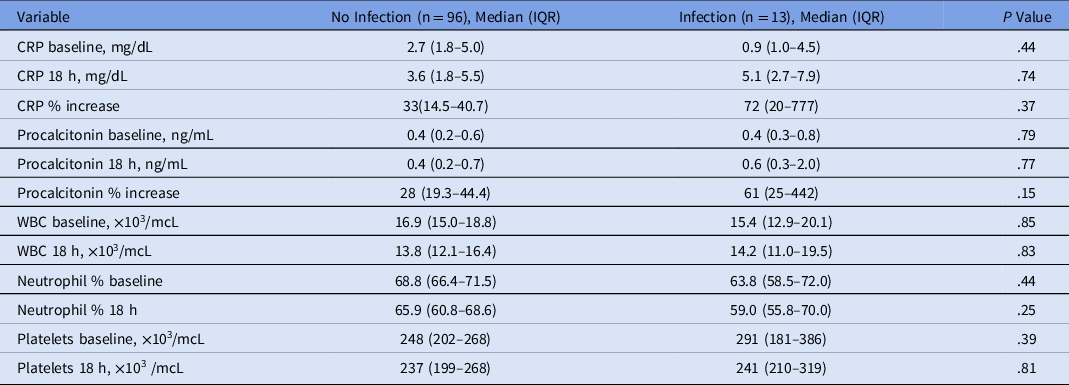
Note. IQR, interquartile range; CRP, C reactive protein; WBC, white blood cell count.
Discussion
A standardized approach to the management of infection evaluation in clinically stable children with cardiac disease, highlighted by a 24-hour antibiotic hard-stop protocol, is feasible and has the potential to decrease unnecessary antibiotic exposure in the CICU. The implementation of our 24-hour protocol increased clinical team awareness and shared decision making regarding infection diagnoses and responsible antibiotic use. This intervention contributed to a trend toward reduction in overall antibiotic utilization and a significant reduction in the use of the nephrotoxic agent vancomycin. Discontinuation of antibiotics at 24 hours in stable CICU children appears to be safe both early and late in the CICU course, with few missed positive cultures.
Antimicrobial stewardship programs and other interventions to standardize evaluation and management of potential infection are associated with decreased antibiotic exposure and potential for associated complications. Reference Rhodes, Evans and Alhazzani2,Reference Tribble, Lee and Flett22,Reference Begnaud, Lemoine and Broussard23 Initiatives in NICUs featuring algorithms that decrease infection-diagnosis antibiotic courses to 36 hours have been associated with decreased antibiotic utilization. Reference Bhat, Custodio and McCurley24,Reference Meyers, Tulloch and Brown25 Although a trend for improvement was observed, our quality improvement initiative failed to achieve our SMART aim of decreasing monthly total antibiotic exposure by 10%. The use of aggregate antibiotic utilization data limited our ability to demonstrate a reduction in the overall utilization rate because long courses of antibiotics for proven infection were not affected by this protocol. Perhaps extending the intervention arm would have demonstrated overall reduction, especially as provider comfort with this practice change grew. Importantly, during the intervention period, 72 patients had antibiotics limited to 24 hours compared to 0 in years prior. Thus, at the very minimum, 72 patients were exposed to 1–2 days fewer antibiotics with this protocol. Furthermore, an unintended benefit of this initiative may be that some courses of antibiotics as part of infection diagnosis were avoided altogether. Anecdotally, as providers gained comfort with this protocol and awareness of antibiotic harm, they reported that their threshold for antibiotics initiation in well-appearing children increased.
We have demonstrated a reduction in vancomycin utilization without harm. This result was likely achieved because, in addition to limiting antibiotics related to an infection-diagnosis elimination process to 24 hours, empiric vancomycin use was discouraged and was not preselected in the order set. Further studies are needed to determine whether fewer vancomycin (and other antibiotic) exposures lead to tangible decreases in cost and antibiotic-related complications such as acute kidney injury, enteritis, central-line entries, and colonization with drug-resistant organisms.
Most of the positive cultures were respiratory cultures, though we discouraged indiscriminate culturing of the endotracheal tube and it was not prepopulated in the order set. Data needed to evaluate whether cultures were indicated were not collected. Clearly, more work needs to be done to challenge the standard “panculture” paradigm for the infection diagnosis protocol. In the future, we will explore iterative improvements to this protocol to decrease respiratory cultures and, thus, reduce inappropriate treatment courses of antibiotics for the likely colonization of the endotracheal tube as opposed to true infection. Reference Prinzi, Parker, Thurm, Birkholz and Sick-Samuels26
Although 97% of our institution’s positive blood cultures grow within 24 hours, we were able to achieve relative provider buy-in to limit antibiotic courses, despite being novel and contrary to current practice in most pediatric CICUs. Mandatory bedside huddles facilitated an additional layer of provider comfort and were an essential part of the balancing measure by preventing automatic discontinuation of antibiotics without discussion in patients with subtle infection signs.
Fear of delayed recognition and treatment of sepsis have been shown to drive the decision to start empiric antibiotics in the pediatric critical-care population because consequences of delayed treatment can be severe. Reference Woods-Hill, Koontz and King27 Not unexpectedly, provider preference for extending antibiotics was frequent. Almost all providers extended antibiotics to traditional 48- or 72-hour courses and stopped when cultures were negative. Limiting antibiotics to 24 hours opposes current practice and culture, and complete provider buy-in takes time. The 24-hour protocol, including huddles and daily identification of patients, is now ingrained in our CICU culture and workflow. With more data and experience, there will be increased provider confidence that a 24-hour antibiotic hard stop for culture-negative CICU patients is beneficial and safe, as has been demonstrated in non–critically ill hospitalized neonates and infants. Reference Biondi, McCulloh and Staggs15 Extending this protocol to include other collaborative guidelines, including blood-culture collection stewardship, is an important consideration for the next steps in iterative improvements toward reducing unnecessary antibiotic exposure. Reference Woods-Hill, Colantuoni and Koontz28
To guide clinical decision making, repeated CBCs with differential, procalcitonin, and CRP levels were collected at the 18-hour re-evaluation time. Studies in the pediatric cardiac surgical population have shown the variable utility of CRP and procalcitonin to differentiate between inflammation and severe sepsis in the first week after cardiopulmonary bypass. Reference D’Souza, Guhadasan and Jennings29–Reference Farias, Villarreal and Dhargalkar31 We hypothesized that these data would give providers more confidence to stop antibiotics at 24 hours. Although it was underpowered, our exploratory analysis did not reveal absolute values or changes in baseline values that definitively differentiated patients with infection from those without. At this point, we cannot support or refute the use of these data to guide decision making regarding the infection diagnosis protocol. However, our providers reported feeling more comfortable stopping antibiotics with these data in hand. In future protocol iterations, we hope to eliminate these laboratory tests from the prepopulated order set.
This study had several limitations. Our results reflect a practice change in a single CICU and may not be applicable to others populations or locations, especially those without continuous rapid culture reading and genetic testing of organisms. Although our CICU acuity and demographics are typical of most North American CICUs, our center-specific antibiotic utilization and infection diagnosis practices, as well as antibiotic resistance patterns, may be different than those of other institutions and may lead to different impacts. It is likely that some providers chose not to formally initiate the protocol, so some children that had antibiotics as part of their infection diagnosis process were not recorded as such and had longer antibiotic courses despite negative cultures. The impact of this factor was a likely an underestimation of protocol violations by “provider preference” extensions of antibiotics. We can make no conclusions regarding whether these results are sustainable or will change over time. We measured all antibiotic exposure, but we could not measure provider intent, which decreased our ability to impact change and likely biased our results toward the null hypothesis. We did not measure resource utilization(s) as a balancing measure.
In conclusion, a standardized approach to evaluation and management of the infection-diagnosis process, featuring a 24-hour hard stop of antibiotics in asymptomatic, culture-negative patients, is feasible in the pediatric CICU. The concepts of this protocol, if adapted to other CICUs culture and workflow, have the potential to decrease unnecessary antibiotic exposure, as seen with the nephrotoxic agent vancomycin. This protocol did not lead to clinically important missed positive cultures. The next steps include moving this project into the maintenance phase, adding respiratory and blood-culture stewardship to the protocol, and continuing to change the paradigm that the infection-diagnosis elimination processes that includes antibiotic treatment in the CICU should be at least 48 hours.
Supplementary material
To view supplementary material for this article, please visit https://doi.org/10.1017/ice.2022.265
Acknowledgments
Financial support
No financial support was provided relevant to this article.
Conflicts of interest
All authors report no conflicts of interest relevant to this article.