Psychopathy is characterized as disturbances in interpersonal and affective functioning with impulsive behavioral and antisocial tendencies (Hare, Reference Hare, Gray, Laing and Noaks2002, Reference Hare2003). Even though the prevalence of psychopathy is estimated to be less than 1% among males in community settings, these affected individuals are believed to account for up to 50% of all serious crimes, and their recidivism rate is higher than for other offenders (Blair, Mitchell, & Blair, Reference Blair, Mitchell and Blair2007; Hare, Reference Hare2003; Neumann & Hare, Reference Neumann and Hare2008). Recent studies have reported that genetic factors influence psychopathic personality (Bezdjian, Tuvblad, Raine, & Baker, Reference Bezdjian, Tuvblad, Raine and Baker2011; Brook et al., Reference Brook, Panizzon, Kosson, Sullivan, Lyons and Franz2010; Fontaine, Rijsdijk, McCrory, & Viding, Reference Fontaine, Rijsdijk, McCrory and Viding2010; Waldman & Rhee, Reference Waldman, Rhee and Patrick2006). However, studies investigating the development of genetic and environmental etiology in psychopathic personality across development are still fairly limited. The current study aimed to fill this research gap by examining the genetic and environmental variance in both initial level and change in psychopathic personality from childhood to late adolescence.
Previous twin studies generally report that genetic and nonshared environmental factors contribute to the variance in psychopathic personality. This has been found across child (Bezdjian, Raine, Baker, & Lynam, Reference Bezdjian, Raine, Baker and Lynam2011; Bezdjian, Tuvblad, et al., Reference Bezdjian, Tuvblad, Raine and Baker2011; Fontaine et al., Reference Fontaine, Rijsdijk, McCrory and Viding2010; Viding, Blair, Moffitt, & Plomin, Reference Viding, Blair, Moffitt and Plomin2005), adolescent (Beaver, Vaughn, & Delisi, Reference Beaver, Vaughn and Delisi2013; Blonigen, Hicks, Krueger, Patrick, & Iacono, Reference Blonigen, Hicks, Krueger, Patrick and Iacono2006; Forsman, Lichtenstein, Andershed, & Larsson, Reference Forsman, Lichtenstein, Andershed and Larsson2008; Larsson, Andershed, & Lichtenstein, Reference Larsson, Andershed and Lichtenstein2006; Larsson et al., Reference Larsson, Tuvblad, Rijsdijk, Andershed, Grann and Lichtenstein2007; Taylor, Loney, Bobadilla, Iacono, & McGue, Reference Taylor, Loney, Bobadilla, Iacono and McGue2003) as well as adult samples (Blonigen et al., Reference Blonigen, Hicks, Krueger, Patrick and Iacono2006; Brook et al., Reference Brook, Panizzon, Kosson, Sullivan, Lyons and Franz2010). For example, in a sample of 7-year-old twins, the heritability of callous and unemotional traits was 67% (Viding et al., Reference Viding, Blair, Moffitt and Plomin2005). In another study, psychopathic personality was assessed in a set of adolescent twins using the Multidimensional Personality Questionnaire (Tellegen & Waller, Reference Tellegen, Waller, Boyle, Matthews and Saklofske2008). Genetic factors explained 45% of the variance in the fearless dominance subscale and 49% of the variance in the impulsive antisociality subscale, while nonshared environmental factors explained 55% and 51%, respectively (Blonigen, Hicks, Krueger, Patrick, & Iacono, Reference Blonigen, Hicks, Krueger, Patrick and Iacono2005). Participants in the Vietnam Era Twin Registry (mean age = 47.8 years) also completed the Multidimensional Personality Questionnaire (Tellegen & Waller, Reference Tellegen, Waller, Boyle, Matthews and Saklofske2008). Genetic factors explained 51% of the variance in fearless dominance and 32% of the variance in impulsive antisociality. The remaining variances in each of these two subscales were explained by nonshared environmental factors (Brook et al., Reference Brook, Panizzon, Kosson, Sullivan, Lyons and Franz2010). None of these aforementioned studies have found any significant shared environmental factors contributing to the variance in psychopathic personality. In addition, these studies have relied on data collected from one informant, and with a few exceptions (e.g., Fontaine et al., Reference Fontaine, Rijsdijk, McCrory and Viding2010; Viding et al., Reference Viding, Blair, Moffitt and Plomin2005), self-reported data were used most often.
Despite the emerging interest in examining the genetic and environmental basis of psychopathic personality, no study has examined the development of these effects from childhood through adolescence. The few longitudinal studies that exist have examined the genetic and environmental contribution to the stability (i.e., age–age correlations) in psychopathic personality. One study reported that 58% of the stable variance in fearless dominance and 62% of the stable variance in impulsive antisociality (Tellegen & Waller, Reference Tellegen, Waller, Boyle, Matthews and Saklofske2008) from ages 17 to 24 years was due to genetic factors, and the remaining variance was explained by the nonshared environment (Blonigen et al., Reference Blonigen, Hicks, Krueger, Patrick and Iacono2006). Another study reported that the stability in psychopathic personality from ages 16 to 17 to 19 to 20 years was primarily explained by genetic influences with no significant contribution from the shared and nonshared environment (Forsman et al., Reference Forsman, Lichtenstein, Andershed and Larsson2008). Although these studies suggest a strong genetic contribution to the stability of individual differences in psychopathic personality from late adolescence to young adulthood, there is a lack of understanding of how genetic and environmental factors contribute to the variance in initial level and change in psychopathic personality during earlier developmental periods (i.e., from childhood to late adolescence).
Moreover, research has shown that it is beneficial to use more than one informant when assessing complex traits such as psychopathic personality (Andershed, Kerr, Stattin, & Levander, Reference Andershed, Kerr, Stattin, Levander, Blaauw and Sheridan2002; Bezdjian, Tuvblad, et al., Reference Bezdjian, Tuvblad, Raine and Baker2011). Different informants are likely to report different aspects of behavior, partly because individuals behave differently in different situations and partly because some behaviors are more likely to be encountered and witnessed than certain other behaviors (Bartels et al., Reference Bartels, Hudziak, van den Oord, van Beijsterveldt, Rietveld and Boomsma2003). It is also generally believed that individuals with psychopathic traits cannot or will not provide valid information on their own behavior (Miller, Jones, & Lynam, Reference Miller, Jones and Lynam2011). There are only a few previous studies examining psychopathic personality that have included data collected from more than one informant. For example, the Antisocial Process Screening Device (Frick & Hare, Reference Frick and Hare2002) was administered to a sample of nonreferred youth. Significantly higher mean values were found for self-reports than for caregivers; cross-informant correlations ranged from .30 to .58 (Muñoz & Frick, Reference Muñoz and Frick2007). Another study examined the association between self-reports and observer ratings using the Psychopathy Q-Sort (Reise & Oliver, Reference Reise and Oliver1994). A mean difference (d = 0.33) and a correlation of r p = .32 were found between self-reports and observer ratings (Fowler & Lilienfeld, Reference Fowler and Lilienfeld2007). Using the Psychopathic Personality Inventory—Revised (Lilienfeld & Widows, Reference Lilienfeld and Widows2005), agreement between self-reports and peers was r p = .67; a slightly higher mean value (d = –0.08) was found for peers than for self-reports (Miller et al., Reference Miller, Jones and Lynam2011). Taken together, these findings show that there is some overlap as well as differences in the information provided by different informants. To shed further light on this issue, the present study included both self-report data and caregiver ratings in order to provide a more comprehensive account of psychopathic personality across childhood and adolescence.
The majority of previous cross-sectional studies have reported that genetic and nonshared environmental factors contribute to the variance in psychopathic personality (e.g., Larsson et al., Reference Larsson, Andershed and Lichtenstein2006). Longitudinal studies examining the development of psychopathic personality have only evaluated these traits at two time points and starting during adolescence (Blonigen et al., Reference Blonigen, Hicks, Krueger, Patrick and Iacono2006; Forsman et al., Reference Forsman, Lichtenstein, Andershed and Larsson2008). These studies have reported that the stability in psychopathic personality was primarily explained by genetic factors. These past studies may not have been sensitive and informative enough to capture new changes emerging at the transition period from childhood to adolescence or the specific genetic, shared and nonshared, environmental growth patterns involved because of limited time points investigated. For example, there are studies showing that the onset of puberty, characterized by a series of physiological changes in height, weight, body composition, circulatory and respiratory systems, hormone production (Marshal, Reference Marshal, Falkner and Tanner1978), and brain structure (Choudhury, Blakemore, & Charman, Reference Choudhury, Blakemore and Charman2006), is an important developmental milestone. As reflected in the development of antisocial behavior, Sampson and Laub (Reference Sampson and Laub1995) noted the importance of such life events as pubertal development as potential turning points for changes.
Thus, the present study aimed to fill this gap in the literature by using data from a large sample of twins, with data collected from both caregivers and youth on four occasions across development at ages 9–10, 11–13, 14–15, and 16–18 years. The overall aim of the present study was to examine the genetic and environmental etiology on the development of psychopathic personality from childhood through adolescence. To address this aim, we first examined the genetic and environmental contribution to the variance in psychopathic personality within each measurement time point; second, we examined the genetic and environmental contribution to the variance in both initial level and change (growth) in psychopathic personality from childhood to late adolescence using biometric latent growth curve modeling. As we used both caregiver ratings and youth self-reports, the current study has the unique opportunity to examine similarities and differences in the genetic and environmental variance components across the two informants.
Method
Participants
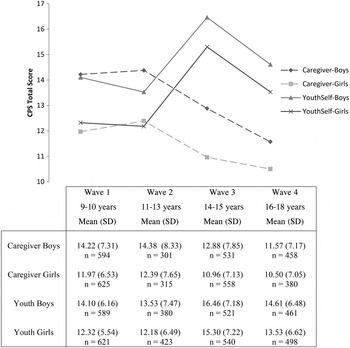
The current sample was drawn from participants in the University of Southern California Risk Factors for Antisocial Behavior twin study. This study is a prospective longitudinal study of the interplay of genetic, environmental, social, and biological factors on the development of antisocial and aggressive behaviors from childhood to emerging adulthood. Participating families were recruited from the Los Angeles community and the sample is representative of the ethnic and socioeconomic diversity of the greater Los Angeles area. To date, four waves of data have been collected, and the total sample contains 780 twin pairs born between 1990 and 1995. On the first assessment (Wave 1) the twins were 9–10 years old (N = 614 twin pairs, mean age = 9.60, SD = 0.59); on the second assessment (Wave 2), the twins were 11–13 years old (N = 445 twin pairs, mean age = 11.79, SD = 0.92); on the third assessment (Wave 3), the twins were 14–15 years old (N = 604 twin pairs, mean age = 14.87, SD = 0.87), and during Wave 4, the twins were 16–18 years old (N = 504 twin pairs, mean age = 17.28, SD = 0.77). Complete details on study protocol including zygosity determination can be found elsewhere (Baker, Tuvblad, Wang, Gomez, & Raine, Reference Baker, Tuvblad, Wang, Gomez and Raine2013). See Figure 1 for the number of participants by sex with complete data on the Child Psychopathy Scale (CPS) within each wave of assessment.
Mean Child Psychopathy Scale (CPS) total raw scores by rater and sex.

Measures
Psychopathic personality was assessed with the CPS, a well-validated measure for assessing psychopathic personality in youth (Lynam, Reference Lynam1997). The CPS was administered to all the twins and their primary caregivers across the four waves of data collection. The CPS was designed to operationalize psychopathic personality traits found in the Psychopathy Checklist—Revised (PCL-R; Hare, Reference Hare1991) during childhood and adolescence. Drawing items from the Child Behavior Checklist (Achenbach, Reference Achenbach1991) and the Common Language Q Set (a simplified version of the California Child Q Set; Caspi et al., Reference Caspi, Block, Block, Klopp, Lynam and Moffitt1992), the revised CPS (Lynam et al., Reference Lynam, Caspi, Moffitt, Raine, Loeber and Stouthamer-Loeber2005) assesses 13 of the 20 PCL-R constructs as 2- to 5-item scales: glibness, untruthfulness, manipulation, lack of guilt, poverty of affect, callousness, parasitic lifestyle, behavioral dyscontrol, lack of planning, impulsiveness, unreliability, failure to accept responsibility, and boredom susceptibility. The original 41-item CPS has undergone several revisions and expansions and the present version includes 58 items. The revision of the CPS was undertaken to simplify complex items and to increase the reliability and validity of several constructs that were not optimally operationalized in the original version (i.e., glibness and shallow affect; Lynam et al., Reference Lynam, Caspi, Moffitt, Raine, Loeber and Stouthamer-Loeber2005). Not all constructs from the PCL-R were included in the CPS, as they have no childhood counterparts (promiscuous sexual behavior, early behavior problems, many short term marital relationships, and revocation of conditional release) or did not correlate with other items (grandiosity). Two PCL-R items, criminal versatility and juvenile delinquency, were also not included so that the CPS might serve as a pure measure of personality uncontaminated by antisocial behavior (Lynam et al., Reference Lynam, Caspi, Moffitt, Raine, Loeber and Stouthamer-Loeber2005).
The validity of the CPS has been examined in several studies. A study examining delinquency in childhood, found that boys who scored high on the CPS were the most consequential offenders at ages 10 and 13 and their delinquent behaviors were most stable across the two ages. Those with high scores were more impulsive and more prone to externalizing disorders but not to internalizing disorders. High scores on the CPS also predicted severe delinquency above and beyond other established predictors, including socioeconomic status, IQ, previous delinquency, and impulsivity (Lynam, Reference Lynam1997). Additional studies have shown that the CPS is related to other meaningful constructs, including recidivism and poor treatment outcomes during adolescence (Falkenbach, Poythress, & Heide, Reference Falkenbach, Poythress and Heide2003), the five-factor model of personality (Lynam et al., Reference Lynam, Caspi, Moffitt, Raine, Loeber and Stouthamer-Loeber2005), and electrodermal hyporesponsivity (Fung et al., Reference Fung, Raine, Loeber, Lynam, Steinhauer and Venables2005).
In the present sample, the internal reliability (Cronbach α) of the total score was acceptable across waves and raters, caregiver: Wave 1 α = 0.80, Wave 2 α = 0.83, Wave 3 α = 0.84, and Wave 4 α = 0.85; youth: Wave 1 α = 0.75, Wave 2 α = 0.80, Wave 3 α = 0.78, and Wave 4 α = 0.71. The total scores were positively skewed and were therefore log transformed (each value was added by 1 and then multiplied by 10 before entering into the log transformation) using the statistical software SAS 9.1.3 (SAS Institute, 2005), in order to achieve a more normal distribution of scores within each wave. The skewness for caregiver ratings were 1.07, 1.23, 1.36, and 1.47 from Waves 1 to 4 before log transformation and changed to –0.01, 0.18, 0.25, and 0.31, respectively, after transformation. In youth self-reports, the skewness estimates were 0.94, 1.08, 0.50, and 0.66 from Waves 1 to 4 before log transformation, but all decreased to positive values smaller than 0.01 after transformations.
Attrition
As selective attrition may bias estimates in longitudinal analyses (Heath, Madden, & Martin, Reference Heath, Madden and Martin1998), we carried out several tests of differences between those subjects who participated in later waves (responders) and those who did not (nonresponders). Logistic regression analyses demonstrated nonsignificant odds-ratios for family socioeconomic status, based on the Hollingshead Four Factor Index of Social Status (Hollingshead, Reference Hollingshead1979; odds ratio [OR] = 0.99, 95% confidence interval [CI] = 0.98–1.01), twin's gender (OR = 0.79, 95% CI = 0.59–1.07), interview language (OR = 1.13, 95% CI = 0.76–1.69), nor for psychopathic personality (CPS; OR = 1.00, 95% CI = 0.97–1.03). However, responders and nonresponders were significantly different in ethnicity (OR = 0.70, 95% CI = 0.50–0.99), indicating Caucasians were slightly less likely to drop out.
Statistical analyses
Descriptive statistics and correlations
To examine whether there were any significant mean differences among the four waves of CPS total scores and to examine whether there was a significant interaction between wave and sex, a multilevel analysis of variance (ANOVA) was conducted using PROC MIXED in SAS statistical software (SAS Institute, 2005; ddfm = satterth was used in calculating the degrees of freedom) to account for the dependence between two twins in a pair. To get a first indication of the underlying sources of variance and the stability of the CPS scores, comparisons were made among intraclass twin correlations (Twin 1 to Twin 2 correlations within each wave) and across wave and rater correlations (Neale, Boker, Xie, & Maes, Reference Neale, Boker, Xie and Maes2003).
Univariate genetic analysis
Univariate genetic modeling was carried out to examine the contribution of additive genetic (A), shared environmental (C), and nonshared (E) environmental influences (ACE) to psychopathic personality within each of the four measurement time points at ages 9–10, 11–13, 14–15, and 16–18 years. To test for potential sex differences, three models were fit: Model 1 allowed for sex differences on a mean level in the observed phenotype as well as in the magnitudes of the ACE variance components, in Model 1a, the means were constrained to be equal across boys and girls, and in Model 1b, both the means and the ACE variance component were constrained to be equal across boys and girls.
Biometric growth curve analysis
Biometric growth curve analysis was conducted to examine how genetic and environmental factors drove the change of psychopathic traits across waves. Given variations in ages (range = 9–18) across the four waves, the linear effect of age was removed from the CPS score before it was entered into the biometric growth curve analysis.
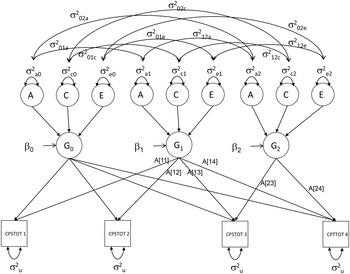
Three major hypotheses were tested through progressive model comparisons in this section. First, a piecewise growth curve model (Model 1, see Figure 2 for details) was proposed to test any new changes or variations in development of psychopathic traits at onset of puberty, against a standard single slope growth curve model (Model 2). Different from the standard single slope model which had two latent factors, level (G0) and the rate of change (G1), to represent the developmental trajectory of the CPS scores across the four waves, this piecewise model introduced a second rate of change (G2) representing new or unique changes emerging at the last two waves at ages 14–15 and 16–18 years. The basis coefficients A[t] are weights used to represent the function of time for the observations. In a piecewise model, two sets of basis coefficients were needed since there were two rates of changes. To differentiate, the basis coefficients were labeled A[11] to A[14] for G1 and A[23] to A[24] for G2. In the present study, A[11] = 0, A[14] = 0.33, A[23] = 0.67, A[24] = 1, while A[23] was a parameter subject to free estimation and A[24] = 1. The mean scores of these three latent factors (G0, G1, and G2) were denoted by β0, β1, and β2, respectively. The variance–covariance among G0 (intercept), G1 (Slope 1), and G2 (Slope 2) could then be decomposed into A, C, and E variance components.
Biometric piecewise growth curve model. A[11:14] = (0, 0.33, 0.67, 1), A[24] = 1, and A[23] was a free parameter in the present study. CPCTOT, CPS total score at Waves 1 to 4 (ages 9–10, 11–13, 14–15, and 16–18 years).

The next hypothesis to test was sex differences. Two models were thus compared: Model 3 constrained males and females to be equal on all variance components; Model 4 also constrained means to be equal across sexes in addition to the variance components.
After determining sex differences, the final hypothesis was to test the biometric sources of variations in level (G0) and rates of change (G1 and G2). For this purpose, we compared six different models: Models 5 and 6 were compared to determine whether genetic or shared environmental effects were more important for variation in the level, and Models 7, 8, 9, and 10 were used to compare the contribution of genetic and shared environmental effects to rates of change (G1 and G2).
Alternative models mainly compared the difference in the log-likelihood of nested models, which is distributed as a chi-square statistic (χ2). In addition, the suitability of the models were also determined by the comparative fit index which ranges between 0.0 and 1.0 with values closer to 1.0 indicating good fit, as well as the Bayesian information criterion and Akaike information criterion (Akaike, Reference Akaike1987), with smaller values indicating better fit (Raftery, Reference Raftery1995). All biometric models were fit to the data using the statistical software Mplus 5.2 (Muthén & Muthén, Reference Muthén and Muthén1998–2007).
Results
Descriptive statistics
A 4 (wave) × 2 (sex) ANOVA was conducted for both caregiver ratings and youth-self reports on total CPS scores to examine whether there was a significant change over time and whether this change interacted with sex. Main effect of wave was significant for both caregiver ratings, F (3, 783) = 5.76, p < .01, and youth self-reports, F (3, 869) = 20.98, p < .01, indicating significant mean differences across the four waves. The Cohen d values for differences between waves were small for both caregiver ratings (d W1–W2 = –0.04, d W1–W3 = 0.16, d W1–W42 = 0.28, d W2–W3 = 0.20, d W2–W4 = 0.31, d W3–W4 = 0.11) and youth self-reports (d W1–W2 = 0.06, d W1–W3 = –0.41, d W1–W42 = –0.15, d W2–W3 = –0.43, d W2–W4 = –0.20, d W3–W4 = 0.24). The main effect of sex was also significant for both raters, F (1, 1346) = 28.36, p < .01 for caregiver ratings, F (1, 1432) = 22.10, p < .01 for youth self-reports. The Cohen d values suggested that males consistently exhibited more psychopathic traits than females across all waves for both caregiver ratings (d = 0.32 in Wave 1, d = 0.25 in Wave 2, d = 0.26 in Wave 3, and d = 0.15 in Wave 4) and youth self-reports (d = 0.30 in Wave 1, d = 0.19 in Wave 2, d = 0.16 in Wave 3, and d = 0.16 in Wave 4). It is important that no significant Sex × Wave interaction was found; indicating the temporal changes in mean levels appeared consistent for both males and females. Please see Figure 1 for a plot of mean scores of CPS total score across waves by rater and sex.
Correlations
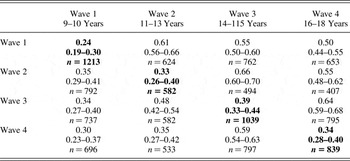
Phenotypic correlations for CPS scores are presented in Table A.3 in Appendix A. The CPS scores were moderately stable across development based on both caregiver ratings and youth self-reports, although somewhat lower based on youth self-reports. The cross-informant (interrater) correlations for Wave 1 (age 9–10 years) to Wave 4 (age 16–18 years) varied between .24 and .39, p < .05.
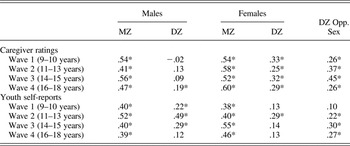
Intraclass twin correlations are presented in Table 1. The monzygotic (MZ) intraclass correlations were higher than dizygotic (DZ) intraclass correlations, suggesting genetic influences for psychopathic personality. However, in Wave 2 for the youth self-reports, the DZ correlations were more than half the MZ correlations, indicating shared environmental influences. All MZ intraclass correlations were less than one, which suggest influence of nonshared environment. Further, the low DZ twin correlations in caregiver ratings in males and self-reports in females may be due to nonadditive genetic effects, such as epistasis or dominance (Neale et al., Reference Neale, Boker, Xie and Maes2003). An ADE model was therefore tested and is discussed below.
Intraclass twin correlations for psychopathic personality

Note: Correlations are based on log transformed data. MZ, Monozygotic; DZ, dizygotic.
*p < .05. Transformed data.
Univariate genetic analysis
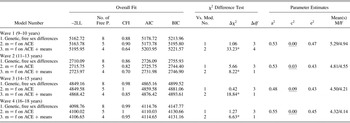
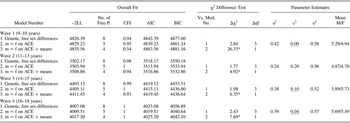
Next, univariate genetic models were fit separately within each informant (caregiver ratings and youth self-reports) and wave (ages 9–10, 11–13, 14–15 and 16–18 years, see Tables 2 and 3). For both caregiver ratings and youth self-reports across the four waves, Model 1b best described the data. In this model the ACE variance components were constrained to be equal across sex, but mean levels were allowed to differ between boys and girls. Squaring the standardized parameter estimates presented in Tables 2 and 3 provide the relative genetic and environmental contributions to the phenotypic variance in psychopathic personality.
Univariate genetic model fit results and parameter estimates for caregiver ratings

Note: The saturated model had 25 free parameters with –2 log likelihood (–2LL) = 5131.69, –2LL = 2684.70, –2LL = 4829.77, and –2LL = 4081.25 from Waves 1 to 4. CFI, Comparative fit index; AIC, Akaike information criterion; BIC, Bayesian information criterion; Δχ2, difference in log likelihoods between models; A, additive genetic; C, shared environment; E, nonshared environment; M, male; F, female. The underscored estimates are nonsignificant.
Univariate genetic model fit results and parameter estimates for youth self-reports

Note: The saturated model had 25 free parameters with –2 log likelihood (–2LL) = 4805.77, –2LL = 483.77, –2LL = 4385.30, and –2LL = 3998.24 from Waves 1 to 4. CFI, Comparative fit index; AIC, Akaike information criterion; BIC, Bayesian information criterion; Δχ2, difference in log likelihoods between models; A, additive genetic; C, shared environment; E, nonshared environment; M, male; F, female. The underscored estimates are nonsignificant.
For caregiver ratings in Wave 1 (9–10 years), 53% of the variance in psychopathic personality was due to genetic factors and 47% was due to nonshared environmental factors. In Wave 2 (11–13 years), 53% of the variance was due to genetic factors, 3% was due to shared environmental factors (ns), and 43% was due to nonshared environmental factors. In Wave 3 (14–15 years), 48% of the variance was due to genetic factors, 9% was due to shared environmental factors (ns), and 43% was due to nonshared environmental factors. In Wave 4 (16–18 years), 55% of the variance was due to genetic factors and 45% was due to nonshared environmental factors.
For youth self-reports in Wave 1 (9–10 years), 42% of the variance was due to genetic factors and 58% was due to nonshared environmental factors. In Wave 2 (11–13 years), 24% of the variance was due to genetic factors, 20% was due to shared environmental factors, and 56% was due to nonshared environmental factors. In Wave 3 (14–15 years), 38% of the variance was due to genetic factors, 10% was due to shared environmental factors (ns.), and 52% was due to nonshared environmental factors. In Wave 4 (16–18 years), 39% of the variance was due to genetic factors, 4% was due to shared environmental factors (ns), and 57% was due to nonshared environmental factors.
Notably, we observed low DZ twin correlations in caregiver ratings in males and in youth self-report in females. This may be due to some bias in the reports of the CPS or due to nonadditive genetic effects (i.e., dominance or epistasis). Comprehensive model fitting analyses of the data revealed that a model estimating additive genetic and nonshared environmental effects fit the data better than a model with nonadditive genetic effects (caregiver ratings, Wave 1: Δχ2 = 1.33, df = 2, p = .51; Wave 2: Δχ2 = 0.01, df = 2, p = .99; Wave 3: Δχ2 = 0.001, df = 2, p = 1.00; Wave 4: Δχ2 = 0.001, df = 2, p = 1.00. Youth self-report, Wave 1: Δχ2 = 0.09, df = 2, p = .96; Wave 2: Δχ2 = 0.001, df = 2, p = .99; Wave 3: Δχ2 = 0.01, df = 2, p = .99; Wave 4: Δχ2 = 0.010, df = 2, p = .99). Even though the low DZ correlation might suggest nonadditive genetic effects at work, the moderate resemblance among DZ opposite sex twin pairs suggests otherwise; for a comprehensive discussion see Bezdjian, Raine, et al. (2011).
Biometric growth curve analysis
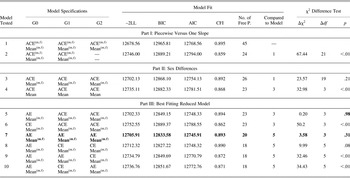
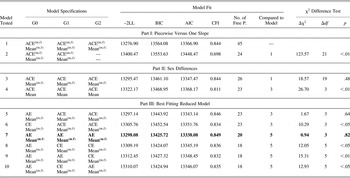
Ten different models were compared for each informant (caregiver ratings and youth self-reports) in order to test three major hypotheses. The results were largely consistent across informants (see Tables 4 and 5 for details). The comparison between Models 1 and 2 suggested that the piecewise model performed far better than the standard single slope model in both caregiver ratings and youth self-reports (caregiver ratings: χ2 (21) = 67.44, p < .01; youth self-reports: χ2 (21) = 123.57, p < .01). Subsequent comparison (Models 4 and 5) was thus conducted to test any sex differences in the piecewise model. The results indicated that males and females demonstrated no significant difference in any variance components, caregiver ratings: χ2 (19) = 23.57, p = 0.21; youth self-reports: χ2 (19) = 18.57, p = 0.48, but they differed significantly on means (i.e., levels and rates of change), caregiver ratings: χ2 (3) = 32.98, p < .01; youth self-reports: χ2 (3) = 26.70, p < .01, regardless of informant.
Model comparisons of biometric growth curve model for caregiver ratings

Note: The saturated model has 220 free parameters with –2 log likelihood (–2LL) = 12368.74. CFI, Comparative fit index; AIC, Akaike information criterion; BIC, Bayesian information criterion; Δχ2, difference in log likelihoods between models; A, additive genetic; C, shared environment; E, nonshared environment; m,f, males ≠ females. The final model is in bold.
Model comparisons of biometric growth curve model for youth self-report

Note: The saturated model has 220 free parameters with –2 log likelihood (–2LL) = 12991.96. CFI, Comparative fit index; AIC, Akaike information criterion; BIC, Bayesian information criterion; Δχ2, difference in log likelihoods between models; A, additive genetic; C, shared environment; E, nonshared environment; m,f, males ≠ females. The final model is in bold.
The final set of comparisons indicated that, for both caregiver ratings and youth self-reports, dropping all the shared-environmental effects did not worsen the model fit, Model 7: χ2 (3) = 3.58, p = .31 for caregiver ratings; χ2 (3) = 0.94, p < .01 for youth self-reports, suggesting that variations in levels and both rates of changes were mainly due to genetic and nonshared environmental influences (i.e., AE structure for G0, G1, and G2). Although Model 8 of caregiver ratings (AE for G0 but CE for G1 and G2) brought insignificant difference in fit too, χ2 (5) = 9.95, p = 0.08, Model 7 was preferred as the final model as it fit better than Model 8 on both Akaike information criterion (12745.91 for Model 7 vs. 12748.32 for Model 8) and comparative fit index (0.893 for Model 7 vs. 0.890 for Model 8) indices.
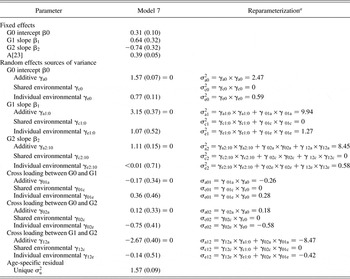
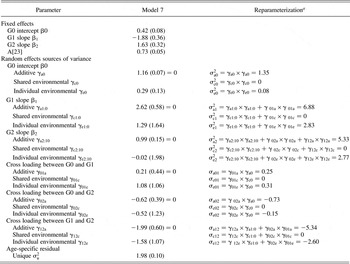
Estimates from Model 7 (AE structure for G0, G1 and G2) indicated that for caregiver ratings about 81% of variance in G0, 89% of variance in G1, and 94% of variance in G2 were explained by genetic factors, while for youth self-reports, these three proportions were 94%, 71%, and 66%, respectively (see Tables A.1 and A.2 in Appendix A for details about how to calculate these proportions). There was negligible covariance of G0 with either G1 or G2 but a significant negative genetic covariance between G1 and G2. About 95% of the total covariance between G1 and G2 was attributed to this genetic covariance for caregiver ratings, while it was 67% for youth self-reports. This indicates that the new changes of psychopathic traits emerging at Wave 3 would be few if the participant already exhibited a rapid change in psychopathic traits from the very beginning. The larger contribution of genetic variance and covariance to both change scores in caregiver ratings than youth self-reports suggest that caregivers viewed changes in their children to be more similar as compared to how the children viewed themselves.
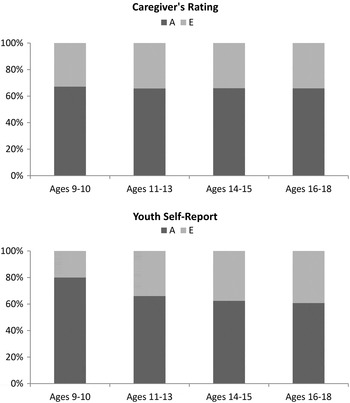
Two stacked histograms based on this model were plotted, separately for caregiver and youth to show how the expected relative contribution of genetic and nonshared environmental factors to variation in CPS scores develop across ages 9–10, 11–13, 14–15, and 16–18 years (see Figure 3). The contribution of genetic factors decreased over time based on youth self-reports, whereas it remained almost unchanged for caregiver ratings. As a result, an increasing contribution of nonshared environmental factors was observed for youth self-reports, but this contribution was stable for caregiver ratings.
Genetic, shared, and nonshared environmental influences on psychopathic personality across waves: caregiver ratings and youth self-reports. The expected relative propotions of additive genetic (A), shared enviromental (C), and nonshared environmental (E) variances contributing to the change of psychopathic personality over time from Waves 1 to 4 (9–10, 11–13, 14–15, and 16–18 years) based on the biometric latent growth modeling using log transformed data. Residual error at each time point is removed from these proportional effects.

Discussion
The purpose of the current study was to examine the development of the genetic and environmental etiology in psychopathic personality from childhood through adolescence. Both caregiver ratings and youth self-reported data were collected and utilized at four waves of assessment: when the twins were 9–10, 11–13, 14–15, and 16–18 years old. The results suggested that a piecewise growth curve model, in which the first change score (G1) influenced all four waves (9–10, 11–13, 14–15, and 16–18 years) and the second change score (G2) only influenced ages 14–15 and 16–18 years, fit the data better than the standard single slope growth curve model, supporting a turning point from childhood to adolescence. Variations in levels and both change scores were mainly due to genetic and nonshared environmental influences (i.e., AE structure for G0, G1, and G2). No sex differences were found except on the mean values of levels and change scores. Based on caregiver ratings, about 81% of variance in G0, 89% of variance in G1, and 94% of variance in G2 were explained by genetic factors, whereas these three proportions were 94%, 71%, and 66%, respectively, for youth self-reports.
Results within each measurement time point
Based on caregiver ratings, results within each wave of data collection (ages 9–10, 11–13, 14–15, and 16–18 years) showed that genetic and nonshared environmental factors contributed about equally to the variation in psychopathic personality. There was some trend of increasing contribution from the shared environment between ages 11–13 and 14–15 years, but these effects were nonsignificant. Based on youth self-reports, the results showed within each wave of data collection that genetic and nonshared environmental factors contributed to the variation in psychopathic personality. However, the variance proportion due to the genetic factors was smaller, and in turn the variance due to nonshared environmental factors was larger, as compared to caregiver ratings. In addition, there was also a larger contribution from the shared environment, and this contribution was even significant at age 11–13 years. Overall, these findings are consistent with previous cross-sectional research examining genetic and environmental influences on psychopathic personality. This line of research has consistently shown that the variance in psychopathic personality is primarily explained by genetic and nonshared environmental factors, with the shared environment being of minimal importance (e.g., Bezdjian, Raine, et al., Reference Bezdjian, Raine, Baker and Lynam2011; Bezdjian, Tuvblad, et al., Reference Bezdjian, Tuvblad, Raine and Baker2011; Larsson et al., Reference Larsson, Andershed and Lichtenstein2006, Reference Larsson, Tuvblad, Rijsdijk, Andershed, Grann and Lichtenstein2007; Taylor et al., Reference Taylor, Loney, Bobadilla, Iacono and McGue2003; Viding et al., Reference Viding, Blair, Moffitt and Plomin2005; see also the meta-analysis by Waldman and Rhee, Reference Waldman, Rhee and Patrick2006).
Further, consistent with previous research (Nicholls, Ogloff, Brink, & Spidel, Reference Nicholls, Ogloff, Brink and Spidel2005), our analyses revealed higher mean values of psychopathic personality (i.e., CPS total score) in males than in females, based on both caregiver ratings and youth-self reports, thus indicating that these traits are more prevalent among males than females. However, no differences in the magnitude in genetic and environmental variance components were found across males and females. This finding is consistent with results from other studies investigating sex differences in the genetic and environmental etiology of psychopathic personality in adolescent samples (e.g., Forsman et al., Reference Forsman, Lichtenstein, Andershed and Larsson2008; Waldman & Rhee, Reference Waldman, Rhee and Patrick2006).
Longitudinal results
Our findings that the initial level (G0) in psychopathic personality was to a large extent explained by genetic factors (caregiver A = 81%, youth A = 94%) and to a lesser extent by the nonshared environment (caregiver E = 19%, youth E = 6%), are in line with previous longitudinal studies on psychopathic personality. Blonigen et al. (Reference Blonigen, Hicks, Krueger, Patrick and Iacono2006) reported that the stability in fearless dominance and impulsive antisociality from late adolescence (age 17) to early adulthood (age 24) using self-reports was mainly explained by genetic factors and to a lesser extent by nonshared environmental factors. A study using a set of Swedish twins reported that genetic factors contributed to the stability in psychopathic personality measured on two occasions via self-reports at ages 16–17 and 19–20 years (Forsman et al., Reference Forsman, Lichtenstein, Andershed and Larsson2008).
A study using three waves of data from the Minnesota Twin and Family Study, utilizing biometric latent growth curve models, showed that genetic influences were largely responsible for initial level of antisocial personality disorder symptoms from late adolescence to midadulthood, while nonshared environmental influences were primarily responsible for change (Burt, McGue, Carter, & Iacono, Reference Burt, McGue, Carter and Iacono2007). Blonigen et al. (Reference Blonigen, Hicks, Krueger, Patrick and Iacono2006) and Forsman et al. (Reference Forsman, Lichtenstein, Andershed and Larsson2008) also reported that “new” or innovative variance in psychopathic personality at Time 2 was primarily explained by nonshared environmental factors. In contrast to these findings, we found that the largest contribution to the variance in both change scores was genetic factors (caregiver G1 A = 89%, G2 A = 94%, youth G1 A = 71%, G2 A = 66%). A novel finding in the present study was significant genetic factors contributing to the variance of both change scores in psychopathic personality. The first change score (G1) influenced all four waves (9–10, 11–13, 14–15, and 16–18 years), whereas the second change score (G2) only influenced Wave 3 (14–15 years) and Wave 4 (16–18 years). Thus, genetic factors contributing to the variance in the second change score in youth may reflect the onset of puberty and the expression of a “new” set of genes (Jacobson, Prescott, & Kendler, Reference Jacobson, Prescott and Kendler2002). Onset of puberty in early adolescence also marks important social changes. Adolescents are likely to spend more time outside the home and as a result they may be less closely supervised. Peers become increasingly more important, and an individual may actively select an environment that is more strongly correlated with his/her phenotypes. Our finding that genetic factors are contributing to the variance in the second change score could therefore also reflect active gene–environment correlation, whereby an individual actively seeks out environmental situations that are more closely matched to the person's genotype (Narusyte, Andershed, Neiderhiser, & Lichtenstein, Reference Narusyte, Andershed, Neiderhiser and Lichtenstein2007; Neiderhiser et al., Reference Neiderhiser, Reiss, Pedersen, Lichtenstein, Spotts and Hansson2004; O'Connor, Deater-Deckard, Fulker, Rutter, & Plomin, Reference O'Connor, Deater-Deckard, Fulker, Rutter and Plomin1998). As a consequence, these genetic factors seen at ages 14–15 and 16–18 years may include both additive genetic factors and the effects of active gene–environment correlation.
Genetic factors were more or less stable across time based on both informants (see Figure 3). Nonshared environmental factors were almost constant for caregiver ratings across development but were slightly increasing based on youth self-reports. Nonshared environmental factors include experiences that are unique to each twin (e.g., having your own peer group and different leisure activities). Previous behavioral genetic studies have generally shown that genetic and shared environmental influences for a specific trait or behavior vary across age. For example, the heritability of general cognitive ability have been found to increase during the life span, whereas the effects of the shared environment decrease from moderate during childhood to negligible levels after adolescence (Plomin, DeFries, McClearn, & McGuffin, Reference Plomin, DeFries, McClearn and McGuffin2008). However, previous longitudinal studies on psychopathic personality have not explored the genetic and environmental etiology using latent growth curve modeling.
Informant (dis)agreement
The cross-informant correlations ranged from .24 to .39. While these correlations are somewhat low, they are typical of what is generally found for rater agreement. For example, a meta-analysis on behavioral/emotional problems including 119 studies (269 samples, age 1.5–19 years) reported mean correlations of .22 between subjects and other informants, .60 between similar informants (e.g., parent/parent), and .28 between different informants (e.g., parent/teacher; Achenbach, McConaughy, & Howell, Reference Achenbach, McConaughy and Howell1987). Cross-informant correlation of the Antisocial Process Screening Device (Frick & Hare, Reference Frick and Hare2002) scales ranged from .30 and .58 in a community sample of adolescents (Muñoz & Frick, Reference Muñoz and Frick2007) and was .32 between self-reports and observer ratings for psychopathic personality in an undergraduate sample (Fowler & Lilienfeld, Reference Fowler and Lilienfeld2007).
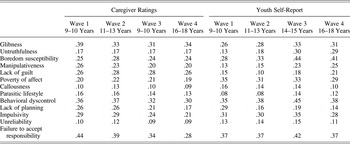
Youth reported a trend of higher mean values compared with caregivers for 9 of the 13 subscales of the CPS at ages 14–15 and 16–18 years: untruthfulness, boredom susceptibility, manipulativeness, poverty affect, callousness, behavioral dyscontrol, impulsivity, unreliability, and failure to accept responsibility (see Table A.4 in Appendix A). In contrast, caregivers reported a trend of higher mean values than youth for 6 of the 13 CPS subscales at ages 9–10 years and 11–13 years: glibness, boredom susceptibility, lack of guilt, parasitic lifestyle, lack of planning, and failure to accept responsibility. In addition, our ANOVA results indicated that for caregiver ratings there was a decreasing trend across development, whereas youth-self reports showed an overall increasing trend with a peak at age 14–15 years in psychopathic personality. Mean differences between self-reports and other informants on psychopathic personality have previously been reported (Fowler & Lilienfeld, Reference Fowler and Lilienfeld2007; Muñoz & Frick, Reference Muñoz and Frick2007). One possible explanation for this pattern in our results may be that as the children get older they become more autonomous, and parents are less aware of their whereabouts. In addition, as children mature, they may become better at masking or disguising their traits and behaviors, in this case their psychopathic personality. Further, the internal consistencies based on youth self-reports were slightly lower than for caregiver ratings. This may indicate that it is more difficult for children, specifically at a younger age, to fully understand and provide adequate responses to structured questionnaires. Previous studies have also suggested that it may be easier for caregivers to better understand complex constructs (Bartels et al., Reference Bartels, Hudziak, van den Oord, van Beijsterveldt, Rietveld and Boomsma2003; Lynam, Reference Lynam1997). In addition, the larger contribution of genetic factors to the variation and covariance of both change scores in caregiver ratings as compared to youth self-reports indicated that the caregiver viewed changes in their children to be more similar when compared to how the children viewed themselves.
Together our findings demonstrate the importance of having ratings from two different informants, thus providing overlapping but different perspectives of psychopathic personality throughout development. While caregiver ratings of these traits are valuable, youth self-reports provide an introspective (and perhaps, private) view of their own behaviors that caregivers may not necessarily be privy to. These findings further suggest that, depending on the age of the child, different informants may be providing more effective information; when subjects are at a younger age caregiver reports may be more accurate, whereas during teen age years self-reports is probably more appropriate.
Limitations
A few limitations in the present study must be considered when interpreting these findings. First, bear in mind we only used one particular measure, the CPS, to assess psychopathic personality in a community sample of twins. However, previous findings have demonstrated the CPS to be a valid assessor of psychopathic personality in youths (Lynam, Reference Lynam1997; Lynam et al., Reference Lynam, Caspi, Moffitt, Raine, Loeber and Stouthamer-Loeber2005), as well as in a community sample of twins (Bezdjian, Raine, et al., Reference Bezdjian, Raine, Baker and Lynam2011; Isen et al., Reference Isen, Raine, Baker, Dawson, Bezdjian and Lozano2010). In addition, the total psychopathy score from the CPS has demonstrated good psychometric properties (Lynam, Reference Lynam1997). Second, as in other longitudinal samples, we had some attrition across the four waves of data collection. Apart from the slight ethnic difference, our attrition analyses indicated that those that discontinue participating in our study do so in a random manner. Third, there are several assumptions related to the classical twin design. A chief assumption is that MZ twin pairs are no more likely than DZ pairs to share the environmental factors that are etiologically relevant to the phenotype under study. If the equal environment assumption is violated, then higher correlations among MZ twins may be due to environmental factors rather than genetic factors, and heritability estimate may be overestimated. A more detailed discussion of these and other assumption in the classical twin design in relation to psychopathology can be found elsewhere (Tuvblad & Baker, Reference Tuvblad, Baker, Huber, Bannasch and Brennan2011).
Conclusions
The results in the present study demonstrated that within each measurement time point (ages 9–10, 11–13, 14–15, and 16–18 years) genetic and nonshared environmental factors primarily contributed to the variance in psychopathic personality. Based on longitudinal analyses across development from ages 9 to 18 years, genetic as well as nonshared environmental factors were important in explaining the variance in psychopathic personality and changes emerging around ages 14–15 years. Our results further highlight the importance of considering different informants in studying the development of psychopathic traits. Although each provides crucial and unique pieces of information, their respective utility in research may vary across the age of the child.
Appendix A
Parameter estimates for Model 7 for caregiver ratings on Cholesky decomposition of variance–covariance matrix

Parameter estimates for Model 7 for youth self-report based on Cholesky decomposition of variance–covariance matrix

Phenotypic correlations, 95% confidence intervals, and number of participants (n) for Child Psychopathy Scale score

Mean values across the 13 subscales included in the total child Psychopathy Scale score