
1. Introduction
Dynamic stall is a highly unsteady aerodynamic phenomenon with many complex viscous phenomena attributed to the rapid movement of a wing or sudden change of the incoming flow condition. In a deep dynamic stall, the formation of a large-scale leading-edge vortex (LEV), also known as the dynamic stall vortex (DSV), is a classical hallmark. Generally, the DSV causes a transient lift overshoot and stall delay, but its aftward movement leads to a rapid change in the pitching moment, which may also cause negative damping and flutter (Corke & Thomas Reference Corke and Thomas2015). The detachment of the DSV further leads to massive flow separation on the wing surface and, therefore, a sharp lift drop. To explain the deep-level flow mechanism of these flow phenomena and manage the flow more efficiently, the physical mechanism of DSV initiation, growth and detachment has been widely studied. Although the aerodynamic loads of cases with different motions and parameters are considerably different, the evolution of DSV still has many similarities in these different flow scenarios (Eldredge & Jones Reference Eldredge and Jones2019).
For an airfoil that experiences a dynamic stall through the variation of the angle of attack, some viscous unsteady flow phenomena appear in its flow field before DSV initiation. These unsteady phenomena are potentially related to the initiation of DSV formation. Mulleners & Raffel (Reference Mulleners and Raffel2012, Reference Mulleners and Raffel2013) divided the development of dynamic stall into a primary instability stage and a vortex formation stage. In the primary instability stage, there are only some regularly spaced individual small-scale vortices in the separated shear layer. In the vortex formation stage, the viscous interactions between the shear layer vortices begin to rapidly increase, which leads to the merging of small-scale structures. These interactions and merging eventually lead to the rolling up of the shear layer and the formation of the primary DSV. In previous studies, the criticality of the flow variables at the leading edge, such as flow velocity, reverse pressure gradient, stagnation point position and laminar separation position, has always been regarded as a contributing factor for the formation of DSV or dynamic stall onset (Evans & Mort Reference Evans and Mort1959; Leishman & Beddoes Reference Leishman and Beddoes1989; Ekaterinaris & Platzer Reference Ekaterinaris and Platzer1998; Jones & Platzer Reference Jones and Platzer1998). Benton & Visbal (Reference Benton and Visbal2019) and Sharma & Visbal (Reference Sharma and Visbal2019) analysed the dynamic stall development of airfoils using high-fidelity large-eddy simulation (LES). They showed that there is a laminar separation bubble (LSB) existing at the leading edge of the airfoil for some time before DSV initiation, and the bursting of the LSB is directly related to DSV initiation. Visbal (Reference Visbal2014) also found that just before LSB bursting and DSV initiation, maximum surface pressure fluctuations were observed near the leading edge, resulting in significant noise radiation. Gupta & Ansell (Reference Gupta and Ansell2018) performed a detailed time–frequency analysis of surface pressure to identify the dominant frequencies associated with the LSB and found that DSV initiation corresponds to the maximal spectral amplitude region. All of these results show that before DSV initiation, the flow field experiences an accumulation of unsteadiness and instability, and DSV initiation indicates an alternation of evolution schemas of the flow field. Therefore, DSV initiation is a significant critical event in the dynamic stall process.
Although the evolution of the flow field before and after DSV initiation has many different characteristics, there are still many qualitative similarities in different flow scenarios after DSV initiation. In the whole development of DSV, the separation point is almost fixed at the leading edge, and the vorticity feeding from the leading-edge shear layer makes the DSV increase in strength and spatial scale continuously. With increasing DSV, secondary vorticity is usually introduced upstream of the DSV and below the shear layer to form a counter-vorticity region (Akkala & Buchholz Reference Akkala and Buchholz2017). After the DSV experiences a period of growth, it is pinched off from the leading-edge shear layer and finally sheds into the wake. The shedding mechanism of DSV is still a complex problem. Widmann & Tropea (Reference Widmann and Tropea2015) summarized the shedding mechanism of DSV as the bluff body detachment mechanism and the boundary layer eruption mechanism. The former takes the chord length of the airfoil as the characteristic length of vortex shedding, while the latter is attributed to the viscous effect in the boundary layer. In some cases, the actual vortex shedding may be a mixture of these two mechanisms (Huang & Green Reference Huang and Green2015). Li et al. (Reference Li, Feng, Kissing, Tropea and Wang2020) found that with the change in the maximum effective angle of attack, different secondary vortex structures lead to the shedding of DSV. Li et al. (Reference Li, Feng, Kissing, Tropea and Wang2020) also proposed a simplified model for DSV growth, which proved that the DSV circulation growth increases linearly with the combination of the effective inflow velocity and the effective angle of attack.
These general laws of DSV development and the qualitative similarity of DSV in different flow scenarios make it possible to establish a universal parameter-independent theoretical framework, which can be used to accurately describe the general evolution of DSV or even the whole dynamic stall process. However, this work still faces many difficulties. Such a theoretical framework requires a standardized mathematical and physical description of the primary instability stage, the DSV formation stage, the DSV convection stage, the DSV shedding stage and the flow separation state after DSV detachment. Furthermore, this theoretical framework should have the ability to reasonably explain the dominant mechanism of different flow stages, the internal relationship between different flow stages and the influence law and mechanism of different parameters. It can establish a deep understanding of the physical essence of dynamic stall and can be used as a reference for flow control. To construct this theoretical framework, it is necessary to have an accurate understanding and distinguish each stage of DSV evolution, which requires quantitative identification of the initiation and termination of each stage, that is, the critical moments in the dynamic stall process. Therefore, it is very important to accurately predict these critical moments by constructing critical indicators.
During the dynamic stall process, Kelvin–Helmholtz (K–H) vortices, LSBs, DSVs and many other flow structures with distinct characteristics appear in different flow stages. The criticality of these characteristic flow structures is an important basis for distinguishing different flow stages. Usually, these characteristic flow structures have some presages before their appearance and then leave some ‘footprints’ in the flow field during their existence or disappearance. Research on these footprints can provide abundant information about the flow structures themselves. Such studies are similar to inferring animals’ walking and running gait from their footprints (Andersen et al. Reference Andersen, Bohr, Schnipper and Walther2017; Zhang Reference Zhang2017). Therefore, in the dynamic stall process, by searching the footprints of the characteristic flow structures, important information related to the evolution of these structures can be obtained. Furthermore, this information can be used to construct the critical indicators of the dynamic stall and then predict the critical moments. Generally, when a highly organized coherent structure such as the DSV exists in the flow field, the flow footprints left by it are often in various forms, including velocity information, pressure information and vorticity information. However, considering the application requirements of flow control, it is necessary to capture the footprint information in real time during the flow process and use it to construct the real-time critical indicators. Therefore, for this purpose, and based on the current measurement technology, the simplest and most feasible method is to obtain the pressure information on the wing surface left by the characteristic flow structures.
Some previous studies have established a basic understanding of the relationship between the characteristic flow structures and their pressure information. For example, in the presence of LSB, a pressure plateau is always observed near the leading edge (Gupta & Ansell Reference Gupta and Ansell2018; Benton & Visbal Reference Benton and Visbal2019; Samuthira Pandi & Mittal Reference Samuthira Pandi and Mittal2019; Eljack et al. Reference Eljack, Soria, Elawad and Ohtake2021). In addition, an apparent negative pressure region can usually be induced by the DSV. During DSV convection, as the vortex core position moves downstream, the negative peak pressure also moves aftward, which causes a pressure wave to propagate with time in the Cp(x, t) contours. This pressure wave is very common in different cases with different parameters, even with different forms of motion (Gerontakos & Lee Reference Gerontakos and Lee2006; Visbal Reference Visbal2014; Gupta & Ansell Reference Gupta and Ansell2018; Benton & Visbal Reference Benton and Visbal2019; Kirk & Jones Reference Kirk and Jones2019; Sharma & Visbal Reference Sharma and Visbal2019).
At present, based on the acquisition and utilization of surface pressure information, there have been some successful examples of constructing real-time critical indicators. Ramesh et al. (Reference Ramesh, Gopalarathnam, Edwards, Ol and Granlund2013, Reference Ramesh, Gopalarathnam, Granlund, Ol and Edwards2014) proposed the leading-edge suction parameter (LESP) as an indicator to predict DSV initiation. According to their opinion, for a given airfoil shape at a given Reynolds number, there is a fixed critical value of the LESP that always corresponds to DSV initiation. If the LESP exceeds this critical value, vorticity is released from the leading edge to form the DSV. This critical value of the LESP is considered largely independent of kinematics. In addition, because the calculation of the LESP only depends on the pressure near the leading edge, the real-time LESP can be obtained by arranging pressure transducers in the leading-edge region. In recent years, the LESP has been widely considered and applied due to its superior characteristics in predicting DSV initiation (Ramesh, Murua & Gopalarathnam Reference Ramesh, Murua and Gopalarathnam2015; Liu et al. Reference Liu, Lai, John and Tian2017; Hou, Darakananda & Eldredge Reference Hou, Darakananda and Eldredge2019; Ansell & Mulleners Reference Ansell and Mulleners2020; He et al. Reference He, Deparday, Siegel, Henning and Mulleners2020). Hirato et al. (Reference Hirato, Shen, Gopalarathnam and Edwards2019, Reference Hirato, Shen, Gopalarathnam and Edwards2021) verified the LESP on finite-span wings with different shapes and found that in this situation, the formation of the LEV was also governed by the criticality of leading-edge suction. Narsipur et al. (Reference Narsipur, Hosangadi, Gopalarathnam and Edwards2020) modified the formula of the LESP by using a novel reference velocity, further reducing the dependence of the critical value of the LESP on motion kinematics.
Although the LESP has been successfully applied to many scenarios, some problems are still to be solved. First, the LESP only uses the surface pressure near the leading edge, while the pressure information on the rear section of the wing is ignored. Therefore, although the LESP can predict DSV initiation by the criticality of leading-edge flow, it is difficult to predict the flow events and flow state after DSV initiation. For example, Deparday & Mulleners (Reference Deparday and Mulleners2019) found that after DSV initiation, the LESP obtained from experiment deviated greatly from the inviscid LESP calculated from potential flow theory. This deviation is considered to be attributed to the flow separation on the airfoil in the viscous flow, and the height of the separated shear layer changes the effective angle of attack and effective camber of the airfoil. Deparday & Mulleners (Reference Deparday and Mulleners2019) established a theoretical model to describe the LESP by introducing the average height of the separated shear layer, showing that the variation of the modified theoretical LESP is consistent with experimental results. Deparday & Mulleners's (Reference Deparday and Mulleners2019) results illustrated an important fact: using the flow information on the whole airfoil surface, rather than just limited to the leading-edge region, is more conducive to predicting the flow state after DSV initiation. Second, an important application scenario of the dynamic stall problem is micro air vehicles and flapping-wing aircraft. These aircraft have very small or very thin wings, and therefore the space constraint makes it difficult to install pressure transducers densely at the leading-edge region of the wings, making the calculation of the LESP difficult. Third, the airfoil leading-edge shape is necessary and influential for calculating the LESP, which leads to the LESP not being applicable to a flexible wing with a deformable leading edge. Fourth, although the modified method of Narsipur et al. (Reference Narsipur, Hosangadi, Gopalarathnam and Edwards2020) can reduce the dependence of the LESP on kinematic parameters, this method requires prior knowledge of incoming flow and motion parameters. Therefore, it is not applicable for unclear flow or motion conditions, such as encounters with gusts or sudden manoeuvres.
Based on the above considerations, this study aims to construct several critical indicators for predicting DSV-related flow events using the pressure on the whole suction surface of an airfoil. Moreover, for application in flow control, the indicators constructed in this study will be of real-time nature; that is, only the current data and historical data of surface pressure will be used to construct the indicators so that the indicators can be calculated in real time during the flow process. These critical indicators include the spatial distribution coefficient of pressure (SDCP), the high-order central moment of pressure (HCMP), the location of peak pressure (LPP) and the modulated location of peak pressure (MLPP). Among them, the SDCP can predict the formation of LSB and initiation of DSV, the HCMP can predict the initiation of DSV, the LPP can effectively track the vortex centre during DSV convection and predict DSV detachment and the MLPP can predict DSV detachment more clearly. These critical indicators realize the whole-life monitoring of the primary instability stage, the DSV formation stage, the DSV convection stage and the DSV shedding stage. The critical indicators constructed in this study can accurately predict the significant critical flow events in the dynamic stall process, providing a reference for quantitatively identifying the initiation and termination moments for DSV evolution.
This article is arranged as follows. The basic situation of the numerical and experimental cases and the research methodology used in this study are introduced in § 2. Section 3 briefly describes the basic flow situation in a typical case and the corresponding identification criterion of the critical moments. The mathematical definitions of the critical indicators are presented in § 4, and verifications of their validity and explanations of the underlying physical mechanism are also presented. In § 5, wind tunnel experimental data are used to verify the robustness of the critical indicators, followed by a discussion of the influence of the number of pressure transducers in § 6. Next, the critical values of the SDCP and LESP are compared in a very wide parameter envelope, and a modification method of SDCP based on the Z-score standardized pressure is proposed in § 7. Finally, conclusions drawn from this study are presented in § 8. The applicability of the present critical indicators in more flow scenarios is verified in Appendices A and B.
2. Methodology
2.1. Physical cases
To verify the performance of critical indicators in different flow scenarios and study the influence of parameters, a large number of pitching cases are obtained here. The cases in this study are mainly divided into three groups, namely the cases obtained by the present numerical simulation (Cases 1, 2 and 3), the numerical cases of Narsipur et al. (Reference Narsipur, Hosangadi, Gopalarathnam and Edwards2020) (Cases A, B, C, D and other cases, a total of 115 cases) and a wind tunnel experimental case of Mulleners & Raffel (Reference Mulleners and Raffel2012, Reference Mulleners and Raffel2013) (Case E). The typical motion forms and airfoils of these cases are shown in figure 1, with their motion parameters listed in table 1. Here and below,  $\alpha $ is the angle of attack, c is the chord length of the airfoil, xp/c is the dimensionless pivot location and Re represents the chord-length-based Reynolds number. Parameter
 ${\omega ^ + }$ is the dimensionless angular velocity
 $({\omega ^ + } = \omega c/{U_\infty })$,
 $\omega $ is the dimensional angular velocity of pitch motion and
 ${U_\infty }$ represents the free-stream velocity. Also, K is the dimensionless pitching rate
 $(K = \dot{\alpha }c/2{U_\infty })$ and
 $\dot{\alpha }$ is the dimensional pitching rate. Parameters K and
 ${\omega ^ + }$ have the same physical meaning, but their values are twice as different. As both expressions are used in different references, both expressions are retained here to be consistent with the references. Parameter k is the reduced frequency,
 $k = {{\rm \pi} }fc/{U_\infty }$, and f is the frequency of sinusoidal pitching motion.
Variations in the angle of attack with convective time and airfoils of different cases. (a) Case 1, Case 2 and Case 3. (b) Representative cases selected from database N (Narsipur et al. Reference Narsipur, Hosangadi, Gopalarathnam and Edwards2020). (c) Case E (Mulleners & Raffel Reference Mulleners and Raffel2012, Reference Mulleners and Raffel2013).

Parameter list of the cases used in this study.

Case 1 has the same motion and parameters as the wind tunnel experimental case of Gupta & Ansell (Reference Gupta and Ansell2018). In this case, a NACA 0012 airfoil experiences a ramp-up motion (figure 1a) from  $\alpha = - 6^\circ $ to
 $\alpha = 30^\circ $ with a constant dimensionless angular velocity of
 ${\omega ^ + } = 0.05$ and a Reynolds number of
 $Re = 5 \times {10^5}$. Visbal (Reference Visbal2014), Visbal & Benton (Reference Visbal and Benton2018) and Benton & Visbal (Reference Benton and Visbal2019) also carried out three-dimensional LES studies on cases that have very similar parameters to those of Case 1. Therefore, the basic flow situation of this case is well understood. The motions and parameters of Case 2 and Case 3 are similar to those of Case 1, except that their
 ${\omega ^ + }$ values are equal to 0.1 and 0.2, respectively.
The database of Narsipur et al. (Reference Narsipur, Hosangadi, Gopalarathnam and Edwards2020) contains a total of 115 numerical cases, all of which adopt pitch-up-return motion (figure 1b). The parameter range includes two Reynolds numbers ( $Re = 3 \times {10^4}$ and
 $Re = 3 \times {10^6}$), two airfoils (NACA 0012 and SD7003m), eight different pitching rates (varying from K = 0.005 to K = 0.6) and five different pivot locations (xp/c = 0.00, 0.25, 0.50, 0.75 and 1.00, denoted as LE, QC, MC, TQ and TE, respectively). The database of Narsipur et al. (Reference Narsipur, Hosangadi, Gopalarathnam and Edwards2020) provides a very wide parameter envelope, which can be used to widely verify the influence of different parameters on critical indicators. For more details of this database, the reader is referred to the published work of Narsipur et al. (Reference Narsipur, Hosangadi, Gopalarathnam and Edwards2020). In the following, this database is called database N. Cases A, B, C and D are four representative cases selected from database N. Their principles of parameter selection are to be away from those of Cases 1, 2 and 3 and reflect the influence of different parameters as much as possible.
Case E is a classic wind tunnel experimental case, whose flow situation and the variation of the LESP have been reported widely (Mulleners & Raffel Reference Mulleners and Raffel2012, Reference Mulleners and Raffel2013; Deparday & Mulleners Reference Deparday and Mulleners2019; Ansell & Mulleners Reference Ansell and Mulleners2020). In Case E, the OA209 airfoil is selected for sinusoidal pitching motion (figure 1c), with average angle of attack  ${\alpha _0} = 20^\circ $, pitching amplitude
 ${\alpha _m} = 8^\circ $, reduced frequency k = 0.05, Reynolds number Re = 9.2 × 10⁵ and pivot location xp/c = 0.25. Time-resolved particle image velocimetry measurements and surface pressure measurements based on pressure transducers of Case E have been carried out and can be found in Mulleners & Raffel (Reference Mulleners and Raffel2012, Reference Mulleners and Raffel2013). The distribution of pressure transducers is shown on the right-hand side in figure 1(c). A total of 40 pressure transducers were arranged on the airfoil, including 27 (blue dots) on the suction surface and 13 (open circles) on the pressure surface. The sampling frequency of the pressure signals was 6 kHz, the continuous sampling time was 15 s and the data of 39 cycles were measured. In this study, the 27 transducers on the suction surface are used to construct critical indicators. For the convenience of description, the transducers on the suction surface from the leading-edge point to the trailing-edge point are serially numbered from 1 to 27. These serial numbers are used to refer to the corresponding transducers later.
2.2. Numerical method
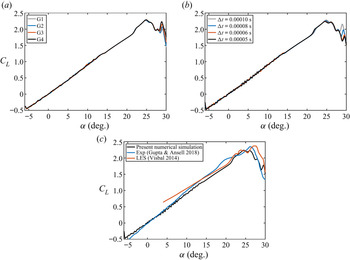
In this study, the incompressible unsteady Reynolds-averaged Navier–Stokes (URANS) equation is solved to perform computational fluid dynamics calculations in Cases 1, 2 and 3, and the SST transition model is used. The selected computational domain is a typical O-type grid, with its outer boundary 20c away from the airfoil, and structured grids are used for the whole domain. The distance of the first nodes adjacent to the airfoil surface is small enough so that the condition of y+ < 1 is strictly guaranteed. During calculation, the mesh and airfoil rigidly move together. Figure 2(a) shows the results of grid sensitivity verification of Case 1, where the lift coefficients obtained from four different grids are used for comparison. G1, G2, G3 and G4 grids have  $5.78 \times {10^5}$,
 $\; 6.57 \times {10^5}$,
 $7.37 \times {10^5}$ and
 $8.16 \times {10^5}$ cells corresponding to 1400, 1600, 1800 and 2000 nodes around the airfoil, respectively. The difference in the lift curves of the four domains mainly exists in the poststall stage. Flow field analysis also shows no significant difference between the calculation results of different grids before DSV detachment. Finally, the G3 grid is selected for subsequent calculations. The time step sensitivity verification is shown in figure 2(b), and all the results in the figure are based on the G3 grid. The influence of the time step on the results is also mainly reflected in the poststall stage. Therefore, the time step size
 $\Delta t = 0.00005\;\textrm{s}$ is selected for subsequent calculations, corresponding to the non-dimensional time step
 $\Delta t{U_\infty }/c = 0.00186$. In Cases 1, 2 and 3, at the beginning of the calculation, the airfoil is kept stationary for 0.1 s, and then it starts to pitch up at a constant rate until reaching the maximum angle of attack. In the present simulations, 0.1 s corresponds to 3.72 non-dimensional time units, which is sufficient to develop the flow around the airfoil.
(a) Grid sensitivity verification, (b) timestep sensitivity verification and (c) comparison of the lift coefficient of the present numerical simulation with the experimental results of Gupta & Ansell (Reference Gupta and Ansell2018) and the LES results of Visbal (Reference Visbal2014).

Figure 2(c) shows a comparison of the lift coefficient in Case 1 between the present numerical simulation results, the experimental results of Gupta & Ansell (Reference Gupta and Ansell2018) and the LES results of Visbal (Reference Visbal2014). The lift variation of the present simulation is consistent with the experimental results, and there is only a small difference. As Case 1 contains many complex flow phenomena, such as transition and reattachment, and DSV usually consists of small-scale coherent structures, the small difference between the results obtained using URANS and the experimental results is reasonable, which widely occurs in similar calculations (Wang et al. Reference Wang, Ingham, Ma, Pourkashanian and Tao2010; Amini, Kianmehr & Emdad Reference Amini, Kianmehr and Emdad2019; Narsipur et al. Reference Narsipur, Hosangadi, Gopalarathnam and Edwards2020; Rezaei & Taha Reference Rezaei and Taha2021). Figure 2(c) shows that even the results obtained using the LES also have differences from the experimental results.
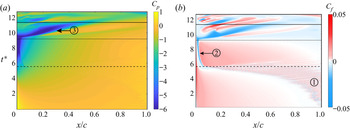
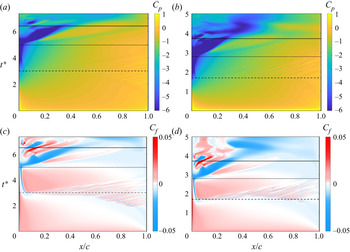
The spatiotemporal contours of pressure and skin friction on the suction surface in Case 1 are also shown in figure 3. Gupta & Ansell (Reference Gupta and Ansell2018), Visbal (Reference Visbal2014), Visbal & Benton (Reference Visbal and Benton2018) and Benton & Visbal (Reference Benton and Visbal2019) also display similar figures of the same case. By comparison, it can be found that the evolutions of K–H vortices, LSB, DSV, shear layer vortex and many other flow structures shown in figure 3 are very close to those described by Gupta & Ansell (Reference Gupta and Ansell2018), Visbal (Reference Visbal2014), Visbal & Benton (Reference Visbal and Benton2018) and Benton & Visbal (Reference Benton and Visbal2019). This is another proof of the validity of the present numerical results. On the other hand, this study focuses on the relationship between flow structures such as DSV and airfoil surface pressure, which is the basis of the construction of critical indicators. Because the numerical calculation and the real wind tunnel flow follow the same governing equation, the relationship between the DSV and the surface pressure obtained from the numerical simulation is still valid in the experimental data. Therefore, the small difference between the present numerical results and the experimental results does not affect the nature of this relationship and, therefore, does not affect the conclusions of this study.
Spatiotemporal contours of (a) pressure coefficient Cp and (b) skin friction coefficient Cf on the suction surface in Case 1. The dashed line, dotted line and solid line from bottom to top correspond to the moments of LSB formation, DSV initiation and DSV detachment, respectively. Region  ${\bigcirc{\kern-6pt 1}}$ represents the trace of the K–H vortices, mark
 ${\bigcirc{\kern-6pt 2}}$ represents the trace of the LSB and mark
 ${\bigcirc{\kern-6pt 3}}$ represents the DSV-induced pressure wave.

3. Basic flow situation and criterion of critical moments
3.1. Basic flow situation
Since the critical moment is closely related to the flow events in the flow field, this section takes Case 1 as an example to briefly introduce its basic flow situation. Figure 3 shows the spatiotemporal contours of the pressure coefficient Cp and skin friction coefficient Cf on the suction surface in Case 1, where  ${t^\ast } = t{U_\infty }/c$ represents the dimensionless convection time and
 ${t^\ast } = 0$ corresponds to the moment when the airfoil starts to move from
 $\alpha = - 6^\circ $. In this study, x without a subscript represents the chordwise coordinates in the airfoil body coordinate system, y represents the coordinates normal to the chord and the origin of the body coordinate system is fixed at the leading-edge point of the airfoil. The dashed line, dotted line and solid line in figure 3 correspond to the moments of
 ${t^\ast } = 5.58$,
 ${t^\ast } = 9.18$ and
 ${t^\ast } = 11.34$, which represent the formation of LSB, the initiation of DSV and the detachment of DSV, respectively. The quantitative identification methods of these moments are introduced later.
At the beginning of the motion, the flow on the suction surface is attached. With the increase in the angle of attack, separation and reverse flow appear near the trailing edge. As shown in figure 4, at  ${t^\ast } = 3.53$, under the effect of K–H instability, the separated shear layer rolls up into K–H vortices, which convect downstream continuously. With flow development, the trailing-edge separation point keeps moving upstream, causing the convective trace of the K–H vortices to occupy most of the suction surface, which can be seen in the skin friction contour in figure 3(b) (region
 ${\bigcirc{\kern-6pt 1}}$). At
 ${t^\ast } = 5.58$, the trailing-edge separation point reaches the vicinity of the leading edge for the first time. Simultaneously, an LSB appears at the leading edge and then it remains for some time. The pressure footprint and skin friction trace of the LSB can be seen in figure 3 (mark
 ${\bigcirc{\kern-6pt 2}}$), and its detailed structure at
 ${t^\ast } = 7.25$ is also shown in figure 4. After LSB formation, the flow downstream of it reattaches, and a new flow separation point appears downstream of the reattached flow region. During the maintenance of the LSB, this new separation point moves from the trailing edge towards the leading edge continuously. Meanwhile, the LSB shrinks in size and slightly moves upstream. After
 ${t^\ast } = 9.18$, the LSB bursts, and DSV initiates at the leading edge. Then, with the additional feeding vorticity from the shear layer, the circulation and size of the DSV increase significantly, and the position of its centre moves downstream. The convection of the DSV induces a strong pressure wave on the suction surface, as shown in figure 3(a) (mark
 ${\bigcirc{\kern-6pt 3}}$). This pressure wave is the most distinctive pressure footprint of the DSV. In addition, there is a large-scale shear layer vortex downstream of the DSV, which grows and convects with the growth of the DSV. Figure 4 shows detailed structures of the DSV and the shear layer vortex at
 ${t^\ast } = 9.48$ and
 ${t^\ast } = 10.23$. During the development of the DSV, upstream of the DSV and beneath the leading-edge shear layer, the secondary vorticity accumulates continuously and eventually erupts and pinches off the DSV from its shear layer, resulting in the detachment of the DSV
 $({t^\ast } = 11.34)$.
Vorticity contours of the flow field at some representative moments, with streamlines being plotted. The right-hand panels are enlargements of the black boxes in the left-hand panels.

3.2. The criterion of LSB formation time
The purpose of this study is to establish some critical indicators using the pressure information on the airfoil surface and hope that these indicators can be calculated in real time so that they can be used as the feedback or reference frame of flow control. Therefore, based on the identification of the flow field, some non-real-time methods need to be developed, which are used to accurately determine the occurrence moment of critical flow events. These moments are the verification criteria for the accuracy of critical indicators. This section introduces the identification method of LSB initiation. Sections 3.3 and 3.4 introduce the identification method of DSV initiation and DSV detachment, respectively.
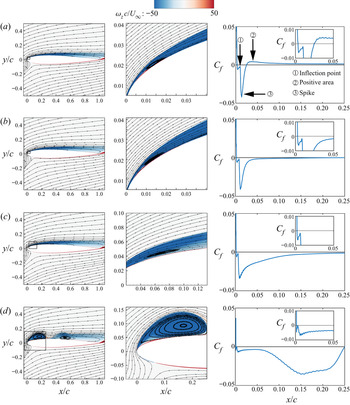
Figure 5 shows the vorticity contours and streamlines near the leading edge at  ${t^\mathrm{\ast }} = 5.39$,
 ${t^\mathrm{\ast }} = 5.58$ and
 ${t^\mathrm{\ast }} = 5.76$, as well as the skin friction distribution near the leading edge in Case 1. At
 ${t^\mathrm{\ast }} = 5.39$, there is no LSB in the flow field. In the range of approximately 0.04 < x/c < 0.12, there is a negative region of Cf, which indicates that the trailing-edge separation point approaches near the leading edge for the first time. In areas further downstream, Cf alternates between positive and negative values due to the existence and convection of K–H vortices. At
 ${t^\mathrm{\ast }} = 5.58$, an LSB can be recognized in the flow field first, which corresponds to the appearance of an inflection point in the negative-Cf region for the first time (figure 5b). This inflection point is actually due to the accumulation of positive vorticity (red region) upstream of the LSB. In the description of Narsipur et al. (Reference Narsipur, Hosangadi, Gopalarathnam and Edwards2020), it is found that the event whereby the inflection point appears in the negative-Cf region for the first time corresponds to the initiation of DSV. This is because an LSB is not observed in the cases of Narsipur et al. (Reference Narsipur, Hosangadi, Gopalarathnam and Edwards2020), and many characteristics of DSV at the initial time are similar to those of LSBs observed in this study. However, the difference between them is that the DSV continues to grow and convect downstream; in contrast, the LSB does not grow but shrinks in size and slightly moves upstream, as shown in figure 5(c). Therefore,
 ${t^\mathrm{\ast }} = 5.58$ is regarded as the formation time of the LSB in Case 1. In the following, the formation time of the LSB in all cases is denoted as
 $t_1^\ast $.
Vorticity contours with streamlines (left and middle columns) and skin friction coefficient (right column) in the range x = 0–0.25c at several moments before and after LSB initiation in Case 1: (a)  ${t^\ast } = 5.39$, (b)
 ${t^\ast } = 5.58$ and (c)
 ${t^\ast } = 5.76$. The centre panels are enlargements of the black boxes in the left-hand panels.

3.3. The criterion of DSV initiation time
In previous literature, it is a common method to use some critical events of the skin friction on the suction surface as the basis to identify the initiation time of DSV. However, in different cases, the specific method is different. Ramesh et al. (Reference Ramesh, Granlund, Ol, Gopalarathnam and Edwards2018) and Hirato et al. (Reference Hirato, Shen, Gopalarathnam and Edwards2021) used the event that ‘the value of the inflection point in the negative-Cf region changes to positive for the first time’ as the criterion of DSV initiation. In Case 1, when this skin friction event happens, DSV has developed for a period and already has a large size (figure 6d). Therefore, the method of Ramesh et al. (Reference Ramesh, Granlund, Ol, Gopalarathnam and Edwards2018) and Hirato et al. (Reference Hirato, Shen, Gopalarathnam and Edwards2021) is too late to be used as the best criterion of DSV initiation in Case 1. Narsipur et al. (Reference Narsipur, Hosangadi, Gopalarathnam and Edwards2020) used the event of ‘the inflection point appears in the negative-Cf region for the first time’ as the criterion of DSV initiation. However, as has been demonstrated in § 3.1, this method corresponds to the formation of an LSB, which is too early to be a criterion of DSV initiation in Case 1. Therefore, for the flow situation of Cases 1, 2 and 3, a more accurate criterion for DSV initiation is needed.
Vorticity contours with streamlines (left and middle columns) and skin friction coefficient (right column) near the leading-edge region at several moments before and after DSV initiation in Case 1: (a)  ${t^\ast } = 8.92$, (b)
 ${t^\ast } = 9.18$, (c)
 ${t^\ast } = 9.39$ and (d)
 ${t^\ast } = 9.85$. The centre panels are enlargements of the black boxes in the left-hand panels.

During the existence of the LSB, it causes a ‘spike’ in the negative-Cf region, as shown in figure 6(a). Since the flow separates upstream of the LSB and reattaches downstream, the downstream region of the LSB corresponds to a positive region of Cf. With flow development, the reverse flow region expands upstream and interferes with the LSB at  ${t^\mathrm{\ast }} = 9.18$, resulting in the bursting of the LSB. This phenomenon corresponds to the change in Cf from positive to negative in the region immediately downstream of the LSB (figure 6b). Following LSB bursting, the complete structure of DSV can be identified directly in the flow field at
 ${t^\mathrm{\ast }} = 9.39$. However, no obvious critical skin friction event is observed at
 $t^{\ast} = 9.39$. Therefore, it is difficult to identify this moment quantitatively through Cf. In addition, considering that the works of Benton & Visbal (Reference Benton and Visbal2019) and Sharma & Visbal (Reference Sharma and Visbal2019) have shown the close physical relationship between ‘LSB collapse’ and ‘DSV initiation’, as well as the high similarity of the occurrence time of these two events, the bursting of the LSB is also regarded as the landmark of DSV initiation in this study. In figure 6(b), the LSB bursting corresponds to the event that the positive Cf region immediately downstream of the LSB becomes negative for the first time. Therefore, this skin friction event can be regarded as a symbol of DSV initiation. In the following, the initiation moment of DSV is denoted as
 $t_2^\ast $.
3.4. The criterion of DSV detachment time
In addition to the formation of the LSB and DSV, another important critical event is the detachment of the DSV. In Case 1, the shedding mechanism of the DSV is closer to the boundary layer eruption mechanism mentioned by Widmann & Tropea (Reference Widmann and Tropea2015). DSV shedding can be described as a process in which the leading-edge shear layer stops feeding circulation to the DSV (Ringuette, Milano & Gharib Reference Ringuette, Milano and Gharib2007; Huang & Green Reference Huang and Green2015). Therefore, the time when the DSV is pinched off from the leading-edge shear layer is defined as the DSV detachment time here.
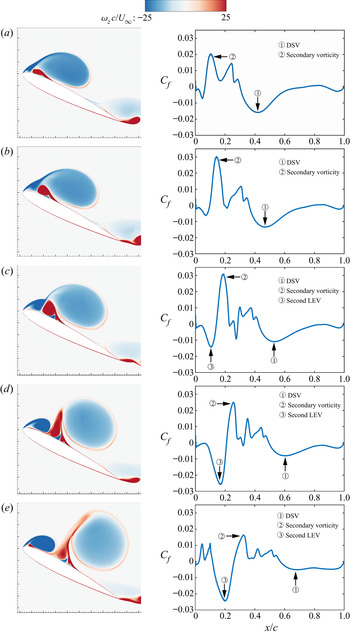
Figure 7 shows the vorticity contours and skin friction distribution on the suction surface at different moments before and after DSV detachment. At  ${t^\mathrm{\ast }} = 10.97$ (figure 7a), the DSV is still in growth and has not been pinched off from the leading-edge shear layer. At this time, the trace of DSV is visible in the distribution of Cf. At
 ${t^\mathrm{\ast }} = 11.15$ (figure 7b), it can be found from the vorticity contour that the leading-edge shear layer is still feeding vorticity to the DSV. At
 ${t^\mathrm{\ast }} = 11.34$ (figure 7c), the DSV is in the process of being pinched off, most of the vorticity from the leading-edge shear layer is feeding into the newly formed LEV and the secondary vorticity is erupting rapidly. At
 ${t^\mathrm{\ast }} = 11.53$ (figure 7d), the DSV has been pinched off from the leading-edge shear layer and begins to convect downstream. At
 ${t^\mathrm{\ast }} = 11.71$ (figure 7e), the DSV moves away from the airfoil surface after its detachment, its strength gradually dissipates and the trace of DSV in the Cf distribution is no longer apparent. Based on these observations,
 ${t^\mathrm{\ast }} = 11.34$ can be regarded as the reference time of DSV detachment in Case 1. In the following text, the reference time of DSV detachment is denoted as
 $t_3^\ast $. Furthermore, a more certain fact is that the critical event of DSV detachment should be in the range
 $11.15 < {t^\mathrm{\ast }} < 11.53$. Therefore, the time range
 $11.15 < {t^\mathrm{\ast }} < 11.53$ can be taken as an error interval of DSV detachment.
Vorticity contours (left column) and skin friction coefficient (right column) on the suction surface at several moments around DSV detachment in Case 1: (a)  ${t^\mathrm{\ast }} = 10.97$, (b)
 ${t^\mathrm{\ast }} = 11.15$, (c)
 ${t^\mathrm{\ast }} = 11.34$, (d)
 ${t^\mathrm{\ast }} = 11.53$ and (e)
 ${t^\mathrm{\ast }} = 11.71$.

Figure 8(a) shows the variation in the normal distance yv between the DSV centre and the airfoil chord line with  ${t^\mathrm{\ast }}$, and figure 8(b) shows the variation in the absolute value of DSV circulation. The black vertical line in the figure is the reference time of DSV detachment
 $t_3^\ast $. In these calculations, the vortex is distinguished from the velocity field by the
 ${\lambda _{ci}}$ criterion (Zhou et al. Reference Zhou, Adrian, Balachandar and Kendall1999), where the connected domain with
 ${\lambda _{ci}}\; \ge 1\;{\textrm{s}^{ - 1}}$ is regarded as the interior of the vortex. The determination of this threshold is based on the work of Li et al. (Reference Li, Feng, Kissing, Tropea and Wang2020). The position of the vortex centre is determined by the
 ${\varGamma _1}$ criterion proposed by Graftieaux, Michard & Nathalie (Reference Graftieaux, Michard and Nathalie2001). Within the vortex boundary, the local maximum of the scalar function
 ${\varGamma _1}$ is regarded as the vortex centre, and the circulation of DSV is obtained by the integral of the vorticity. As can be seen from figure 8(a), yv increases linearly with time before and after
 $t_3^\ast = 11.34$, indicating that the DSV starts to move away from the wall rapidly after
 $t_3^\ast $. As can also be seen from figure 8(b), before
 $t_3^\ast $, the circulation of the DSV has been increasing continuously, but it keeps constant for a while after
 $t_3^\ast $ and begins to decrease after
 ${t^\mathrm{\ast }} = 11.71$ because of the dissipation of vorticity. All these results support the above identification of
 $t_3^\ast = 11.34$ as the reference time of DSV detachment.
Variation in (a) the normal distance from the DSV centre to the airfoil chord line and (b) DSV circulation with  ${t^\mathrm{\ast }}$ in Case 1. The solid black line represents the reference time of DSV detachment.

In §§ 3.2–3.4, the identification methods of LSB formation, DSV initiation and DSV detachment are discussed. In the following, these three critical moments are denoted as  $t_1^\ast $,
 $t_2^\ast $ and
 $t_3^\ast $, respectively, which are also used in other cases.
4. Construction of critical indicators
In this section, some critical indicators are constructed to predict the critical events in the process of dynamic stall. Based on the relationship between flow structures and their pressure footprints, the construction of these critical indicators utilizes the pressure on the suction surface of the airfoil. Moreover, a principle is followed that only the ‘historical value’ and ‘present value’ of pressure can be used instead of the ‘future value’. The destination of this principle is to achieve the goal of real-time calculation so that the critical indicators constructed here can be applied for feedback flow control. In this section, as a theoretical method, the data from 500 measuring points distributed uniformly along the x direction from the leading-edge point to the trailing-edge point on the whole suction surface are used to construct the critical indicators. Since the measuring points are dense enough, the pressure obtained from those points can be regarded as spatially continuous. The situation of using fewer measuring points (i.e. pressure transducers) is discussed in §§ 5 and 6.
4.1. Evolution of surface pressure
In the process of dynamic stall, the variation in the pressure distribution on the suction surface can fully reflect the status of the near-wall flow field. Therefore, abundant information about the flow criticality can be obtained by measuring and analysing the pressure distribution variation on the suction surface. Figure 9 shows the spatial and statistical distribution of the pressure coefficient on the suction surface at several representative moments in Case 1. The statistical distribution is the probability density distribution of Cp data from all measuring points at a certain time, whose detailed definition is as follows: at time  ${t^\ast }$, the Cp from all measuring points constitutes a group of sample data (
 ${C_{p,1}}({t^\ast })$,
 ${C_{p,2}}({t^\ast }), \ldots {C_{p,N}}({t^\ast })$, where N is the number of measuring points). Calculating the distribution probability of this group of sample data in different value intervals is the named statistical distribution of Cp at this time. At
 ${t^\mathrm{\ast }} = 3.53$, as most of the flow on the suction surface is attached, the spatial distribution of pressure is relatively flat, except for the small fluctuations near the trailing edge caused by K–H vortices. At this time, the statistical distribution of pressure is concentrated in a small range and approximately uniform. At
 $t_1^\ast = 5.58$, a negative peak pressure appears at the leading edge. The LSB has just formed, and a pressure plateau caused by the LSB is present. Simultaneously, the dispersion, kurtosis and skewness of the statistical pressure distribution begin to increase. With the increase in the angle of attack, the leading-edge negative peak pressure increases continuously, and the statistical pressure distribution keeps its previous variation trend until DSV initiation. At
 $t_2^\ast = 9.18$ when the DSV initiates, the leading-edge negative peak pressure is highly concentrated, and the statistical distribution of pressure has the maximum dispersion, kurtosis and skewness. After DSV initiation, the negative peak pressure collapses rapidly. With the growth and convection of DSV, the location of the negative peak pressure also moves downstream. At
 $t_3^\ast = 11.34$, the reference time of DSV detachment, the negative peak pressure is no longer apparent, and the spatial pressure distribution becomes flat again. Accordingly, the dispersion, kurtosis and skewness of the statistical distribution of pressure also decrease.
Spatial distribution (left column) and statistical distribution (right column) of the pressure coefficient on the suction surface at (a)  ${t^\mathrm{\ast }} = 3.53$, (b)
 ${t^\mathrm{\ast }} = 5.58$, (c)
 ${t^\mathrm{\ast }} = 9.18$ and (d)
 ${t^\mathrm{\ast }} = 11.34$ in Case 1.

Although the above analysis of surface pressure evolution characteristics is based on Case 1, the evolution of DSV in different cases is generally similar. Therefore, in other cases, the basic variation in pressure is still qualitatively consistent to a great extent. To better understand the relationship between flow criticality and surface pressure, it is necessary to use mathematical methods to establish the quantitative relationship between them. Proper orthogonal decomposition (POD) is a technique for low-order analysis that extracts modes by optimizing the mean square of measured field variables. Modern POD applications are dedicated to exploring space–time separation and can be used as a method to extract coherent structures from turbulent flows (Taira et al. Reference Taira, Brunton, Dawson, Rowley, Colonius and Mckeon2017). Note that the definition of the pressure coefficient  ${C_p}$ is the fluctuation of the pressure at a certain point relative to that of the free stream. Thus, the pressure coefficient data on the suction surface are directly used for POD analysis to extract the characteristic modes corresponding to various critical events.
Figure 10 shows the first 16 spatial POD modes of Cp on the suction surface and their corresponding normalized time coefficients in Case 1. The dotted line, the dashed line and the solid line in the figure represent the  $t_1^\ast $,
 $t_2^\ast $ and
 $t_3^\ast $ moments, respectively, and the same lines are also plotted in the following figures. Figure 10(a) shows that the first spatial mode represents a gentle pressure distribution on the suction surface, and the variation of its time coefficient is very close to that of the lift coefficient in this case (the lift coefficient can be seen in figure 13). The pressure distribution of the second spatial mode is mainly reflected in the negative peak pressure with a high concentration at the leading edge. Moreover, the maximum value of the time coefficient of this mode corresponds to time
 $t_2^\ast $, coinciding with the phenomenon that the leading-edge negative peak pressure reaches the maximum at time
 $t_2^\ast $. Both the third and fourth spatial modes show a negative peak pressure, which is flatter than the leading-edge peak in the second spatial mode. However, the location of the peaks in the third and fourth spatial modes is not at the leading edge. Combined with the cognition of flow, it can be inferred that these two modes are related to DSV. In addition, the time coefficients of the third and fourth modes begin to rapidly increase shortly after
 $t_2^\ast $, reach the maximum value in the middle of the
 $t_2^\ast \text{--} t_3^\ast $ interval and fall rapidly shortly before
 $t_3^\ast $. From figure 3(a), it can be seen that the surface pressure induced by the DSV also gradually increases after
 $t_2^\ast $. However, it does not continuously increase during the existence of DSV but reaches the strongest at one intermediate time of the
 $t_2^\ast \text{--} t_3^\ast $ interval and rapidly decreases near
 $t_3^\ast $. This phenomenon further confirms the direct correlation between the third and fourth modes and the DSV.
The first 16 POD spatial modes (left column) and their corresponding normalized time coefficients (right column) of the pressure coefficient on the suction surface in Case 1.

In figure 10(b), the fifth to eighth modes have smaller eigenvalues than the first four modes. Therefore, these modes represent the pressure fluctuations caused by the lower-energy flow structures, which are not concentrated on the leading edge but oscillate over the whole airfoil. In addition, the time coefficients of the fifth to eighth modes are relatively stable and close to zero before  $t_2^\ast $, and all of them have a local extremum around
 $t_2^\ast $ and then begin to oscillate violently. The existence of the local extrema of the fifth to eighth modes around
 $t_2^\ast $ implies an important fact that the pressure outside the leading edge may also contain some information about DSV initiation. That is, although the flow criticality at the leading edge has always been considered a causal factor for the initiation of DSV or dynamic stall onset in the past, the flow criticality outside the leading edge, as has been shown here, may also have a contribution to the initiation of DSV. The causality between the flow criticality outside the leading edge and DSV initiation is a discovery in this study, which is also a theoretical basis for using the pressure on the whole suction surface to construct the critical indicators.
Figures 10(c) and 10(d) show the 9th–16th spatial modes and their time coefficients. These modes have lower energy levels, so they can be considered to represent the influence of various small-scale flow structures in the flow field. Among them, the time coefficients of the 9th, 10th and 11th modes still have a local extremum around  $t_2^\ast $, but the time coefficients of the higher modes have no apparent characteristics around
 $t_2^\ast $. In addition, an important phenomenon is that all the time coefficients of the 9th–16th modes have a local extremum or mutation around
 $t_1^\ast $. This result shows that the flow criticality at
 $t_1^\ast $ is also reflected in the surface pressure and is mainly related to some small-scale flow structures. Moreover, although
 $t_1^\ast $ corresponds to LSB formation, it can be seen that the pressure fluctuations reflected by these high-order modes are not concentrated in the leading-edge region where the LSB is located but distributed over the whole suction surface. This kind of flow criticality reflected in the high-order modes around
 $t_1^\ast $ is also the theoretical basis for establishing the critical indicators that can predict the formation of the LSB.
To further confirm the relationship between the mathematical structures of POD modes and the physical structures in the flow field, the spatiotemporal contours of the reconstructed Cp based on different modes are shown in figure 11. By comparing the panels in figure 11 with figure 3(a), it can be found that different modes are associated with different flow structures. Figure 11(a) shows the pressure contours reconstructed by the first and second modes. As mentioned above, the first mode represents the overall variation in pressure, while the second mode represents the concentration of leading-edge negative pressure. Therefore, figure 11(a) shows the overall variation in pressure during dynamic stall and the uplift and collapse of the leading-edge negative pressure. Figure 11(b) shows the pressure reconstruction of the third and fourth modes, and therefore this contour mainly reflects the pressure wave induced by the DSV and the high-pressure region caused by the flow entrainment of the DSV. Figure 11(c) shows the reconstructed pressure contours based on the fifth and all of the higher-order modes. Although the concentration of leading-edge negative pressure and the traces of DSV-induced pressure waves are not apparent, the traces of LSB and K–H vortices are visible, confirming the above judgment that higher-order modes are associated with small-scale structures. In general, the results of figure 11 have fully proven that the different POD modes can indeed correspond to various specific flow structures. This relationship implies that the flow evolution in the dynamic stall can be described by individual simplified physical schemas.
Spatiotemporal contours of the reconstructed Cp on the suction surface in Case 1. (a) Reconstruction based on the first and second modes, (b) reconstruction based on the third and fourth modes and (c) reconstruction based on the fifth and all of the higher-order modes.

Based on the understanding of the pressure characteristics during dynamic stall, and inspired by the results of figure 11, the evolution of the pressure on the suction surface during dynamic stall is summarized into three intuitive and basic physical schemas here: (i) concentration of leading-edge negative pressure, (ii) downstream movement of negative peak pressure and (iii) small-amplitude fluctuations of pressure. During the whole dynamic stall process, the pressure evolution on the suction surface can be regarded as alternating or combining these three physical schemas. Figure 12 shows their schematic diagrams. The spatial pressure distributions at five different moments are given in each panel, and each line represents the spatial pressure distribution on the suction surface at a certain time. In the first schema, the concentration of leading-edge negative pressure mainly exists before DSV initiation. In figure 12(a), for simplicity, the pressure distribution is directly simplified to a linear form to characterize the macroscopic trend. The validity and rationality of this simplification are further explained in § 6.1. The second schema shown in figure 12(b) mainly depicts the influence of DSV or subsequent LEVs, so it is predominant after DSV initiation. Figure 12(c) shows that the third schema mainly reflects the pressure fluctuations caused by various small-scale flow structures. This schema exists in the whole process of dynamic stall, but its intensity and form in different stages are different, and the amplitudes of the sine waves in figure 12(c) should be far less than the pressure fluctuation amplitudes expressed in the first and second schemas. It can be speculated that some critical indicators related to dynamic stall could be constructed by measuring these three basic physical schemas.
Three basic physical schemas of the pressure evolution on the suction surface in the dynamic stall process: (a) concentration of leading-edge negative pressure, (b) downstream movement of negative peak pressure and (c) small-amplitude fluctuations of pressure. The grey arrows in (a, b) represent the chronological order.

4.2. Spatial distribution coefficient of pressure
To characterize the above three basic physical schemas uniformly and quantitatively, a new critical indicator, the SDCP, is proposed to depict the variation in spatial pressure distribution. Suppose that Ns pressure transducers are distributed on the suction surface of the airfoil from the leading edge to the trailing edge, the serial number of which is n = 1, 2, 3, … Ns. The pressure coefficient of the nth transducer at  ${t^\ast }$ is denoted as
 ${C_{p,n}}({t^\ast })$, the chordwise dimensionless coordinate of this transducer is denoted as
 $x_n^\ast $, where
 $x_n^\ast = {x_n}/c$, and then the SDCP is defined as
 \begin{align}\textrm{SDCP}({t^\ast })
&= \sum\limits_{n = 1}^{{N_s} - 1} {[{C_{p,n + 1}}({t^\ast
}) - {C_{p,n}}({t^\ast })]}\times (1 - x_n^\ast
)^{{\textrm{sgn(}{C_{p,n + 1}}({t^\ast }) -
{C_{p,n}}({t^\ast })\textrm{)}}}{x}_{n}^{\ast} {}^{[1 -\textrm{sgn}(C_{p,n + 1}(t^\ast)-C_{p,n}(t^\ast))]},\end{align}
where ‘sgn’ is the standard symbolic function, which is defined as
 \begin{equation}\textrm{sgn}(x) =
\left\{ {\begin{array}{@{}ll} {1,}&{\textrm{if}\;x \ge
0}\\ {0,}&{\textrm{if}\;x < 0.} \end{array}}
\right.\end{equation}
Equation (4.1) gives the definition of SDCP when discretely distributed transducers are used. However, when spatially continuous pressure data are used, the number of transducers Ns tends to infinity, and therefore the expression of SDCP becomes
 \begin{align}\mathop {\lim
}\limits_{{N_s} \to \infty } \textrm{SDCP}({t^\mathrm{\ast
}}) = \int_0^1 {\frac{{\partial {C_p}({x^\mathrm{\ast
}},{t^\mathrm{\ast }})}}{{\partial {x^\mathrm{\ast }}}}}
{(1 - {x^\mathrm{\ast }})^{\textrm{sgn(}\partial
{C_p}\textrm{(}{x^\mathrm{\ast }},\,{t^\mathrm{\ast
}}\textrm{)/}\partial {x^\mathrm{\ast }})}}{x^{\mathrm{\ast
}[1 - \textrm{sgn}(\partial {C_p}({x^\mathrm{\ast
}},\,{t^\mathrm{\ast }})/\partial {x^\mathrm{\ast
}})]}}\,\textrm{d}\kern0.7pt{x^\mathrm{\ast
}},\end{align}
where  $\partial {C_p}({x^\mathrm{\ast }},{t^\mathrm{\ast }})/\partial {x^\mathrm{\ast }}$ is the spatial partial derivative of
 ${C_p}({x^\mathrm{\ast }},{t^\mathrm{\ast }})$. Although the expression of SDCP in (4.3) includes the derivative, it is just the extreme situation when the number of transducers tends to infinity. It is shown later that the SDCP is not particularly sensitive to noise when it is calculated using instantaneous wind tunnel experimental data measured by a limited number of transducers.
As mentioned above, the pressure evolution on the suction surface in the dynamic stall process can be summarized into three basic physical schemas. According to our further verification, the SDCP changes regularly with the main parameters in these three schemas. For example, in the first physical schema, the SDCP increases with an increase in leading-edge negative peak pressure; in the second schema, the SDCP decreases with the downstream movement of the negative peak pressure; in the third schema, the SDCP increases with an increase in the frequency and amplitude of the sine waves. Therefore, the SDCP can characterize these three basic physical schemas, demonstrating that the SDCP can characterize the actual pressure evolution in the dynamic stall process and predict the critical flow event.
Figure 13 shows the variation in the lift coefficient CL and SDCP with  ${t^\ast }$ in Case 1. For the convenience of display, the lift coefficient and indicator SDCP are normalized by dividing their maximum values. Here and below, all the data in the figures whose ordinate is ‘normalized value’ adopt such a normalized method. As shown in figure 13, when the airfoil starts to pitch up from α = −6° (t* = 0), the SDCP first decreases with fluctuations. As the time approaches
 $t_1^\ast $, the SDCP rises rapidly, and a sharp local peak appears just before
 $t_1^\ast $. Then, the SDCP continues to rise after a short descent and reaches the maximum around
 $t_2^\ast $. After
 $t_2^\ast $, the SDCP continues to decrease shortly before the DSV detachment, denoted by
 $t_3^\ast $, and then a local peak value appears again. The fact that the SDCP has a local peak or maximum at approximately
 $t_1^\ast $ and
 $t_2^\ast $ is of great significance, which means that the SDCP marks the occurrence of two critical flow events, namely LSB formation and DSV initiation. Moreover, the SDCP reflects the internal relationship between these two flow events from the view of pressure.
Variation in CL and SDCP with time in Case 1.

Although the SDCP has a local peak around both  $t_1^\ast $ and
 $t_2^\ast $, the physical mechanism behind them is different. At moment
 $t_1^\ast $, the first basic physical schema shown in figure 12(a) is still developing continuously and has not reached the critical state. Simultaneously, the second physical schema has not yet appeared. Therefore, the local peak of the SDCP around
 $t_1^\ast $ mainly reflects the criticality of the third schema, which corresponds to the extremums or mutations of the time coefficients of high-order modes around
 $t_1^\mathrm{\ast }$ in the pressure POD analysis. Before moment
 $t_2^\ast $, no massive flow separation is observed at the leading edge, and the leading-edge negative peak pressure is constantly uplifted; thus, the pressure evolution is dominated by the first physical schema. However, after
 $t_2^\ast $, the leading-edge negative peak pressure has collapsed, and the DSV has formed. With the aftward movement of the negative peak pressure location, the pressure evolution begins to be dominated by the second physical schema. The local peak of the SDCP around
 $t_2^\ast $ reflects the transition from the first physical schema to the second physical schema.
4.3. High-order central moment of pressure
Figure 9 shows that the statistical distribution of surface pressure also changes with the flow evolution during the dynamic stall process. Therefore, using statistics to measure the variation in the pressure coefficient can also predict the occurrence of critical flow events. Here, the HCMP is used as the statistic. In the calculation of HCMP, the pressure coefficient data from different spatial measurement points are used, and the mathematical definition of the HCMP is
 \begin{equation}\textrm{HCMP(}{t^\ast }\textrm{)} = \frac{1}{{{N_s}}}\sum\limits_{n = 1}^{{N_s}} {{{\{ [ - {C_{p,n}}({t^\ast })] - [ - \overline {{C_p}({t^\ast })} ]\} }^m}} ,\end{equation}
where m is the order of the moment, prescribing that m ∈ N+, and m > 1. In (4.4),  $\overline {{C_p}({t^\ast })} $ represents the average value of the pressure coefficient from all pressure transducers at a certain time:
 \begin{equation}\overline {{C_p}({t^\mathrm{\ast }})} = \frac{1}{{{N_s}}}\sum\limits_{n = 1}^{{N_s}} {{C_{p,n}}({t^\mathrm{\ast }})} .\end{equation}
Figure 14 shows the variation in the HCMP of different orders with  ${t^\mathrm{\ast }}$ in Case 1. When m = 2, the maximum value of the HCMP is between
 $t_2^\ast $ and
 $t_3^\ast $, which cannot correctly reflect the criticality of flow. When
 $m \ge 3$, the maximum value of the HCMP is always around moment
 $t_2^\ast $. Moreover, the higher the order is, the narrower the peak of the HCMP is, and the smoother the curve is in the poststall stage. Although only HCMPs with orders less than 16 are shown in the figure, HCMPs with larger orders have similar properties. The results of figure 14 indicate that the HCMP can be used as a critical indicator to predict DSV initiation. In the following, the 16th-order HCMP is used by default.
Variation in CL and HCMP of different orders with time in Case 1. The dashed line, dotted line and solid line correspond to the moments of LSB formation, DSV initiation and DSV detachment, respectively.

The definition of HCMP only uses the central moment as the statistic, which is one of the most basic statistics. In mathematics, many statistics can be constructed based on the central moment. Therefore, in addition to the HCMP, there should be more statistical indicators that can be used to indicate the flow criticality at  $t_2^\ast $.
4.4. Location of peak pressure
As mentioned above, after its initiation, the DSV experiences a process of continuous growth and convection downstream. It is possible to monitor the flow state of the DSV in the process of convection using its pressure footprint left on the wall. In the convection process, the most obvious trace left by the DSV on the surface is a strong pressure wave. In figure 3(a), the propagation of this pressure wave in Case 1 can also be seen clearly. This pressure wave is very common in different cases with different parameters, even with different motion kinematics. Therefore, it is feasible to use the pressure wave to monitor the state of the DSV in the convection process and the associated critical events in a very wide range of flow scenarios.
To capture the position of the pressure wave in real time by pressure transducers, a simple definition is introduced here. The weighted average chordwise coordinates of the 10 % measurement point with the strongest negative pressure at each moment are taken as the LPP. The determination of the value of 10 % is based on the estimation of the spatial scale of the core region of DSV-induced negative pressure wave. According to the present study, a slight change in this value will not affect the effectiveness of the LPP indicator. Assuming that at time  ${t^\ast }$ the serial number of the 10 % transducers with the strongest negative pressure on the suction surface is n = 1, 2, 3, … Nmax 10%, where Nmax 10% is equal to the rounding of Ns × 10 %, then the mathematical expression of LPP is
 \begin{equation}\textrm{LPP}({t^\ast }) = \frac{{\sum\limits_{n = 1}^{{N_{max10\,\%}}} {{C_{p,n}}(x_n^\ast ,{t^\mathrm{\ast }})x_n^\ast } }}{{\sum\limits_{n = 1}^{{N_{max10\,\%}}} {{C_{p,n}}(x_n^\ast ,{t^\mathrm{\ast }})} }}.\end{equation}
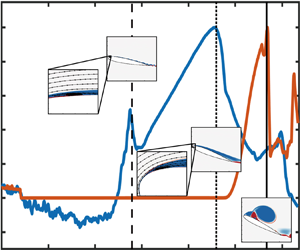
Figure 15 shows the variation in LPP during the existence of the DSV in Case 1. The blue line in the figure represents the chordwise coordinates of the position of the DSV centre, xv, identified from the flow field by the  ${\varGamma _1}$ criterion. At
 $t_2^\ast $ moment, the position of the DSV centre is close to the leading edge, so xv is close to zero. At this time, LPP is also at a small value due to the existence of the leading-edge negative peak pressure. Before
 $t_3^\ast $, the values of LPP and xv are always close to each other and increase with time together. This result shows that the LPP can effectively identify the chordwise position of the DSV centre before DSV detachment. After
 $t_3^\ast $, the values of LPP and xv begin to deviate. This is because the DSV continues to move downstream after detachment, but the negative surface pressure induced by the DSV weakens rapidly with DSV away from the airfoil. On the other hand, the newly formed LEVs make the strongest negative pressure appear near the leading edge again, which leads to a decrease in LPP.
Variation in the chordwise position of the DSV centre and LPP with time in Case 1.

4.5. Modulated location of peak pressure
Figure 15 shows that before DSV detachment, the value of LPP coincides with the position of the DSV centre, but they deviate rapidly after DSV detachment. Therefore, using this characteristic of LPP, the time of DSV detachment can be monitored. Figure 16(a) shows the variation in LPP with time in the whole process of dynamic stall. The LPP is close to zero for a long time before  $t_2^\ast $, but it begins to rise after
 $t_2^\ast $ and reaches a local peak at approximately
 $t_3^\ast $. After DSV detachment, the value of LPP decreases rapidly. However, due to the formation of trailing-edge vortices in the later stage, the value of LPP increases again and reaches a maximum until the end of the motion.
Variation in CL and (a) LPP and (b) MLPP with time in Case 1.

Although the variation in LPP can effectively reflect the criticality of DSV detachment, to identify the  $t_3^\ast $ moment more clearly, the LPP can be further modulated to make its peak value at
 $t_3^\ast $ more obvious. Figure 17 shows the spatiotemporal contour of the root-mean-square value of the pressure coefficient (Cp,RMS) on the suction surface. The definition of Cp,RMS used in this study is
 \begin{equation}{C_{p,RMS}}({x^\mathrm{\ast }},{t^\mathrm{\ast }}) = \sqrt {\frac{1}{{\Delta {t^\mathrm{\ast }}}}\int_{{t^\mathrm{\ast }} - \Delta {t^\mathrm{\ast }}}^{{t^\mathrm{\ast }}} {{{[{C_p}({x^\mathrm{\ast }},{t^\mathrm{\ast }}) - \overline {{C_p}({x^\mathrm{\ast }},{t^\mathrm{\ast }})} ]}^2}\,\textrm{d}{t^\ast }} } ,\end{equation}
where  $\overline {{C_p}({x^\mathrm{\ast }},{t^\mathrm{\ast }})} $ is the sliding average value of the pressure coefficient at
 ${x^\mathrm{\ast }}$ in the period of
 $\Delta {t^\mathrm{\ast }}$ and
 $\Delta {t^\mathrm{\ast }}$ is the dimensionless time interval defining the filtering process, with
 $\Delta {t^\mathrm{\ast }} = 1$ here. Equation (4.7) follows the definition method of Benard et al. (Reference Benard, Cattafesta, Moreau, Griffin and Bonnet2011). In this definition, the calculation of Cp,RMS only needs the historical value and current value of the surface pressure at a particular time so that it can be calculated in real time.
Spatiotemporal contour of Cp,RMS in Case 1. The abnormality of  ${C_{p,RMS}}$ during
 $0 < {t^\mathrm{\ast }} < 1$ is due to the starting acceleration at
 ${t^\mathrm{\ast }} = 0$, which causes very large added-mass forces and surface pressure at this moment.

It can be seen from figure 17 that during the whole motion, Cp,RMS on the front section of the airfoil is at its largest during a period before and after DSV detachment. This high-peak region provides a window containing DSV detachment. Therefore, the LPP can be modulated by Cp,RMS to obtain the MLPP, which is defined as
 \begin{equation}\textrm{MLPP}({t^\mathrm{\ast }}) = \textrm{LPP}({t^\mathrm{\ast }})\times {\sum\limits_{n = 1}^{{N_s}} {{{[{C_{p,RMS}}(x_n^\ast ,{t^\mathrm{\ast }})]}^m}} },\end{equation}
where the mth power of Cp,RMS is used to modulate the LPP and the power exponent m is an empirical parameter to control the degree of modulation. In this study, m is taken as 3 uniformly in all cases. Figure 16(b) shows the variation in MLPP in Case 1. After modulation, the peak value of MLPP around  $t_3^\ast $ is more obvious than that of LPP, which is more conducive to accurate identification. Therefore, it is feasible to predict DSV detachment using MLPP.
In this section, critical indicators SDCP, HCMP, LPP and MLPP are proposed. These four critical indicators can accurately predict the critical moments of LSB formation, DSV initiation, position of the DSV centre and DSV detachment. In addition to the above results, Appendix A further presents the influence of motion unsteadiness in Case 2 and Case 3, and the applicability of these critical indicators has been further confirmed. Appendix B verifies the critical indicators in Cases A–D. These results have proven that the present critical indicators are not only applicable to a few individual cases but also have a wide range of universality.
5. Verification of wind tunnel experimental data
The ability of the critical indicators constructed in this study to predict DSV-related flow events has been proven, and their applicability in different flow scenarios has also been verified in the appendices. However, the above findings are based on the results of numerical simulation. In the actual wind tunnel experiment, the pressure transducers are distributed discretely, and the measured signals contain the noise of different frequencies. Moreover, for periodic motion such as sinusoidal pitching, the signals of different periods have a certain degree of aperiodicity. Therefore, it is necessary to pay more attention to the applicability and performance of the above critical indicators in the experimental data.
Case E is a classic wind tunnel case in which the flow situation and variation of the LESP have been widely studied (Mulleners & Raffel Reference Mulleners and Raffel2012, Reference Mulleners and Raffel2013; Deparday & Mulleners Reference Deparday and Mulleners2019; Ansell & Mulleners Reference Ansell and Mulleners2020). In Case E, an OA209 airfoil is selected for sinusoidal pitching motion, and the specific kinematic parameters are introduced in § 2.1. Figure 18 shows the spatiotemporal contour of the pressure coefficient on the suction surface in Case E, where the dashed line, dotted line and solid line represent the moments of static stall  $t_{ss}^\ast $, DSV initiation
 $t_2^\ast $ and DSV detachment
 $t_3^\ast $, respectively. The specific values of these three moments are based on the quantitative identification of Mulleners & Raffel (Reference Mulleners and Raffel2012, Reference Mulleners and Raffel2013). Before the initiation of DSV, the leading-edge negative pressure increases continuously, and its peak collapses rapidly after the initiation of DSV. This is consistent with the previous Case 1. However, Case E has a characteristic that is different from Case 1; that is, the DSV does not induce an obvious pressure-wave trace before its detachment due to the smaller reduced frequency k used in Case E. In Case E, the DSV is not generated directly from the leading edge as in Case 1 but is formed by combining small-scale coherent structures produced by the instability of the separated shear layer. The DSV in Case E has a lower strength and rapidly pinches off soon after its initiation. Therefore, in the following, the indicators LPP and MLPP, which are constructed based on the pressure wave induced by DSV, are not applied in Case E.
Spatiotemporal contour of Cp on the suction surface in Case E. The dashed line, dotted line and solid line represent the moments of the static stall  $t_{ss}^\ast $, DSV initiation
 $t_2^\ast $ and DSV detachment
 $t_3^\ast $, respectively.

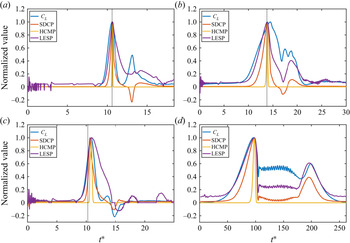
Figure 19 shows the variation in CL, SDCP, HCMP and LESP in Case E. The coloured lines in the figure are phase-averaged results and the background grey lines are the instantaneous results of 39 cycles. The data in the figure are from all 27 pressure transducers on the suction surface (blue dots in figure 1c). All the phase-averaged values of SDCP, HCMP and LESP increase before  $t_2^\mathrm{\ast }$ and reach their respective maximum at approximately
 $t_2^\mathrm{\ast }$, which indicates that SDCP and HCMP can also be used as critical indicators of DSV initiation in experimental data. Furthermore, an important phenomenon is that the aperiodicity and noise of the instantaneous CL and LESP are very weak before
 $t_3^\mathrm{\ast }$, but they increase greatly after DSV detachment. However, for SDCP, although the time range of its aperiodicity and noise interference is the same as that of LESP, the fluctuation amplitude is smaller than that of LESP, which indicates that SDCP has better noise robustness. This performance of SDCP is speculated to be related to the wider distribution of pressure transducers. In addition, figure 19(c) shows that the time range of the aperiodicity and noise interference of the HCMP is mainly concentrated near
 $t_2^\mathrm{\ast }$, while the aperiodicity and noise amplitude are relatively small in the poststall stage. This result suggests that the HCMP based on statistical analysis can provide additional information about the DSV evolution, which is different from the SDCP and LESP.
Variation in (a) CL, (b) SDCP, (c) HCMP and (d) LESP in Case E. The coloured lines represent phase-averaged results, and the background grey lines are the instantaneous results of 39 cycles.

6. Influence of number of pressure transducers
6.1. Test on Case 1
The influence of the number of transducers on the critical indicators is further discussed in this section. Figure 20 shows the variations in SDCP, HCMP, LPP and MLPP in Case 1 when the number of pressure transducers Ns is equal to 40, 20, 6 and 2. Here, the transducers are always uniformly distributed from the leading edge to the trailing edge. When Ns = 40, the SDCP, HCMP, LPP and MLPP are almost similar to the situation of continuous pressure being used. However, although the SDCP can still accurately predict  $t_2^\ast $, its local peak at approximately
 $t_1^\ast $ is no longer obvious. According to the LES results of Visbal (Reference Visbal2014), Visbal & Garmann (Reference Visbal and Garmann2018), Benton & Visbal (Reference Benton and Visbal2019) and Sharma & Visbal (Reference Sharma and Visbal2019), the minimum scale of LSB can contract to the order of O(0.01c). In addition, from the results of the POD analysis above, it is known that the flow criticality at
 $t_1^\ast $ is mainly related to some small-scale flow structures. Therefore, it is reasonable that discrete pressure transducers cannot accurately capture the information of LSB and other small-scale structures. When Ns = 20, the SDCP and HCMP can still accurately predict DSV initiation. The LPP and MLPP become unsmooth with the decrease in Ns because, in this situation, there are only a few transducers in the core range of the pressure wave. With fewer transducers, the prediction accuracy of LPP and MLPP further declines. However, figure 20(d) shows that the SDCP and HCMP can still accurately predict DSV initiation even when Ns = 2.
Influence of the number of pressure transducers on the critical indicators in Case 1: (a) Ns = 40, (b) Ns = 20, (c) Ns = 6 and (d) Ns = 2.

When Ns = 2, it is equivalent to using only two transducers, which are located at the leading-edge point and trailing-edge point. Under this circumstance, the definition of SDCP in (4.1) degenerates to
 \begin{align}\textrm{SDCP}({t^\ast
}){|_{{N_s} = 2}} = \left\{{\begin{array}{@{}ll}
{{C_{p,TE}}({t^\ast }) - {C_{p,LE}}({t^\ast
})}&{\textrm{if}\;{C_{p,TE}}({t^\ast }) -
{C_{p,LE}}({t^\ast }) \ge 0}\\
0&{\textrm{if}\;{C_{p,TE}}({t^\ast }) - {C_{p,LE}}({t^\ast
}) < 0} \end{array}}
\right.\end{align}
and the definition of HCMP in (4.4) degenerates to
 \begin{align}\textrm{HCMP}({t^\ast
}\textrm{)}{|_{{N_s} = 2}} = \; \left\{
{\begin{array}{@{}ll} {\dfrac{{{{[{C_{p,TE}}({t^\ast })
- {C_{p,LE}}({t^\ast })]}^m}}}{{{2^m}}}}&{\textrm{if}\;m =
2i,\;\textrm{and}\;i = 1,2,3 \ldots }\\ 0&{\textrm{if}\;m =
2i + 1,\;\textrm{and}\;i = 1,2,3 \ldots ,} \end{array}}
\right.\end{align}
where  ${C_{p,\; TE}}$ represents the pressure at the trailing edge and
 ${C_{p,\; LE}}$ represents the pressure at the leading edge. During most of a dynamic stall period, due to the existence of leading-edge negative pressure,
 ${C_{p,TE}}({t^\ast }) - {C_{p,LE}}({t^\ast })$ is generally larger than 0. Therefore, (6.1) shows that when Ns = 2, the SDCP is equivalent to the pressure difference between the trailing-edge point and the leading-edge point. Equation (6.2) indicates that if the exponent m is odd, HCMP is equal to 0; if the exponent m is even, HCMP is equal to the high-order power of the pressure difference between the trailing-edge and leading-edge points. Therefore, when Ns = 2, the SDCP and HCMP have similar physical essence.
Figure 21 shows the spatial distribution and statistical distribution of the pressure coefficient on the suction surface at four different moments in Case 1 when Ns = 2. The four moments in figure 21 correspond to the four moments in figure 9. When Ns = 2, although many details have been lost, the overall trend of the spatial and statistical distribution of the pressure coefficient is still retained. Therefore, the SDCP and HCMP can still extract pivotal information on pressure variation to accurately predict the initiation of the DSV. According to observations of the pressure history, it can be found that the variation of the pressure at the trailing edge mainly occurs after DSV detachment, so the transducer at the leading edge plays a more important role in predicting DSV initiation. In figure 12, for the first basic physical schema of pressure evolution, i.e. the concentration of leading-edge negative pressure, the spatial distribution of pressure is simplified as linear and the trailing-edge pressure is always specified as 0. The results of figure 21 show that this simplification can still characterize the overall and qualitative variation trend of pressure. Therefore, this simplification is reasonable to some extent.
Spatial distribution (left column) and statistical distribution (right column) of the pressure coefficient on the suction surface at (a)  ${t^\mathrm{\ast }} = 3.53$, (b)
 ${t^\mathrm{\ast }} = 5.58$, (c)
 ${t^\mathrm{\ast }} = 9.18$ and (d)
 ${t^\mathrm{\ast }} = 11.34$ in Case 1 when Ns = 2.

6.2. Test on Case E
Figure 19 shows the performance of SDCP and HCMP in the experimental case when Ns = 27. However, based on the findings in § 6.1, there are still two problems to be further explored: (i) whether fewer transducers can accurately predict DSV initiation in experimental data with noise and aperiodicity; (ii) in § 6.1, it has been proven that the SDCP and HCMP can still accurately predict DSV initiation when Ns = 2. Under this circumstance, the two pressure transducers are strictly located at the positions of x/c = 0 and x/c = 1. However, it is difficult for the actual transducer to be installed on the theoretical leading-edge point and trailing-edge point. At this point, to clarify whether the above conclusions change needs further study.
Figure 22 shows the performance of SDCP and HCMP with fewer transducers in Case E, and the data in the figure are calculated by selecting some of the original 27 transducers. Here, Nm represents an array of serial numbers of the transducer that are used. For example, Nm = [1, 27] means that only transducers 1 and 27 are used, that is, the transducer closest to the leading edge and the transducer closest to the trailing edge. From figure 22, it can be seen that even if the number of transducers is reduced to Ns = 2, the SDCP and HCMP can still correctly predict the initiation of DSV. This finding is of great significance for the prediction of DSV initiation on micro wings and flexible wings.
Influence of the transducer number on the SDCP (left column) and HCMP (right column) in Case E: (a) Nm = [1, 3, 5, 7, 9, 11, 13, 15, 17, 19, 21, 23, 25, 27] and (b) Nm = [1, 27]. The coloured lines represent phase-averaged results, and the background grey lines are instantaneous results of 39 cycles.

7. Discussion
In addition to the time-varying trend of the SDCP, the variation in the critical value of the SDCP with kinematic parameters also has great significance. Database N contains a total of 100 cases with DSV formation, and the critical values of the SDCP and LESP at  $t_2^\ast $ in these 100 cases are shown in figure 23. The specific value of
 $t_2^\ast $ is directly derived from the identification in database N, that is, ‘the first appearance of an inflection point within the negative-Cf region’. In figure 23, the abscissa is the instantaneous angular velocity of the airfoil at
 $t_2^\ast $, which represents the unsteadiness of the motion at the critical moment. The straight lines in the figures connect the values of the cases whose pivot is located at the mid-chord point. Figure 23 is similar to figure 15 in Narsipur et al. (Reference Narsipur, Hosangadi, Gopalarathnam and Edwards2020) (although the meanings of the colours and symbols are slightly different) so that readers can easily compare the characteristics of the SDCP and the original/modified LESP. It can be seen from figure 23 that, regardless of the airfoil shape or Reynolds number, the variation of the critical value of SDCP with the parameters is very close to that of LESP. At a low Reynolds number, the critical values of SDCP and LESP increase approximately linearly with increasing motion unsteadiness. At a high Reynolds number, the critical values of SDCP and LESP are less sensitive to motion unsteadiness but are more sensitive to the pivot location. Therefore, it is significant to find a way to further reduce the dependence of the LESP and SDCP on kinematic parameters.
Variation in the critical values of LESP and SDCP at  $t_2^\ast $ with different parameters. (a) NACA 0012 airfoil, Re = 3 × 10⁴, (b) SD7003m airfoil, Re = 3 × 10⁴, (c) NACA 0012 airfoil, Re = 3 × 10⁶ and (d) SD7003m airfoil, Re = 3 × 10⁶. (This figure follows the drawing form of figure 15 in Narsipur et al. (Reference Narsipur, Hosangadi, Gopalarathnam and Edwards2020). Reproduced with permission from Narsipur et al., J. Fluid Mech., 900, A25 (2020). Copyright 2020 Cambridge University Press.)

The above results of this study have shown that during the process of dynamic stall, although the value of surface pressure varies greatly in different cases, the pressure evolution follows three basic physical schemas. Therefore, the intuitive idea is that if the pressure coefficient in different cases is standardized and the data are scaled in proportion to make it fall into a specific area, then the influence of the specific value of pressure on the results is reduced. This standardized pressure coefficient reflects only the pressure evolution schema and critical flow events and is independent of the pressure’s specific value and variation details in each case. Therefore, it has a weak dependence on the kinematic parameters. Data standardization is a basic datamining work, and there are many different data standardization methods in mathematics. Here, we recommend one of the most common standardization methods: Z-score standardization. Z-score standardization makes the data unified, improves the comparability of data and weakens the interpretation of data. Here, Z-score standardization is effected using the spatial pressure distribution on the whole suction surface at each moment. The definition of the Z-score standardization method of the pressure coefficient is shown in (7.1):
 \begin{equation}\widetilde {{C_{p,n}}}({t^\mathrm{\ast }}) = \frac{{{C_{p,n}}({t^\mathrm{\ast }}) - \; \overline {{C_p}({t^\mathrm{\ast }})} }}{{\sqrt {\frac{1}{{{N_s} - 1}}\sum\limits_{n = 1}^{{N_s}} {{{[{C_{p,n}}({t^\mathrm{\ast }}) - \; \overline {{C_p}({t^\mathrm{\ast }})} \; ]}^2}} } }},\end{equation}
where  $\overline {{C_p}({t^\mathrm{\ast }})} $ represents the average value of the pressure coefficient from all transducers at
 ${t^\mathrm{\ast }}$, its definition being given in (4.5). In (7.1), the denominator is the standard deviation of the pressure coefficient from all transducers at
 ${t^\mathrm{\ast }}$. After the above standardization process, the data centre of
 $\widetilde {{C_{p,n}}}({t^\mathrm{\ast }})$ is kept at 0 at every moment, and its theoretical range is
 $( - \infty ,\; + \infty )$. In this method, only the pressure coefficient is used for standardization, without information such as instantaneous flow parameters and motion parameters being used except the reference static pressure
 ${p_\infty }$ and dynamic pressure
 ${\textstyle{1 \over 2}}\rho U_\infty ^2$ used in calculating the pressure coefficient. Therefore, the Z-score standardization of the pressure coefficient is a ‘self-calibrated’ method, which can be applied to cases with unclear flow conditions or motion conditions, such as a sudden gust response or rapid manoeuvre.
Figure 24(a) shows the spatiotemporal contour of the Z-score standardized pressure coefficient  $\widetilde {{C_p}}$ on the suction surface in Case 1, which corresponds to figure 3(a). Although the Z-score standardization method reduces the influence of the pressure's specific value, it still retains the basic schemas of pressure evolution in the process of dynamic stall. Moreover, most of the major pressure footprints, such as the concentration of leading-edge negative pressure, the pressure trace of the LSB and the pressure wave induced by the DSV, are still clearly visible in figure 24(a). Figures 24(b)–24(d) show the spatiotemporal contours of the Z-score standardized pressure coefficient
 $\widetilde {{C_p}}$ reconstructed by its different POD modes, corresponding to Figures 11(a)–11(c), respectively. From these figures, it can be seen that the corresponding relationship between the pressure POD modes and flow structures observed in figure 11 is still applicable for
 $\widetilde {{C_p}}$. Therefore, the basic conclusions drawn from figure 11 will not be affected by Z-score standardization.
(a) Original spatiotemporal contour of  $\widetilde {{C_p}}$ on the suction surface in Case 1, (b) reconstruction of
 $\widetilde {{C_p}}$ based on the first and second modes, (c) reconstruction of
 $\widetilde {{C_p}}$ based on the third and fourth modes and (d) reconstruction of
 $\widetilde {{C_p}}$ based on the fifth and all of the higher-order modes.

After  $\widetilde {{C_p}}$ has been obtained, the modified SDCP can be obtained by taking
 $\widetilde {{C_p}}$ into (4.1) to replace the original pressure coefficient Cp. The modified SDCP is denoted as SDCPzs. It needs to be noted that the definition of
 $\widetilde {{C_p}}$ in (7.1) can still meet the requirements of real-time calculation, so the new critical indicator SDCPzs constructed by
 $\widetilde {{C_p}}$ is still of a real-time nature. Figures 25(a) and 25(b) compare the SDCP and SDCPzs in Case 1, Case 2 and Case 3 over some time. In this study, Case 2 and Case 3 adopt the same parameters as Case 1, except the dimensionless angular velocity
 ${\omega ^ + }$, which is equal to 0.1 and 0.2, respectively, reflecting the dynamic stall characteristics under higher unsteadiness. Because the motions of Case 1, Case 2 and Case 3 have different convection time spans, for the convenience of comparison, a standardized time
 $\tilde{t}$ is used as the abscissa of figure 25. Here
 $\tilde{t}$ is defined as the maximum–minimum standardized data of flow time
 ${t^\ast }$, and the standardization is based on
 $t_1^\ast $ and
 $t_2^\ast $:
 \begin{equation}\tilde{t} = \frac{{{t^\ast } - t_1^\ast \; }}{{t_2^\ast - t_1^\ast \; }}.\end{equation}
According to the definition of (7.2), for any case,  $\tilde{t} = 0$ corresponds to the original
 $t_1^\ast $ moment and
 $\tilde{t} = 1$ corresponds to the original
 $t_2^\ast $ moment.
Variation in (a) SDCP and (b) SDCPzs with the standardized time  $\tilde{t}$ in Cases 1, 2 and 3. The dashed line and the dotted line represent the LSB formation moment and the DSV initiation moment, respectively.

It can be seen from figure 25 that without standardization, the SDCP values in Case 1, Case 2 and Case 3 have a similar trend during the time interval  $0 < \tilde{t} < 1$, but the specific values are different, especially at the DSV initiation moment of
 $\tilde{t} = 1$. The critical values of the SDCP at this moment increase with increasing motion unsteadiness. However, after Z-score standardization, the SDCPzs in Case 1, Case 2 and Case 3 collapse into a line and vary with time together. In particular, at the DSV initiation moment, the values of the SDCPzs in these three cases are almost the same. This result proves that the Z-score standardization method meets the expectation of the data standardization mentioned above and further proves that there are similar pressure evolution schemas in different dynamic stall cases. More importantly, the pressure evolution schemas in cases with different parameters can be reduced to a unified form by eliminating the specific value of pressure.
To further verify the universality of the data standardization method mentioned above, figure 26 shows the variation of the critical values of SDCPzs at DSV initiation time with the kinematic parameters. Figure 26 involves the same 100 cases as figure 23. Figure 23 shows that the critical values of both the LESP and SDCP have a sensitivity to the kinematic parameters to a certain extent. However, as shown in figure 26, after the standardization of the pressure coefficient, the dependence of the critical value of SDCPzs on the kinematic parameters is weaker, especially in the high-Reynolds-number cases. This result shows that data standardization has great significance in the normalization of the critical indicators of the DSV.
Variation in the critical values of SDCPzs at  $t_2^\ast $ with different parameters. (a) NACA 0012 airfoil, Re = 3 × 10⁴, (b) SD7003m airfoil, Re = 3 × 10⁴, (c) NACA 0012 airfoil, Re = 3 × 10⁶ and (d) SD7003m airfoil, Re = 3 × 10⁶.

In addition to the kinematic parameters, the influence of the Reynolds number is further compared. In the histograms of figure 27, the two coordinates in the horizontal plane represent K and the pivot location, and the height of the square cylinder is equal to the ratio of the critical value of SDCP (or SDCPzs) at Re = 3 × 10⁶ to the critical value of SDCP (or SDCPzs) at Re = 3 × 10⁴. Here, the critical values refer to the value of SDCP or SDCPzs at the DSV initiation time. This ratio represents the difference in the critical values of indicators between high-Reynolds-number cases and low-Reynolds-number cases when other parameters are the same. In other words, the physical meaning of the square cylinder height is the sensitivity of the critical value of SDCP or SDCPzs to the Reynolds number: the higher the square cylinder is, the more sensitive it is to the Reynolds number; the closer the height of the square cylinder is to 1, the less sensitive it is. The ratio of SDCPzs of the cases with different kinematic parameters is much smaller than that of SDCP for either the NACA 0012 airfoil or SD7003m airfoil, which indicates that the present proposed modification method can effectively reduce the sensitivity of the critical value of SDCP to the Reynolds number. This fully reflects the advantage of ‘self-calibration’ using the pressure data on the whole suction surface of the airfoil.
The ratio of the critical value of SDCP (or SDCPzs) at Re = 3 × 10⁶ to the critical value of SDCP (or SDCPzs) at Re = 3 × 10⁴ under different kinematic parameters. (a) NACA 0012 airfoil, the ratio of SDCP; (b) SD7003m airfoil, the ratio of SDCP; (c) NACA 0012 airfoil, the ratio of SDCPzs; (d) SD7003m airfoil, the ratio of SDCPzs.

8. Conclusions
In the process of dynamic stall, different flow structures leave corresponding pressure footprints on the wing surface during their evolution. Through these pressure footprints, abundant information on the flow structures themselves can be obtained, which is conducive to understanding flow development and predicting critical flow events. The POD method is used to analyse the pressure evolution on the suction surface of the airfoil in this study. It has been found that the pressure footprints of the flow structures of different scales are closely related to the different POD modes. Moreover, the extreme values of the time coefficients of these different modes precisely correspond to the occurrence time of critical flow events. The results of POD analysis further show that the flow criticality at several critical moments, such as DSV initiation, is not only related to the flow near the leading edge but also exists on the whole suction surface. Based on these findings, this study summarizes the pressure evolution in the process of a dynamic stall into three basic physical schemas: the concentration of leading-edge negative pressure, the downstream movement of the negative peak pressure and the small-amplitude fluctuations of pressure. By measuring the evolution of these three basic physical schemas, significant information about the flow criticality can be obtained.
This study constructs several critical indicators for predicting DSV-related flow events using the pressure information on the whole suction surface of the airfoil, including the SDCP, HCMP, LPP and MLPP. Among them, the SDCP can predict the formation of LSB and the initiation of DSV, the HCMP can predict the initiation of DSV, the LPP can effectively track the vortex centre during the process of DSV convection and predict the DSV detachment and the MLPP can predict the DSV detachment more clearly. These critical indicators realize the whole-life monitoring of the primary instability stage, the DSV formation stage, the DSV convection stage and the DSV shedding stage. The critical indicators constructed in this study can accurately predict the significant critical events in the dynamic stall process, providing a reference for quantitatively identifying the initiation and termination of each flow stage. Therefore, these critical indicators are conducive to deepening the understanding of the physical essence of different flow stages of dynamic stall and revealing their internal relationships. They are also conducive to explaining the influence of different parameters on dynamic stall and its deep-level flow mechanism. Furthermore, these critical indicators can be used as a reference for the standardized mathematical and physical description of the DSV evolution, thus laying a foundation for the construction of a universal theoretical framework of dynamic stall.
The test on the wind tunnel experimental data has verified the validities of SDCP and HCMP under the influence of noise and aperiodicity. Although the noise-sensitive time ranges of the SDCP and LESP are similar, the SDCP is more robust to noise than the LESP. In addition, the HCMP has a noise-sensitive time range different from that of the LESP and SDCP, which reflects the unique characteristics of statistical indicators. Research on the influence of the number of pressure transducers suggests that the SDCP and HCMP are still effective even if only two transducers are used. Therefore, in practical applications, as long as a few transducers are arranged on the wing surface, it is possible to predict the initiation of DSV. Finally, the critical values of the SDCP and LESP are compared in a very wide parameter envelope. It has been found that the variations in the critical values of SDCP and LESP are highly similar, which implies a potential relationship between them. To further eliminate or reduce the dependence of SDCP on the parameters, a modification method of SDCP based on the Z-score standardized pressure is proposed. The modified SDCP, namely SDCPzs, has a weaker dependence on the kinematic parameters and Reynolds number than the original SDCP and LESP. This modification method is based on the self-calibrated pressure, which is still available even if the instantaneous incoming flow and airfoil motion information is unknown (except for reference quantities being used for dimensionless calculation of Cp). Therefore, this method is speculated to be applicable to wider flow scenarios, such as gust encounter or rapid manoeuvre.
As can be seen, the present critical indicators are constructed based on the two-dimensional flow field. However, due to the application background of dynamic stall, such as the unsteady flapping-wing motion of animals, it is very important to focus on the application of these indicators in three-dimensional flow scenarios. In addition, these indicators have the potential to be applied to some other LEV-dominated flows, including but not limited to the various motions experiencing dynamic stall.
Acknowledgements
The authors wish to thank Professor K. Mulleners of the École Polytechnique Fédérale de Lausanne (EPFL) for sharing the experimental data (Mulleners & Raffel Reference Mulleners and Raffel2012, Reference Mulleners and Raffel2013) and Professor S. Narsipur of North Carolina State University for sharing the numerical simulation data (Narsipur et al. Reference Narsipur, Hosangadi, Gopalarathnam and Edwards2020) used in this study.
Funding
The study was supported by the National Natural Science Foundation of China (grant nos. 11972063 and 11721202).
Declaration of interests
The authors report no conflict of interest.
Appendix A. Verification of cases with higher unsteadiness
As introduced, Case 2 and Case 3 adopt the same parameters as Case 1 but with higher motion unsteadiness. Figure 28 shows the spatiotemporal contours of pressure and skin friction on the suction surface of Case 2 and Case 3. The identification method of  $t_1^\ast $,
 $t_2^\ast $ and
 $t_3^\ast $ in Cases 2 and 3 is the same as that in Case 1. As can be seen, the evolution of flow structures in Case 2 and Case 3 roughly follows a similar pattern to Case 1, but the DSV in Case 2 and Case 3 sheds off earlier, resulting in a smaller development range of the pressure wave.
Spatiotemporal contours of (a) Cp in Case 2, (b) Cp in Case 3, (c) Cf in Case 2 and (d) Cf in Case 3. The horizontal lines have the same meaning as those in figure 3.

Figure 29 shows the variation in CL, SDCP, HCMP, LPP and MLPP with time in Cases 2 and 3. Similar to Case 1, these four critical indicators can accurately indicate the critical moments  $t_1^\ast $,
 $t_2^\ast $ and
 $t_3^\ast $, which proves the applicability of these four indicators in cases with higher unsteadiness. However, although the overall variation of these four indicators is similar to that of Case 1, due to the different flow details, the situation of these indicators in Case 2 and Case 3 is also slightly different from that in Case 1. For example, in Case 3, the LPP only reaches a small local peak at moment
 $t_3^\ast $ due to the earlier detachment of DSV. Accordingly, the peak value of the MLPP at
 $t_3^\ast $ is lower.
Variation in CL, SDCP, HCMP, LPP and MLPP with time in (a) Case 2 and (b) Case 3.

Appendix B. Verification of cases in database N
To further study the variation of the above critical indicators in a wider parameter envelope and to compare the SDCP and HCMP with the LESP, the various cases in database N are further studied. Database N contains a total of 115 cases, all of which adopt the pitch-up-return motion. The specific parameters of these cases are introduced in § 2.1. For the situation of the LESP in these cases, interested readers can refer to the published work of Narsipur et al. (Reference Narsipur, Gopalarathnam and Edwards2019, Reference Narsipur, Hosangadi, Gopalarathnam and Edwards2020).
Cases A, B, C and D are four representative cases selected from database N. Figure 30 shows the variation in SDCP and HCMP with time in these four cases, and the LESP is also shown in the diagram for comparison. Here, the definition of the LESP is the original definition used by Ramesh et al. (Reference Ramesh, Gopalarathnam, Granlund, Ol and Edwards2014), rather than the modified definition of Narsipur et al. (Reference Narsipur, Hosangadi, Gopalarathnam and Edwards2020). Because the information about DSV detachment is not given in database N, the indicators LPP and MLPP are not given in the figure. The vertical line in figure 30(a–c) represents the DSV initiation time  $t_2^\ast $. In Cases A and B, SDCP and HCMP can accurately predict DSV initiation, and the position of the maximum value of these two indicators coincides with that of the LESP. Case C is a low-Reynolds-number case, and the maximum positions of the SDCP, HCMP and LESP are slightly later than
 $t_2^\ast $. This is because the same criterion is used to identify the initiation of DSV in all of the cases in database N. This standard is more suitable for high-Reynolds-number cases, but there is a slight deviation in low-Reynolds-number cases.
Validation in SDCP and HCMP with time in (a) Case A, (b) Case B, (c) Case C and (d) Case D.

Case D is a quasi-steady case with a small K, and the DSV is not observed in this case. Although the DSV is not formed in a quasi-steady case, there is still a concentration of the leading-edge negative pressure before massive flow separation occurs. Once the flow separation develops to the leading edge, the negative peak pressure also collapses rapidly. Therefore, the flow around the airfoil also has a critical moment. At this moment, the three indicators LESP, SDCP and HCMP reach their maximum values, as shown in figure 30(d). The coincidence of their maximum positions is another proof of these three indicators’ consistency and internal relationship. However, according to more observations of the cases in database N, the indicators in the quasi-steady cases still have a significant feature different from those in the dynamic stall case, that is, smaller values. The maximum values of LESP, SDCP and HCMP in a quasi-steady case are always less than their critical values at  $t_2^\ast $ in a dynamic stall case with the same conditions. This shows that if and only if the critical value of the LESP, SDCP and HCMP is exceeded will the DSV be formed. This further confirms the correctness of these three indicators as the criterion of DSV initiation.
In addition to Cases A, B, C and D, SDCP and HCMP are also found to be applicable to other cases in database N. As database N is available at https://doi.org/10.1017/jfm.2020.467 and the detailed definitions of SDCP and HCMP have been given in this study, interested readers can carry out a verification.