Implications
The use of genomic data to evaluate selection signals in livestock may provide new and precise insights about the effects of natural or artificial selection for adaptive traits. In our study, chickens that acquired favorable fitness traits in tropical environment had a reduction in the variability of genomic regions associated with survival. Through the study of runs of homozygosity, that are regions of the genome where the copies inherited from parents are identical, it was possible to identify candidate genes that might be helping the adaptation and resistance to heat stress in tropical environments, and those related to production traits under selection in this paternal broiler line.
Introduction
The poultry industry is one of the main chains responsible for animal protein production (meat and eggs) for human consumption (OECD-FAO, 2015). The increased consumer demand has forced the poultry industry to develop methods to increase their production output, offering chicken meat at competitive prices in the worldwide market. With the intensification of selection to obtain more productive genotypes for economic traits, the modern broiler chickens have experienced notable phenotypic and genetic changes (Rubin et al., Reference Mujahid, Yoshiki, Akiba and Toyomizu2010). In addition, the challenging environments of the production system have also contributed for shaping the genome of these chickens by having them to adapt to the newly imposed conditions (Badyaev, Reference Badyaev2005).
Chicken raised in tropical regions suffer from heat stress effects because the temperatures are high in the whole year. Besides that, these effects are intensified due to the high density of broilers used in current production systems (Türkyilmaz, Reference Türkyilmaz2008). Biochemical and physiological events associated with hyperthermia can potentially promote reactive oxygen species (ROS) formation, disruption of internal energy balance, lipid peroxidation and, consequently, immunosuppression (Pamok et al., Reference Pamok, Aengwanich and Komutrin2009). It has been observed that elevated environmental temperatures affect the development of a specific immune response in chickens. Quinteiro-Filho et al. (Reference Quinteiro-Filho, Ribeiro, Ferraz-de-Paula, Pinheiro, Sakai, Sá, Ferreira and Palermo-Neto2010) reported that heat stress activates the chicken hypothalamic–pituitary–adrenal axis, increasing corticosterone serum levels and, consequently, influencing the quality of the intestinal-immune barrier, thereby allowing pathogenic bacteria to migrate through the intestinal mucosa generating inflammatory infiltrate. Therefore, the conditions imposed by the environmental changes that chickens have undergone in their evolutionary course will define their response to adaptation (Badyaev, Reference Badyaev2005).
The constant selective pressure for one specific trait can lead to the reduction in the variability around the genomic regions associated with this trait. Therefore, the identification of those regions may allow a better understanding about their biological importance. In broilers, the presence of genomic signatures related to selective pressure has been extensively studied, and several methods have been used to identify these segments under selection, such as Z-transformed heterozygosity and cross-population extended haplotype homozygosity, which measures the reduction in diversity of a genomic region (Fu et al., Reference Fu, Lee and Abasht2016).
A potential alternative to detect signatures of selection for complex traits is the identification of long stretches of consecutive homozygous genotypes in the genome, also known as runs of homozygosity (ROH) (Fleming et al., Reference Fleming, Koltes, Markey, Schmidt, Ashwell, Rothschild, Persia, Reecy and Lamont2016). The presence of ROH can provide useful information about the population selection history, as well as enable a better understanding of genotype–phenotype relationships through the discovery of genes or genomic regions that are or have been under selective pressure (Zhang et al., Reference Zhang, Guldbrandtsen, Bosse, Lund and Sahana2015). Recently, ROH extracted from single nucleotide polymorphism (SNP) arrays have been used to study the population history of chickens. Fleming et al. (Reference Fleming, Koltes, Markey, Schmidt, Ashwell, Rothschild, Persia, Reecy and Lamont2016), working with Ugandan and Rwandan chicken ecotypes, showed that these populations have alleles under selective pressure from their environment, which may aid in adaptation to harsh environments.
Increased homozygous levels are associated with a reduction in effective population size (N e ), which is a measure of diversity within a population that allows the estimation of the rate of inbreeding per generation and the loss of genetic variation (Zhu et al., Reference Zhu, Zhu, Wang, Wu, Xu, Guo, Yuan, Zhang, Gao, Gao, Xu and Li2013). It is already well established that high-density SNP panels aid estimates of population parameters, such as N e , intergenerational inbreeding, and linkage disequilibrium (LD) between loci within a population. Molecular approaches based on ROH and SNPs may help to avoid several disadvantages of using pedigrees to analyze inbreeding. Hence, the present study was undertaken to identify conserved regions based on ROH using genomic data to investigate their relationship with functional variants in a paternal broiler line.
Material and methods
Chicken population
The chickens used in this study were a sample composed by five hatches from a paternal broiler line called TT, made in 2007, to represent the whole TT line. This line was developed by the Embrapa Swine and Poultry National Research Center, in Concordia, Santa Catarina State – South of Brazil. The TT pure line has been maintained under multi-trait selection, in open sided poultry houses, since 1992. In 1991, the TT founder population size was 89 sires pen-mated to 10 dams each. From 1992 to 1996, 50 sires were pen-mated to 10 dams each every year, to produce the next generations. In 1997, the selected sires were 31, and each mated to five dams. In the year 2000, there were 25 sires mating five dams each, being the population structure used to date.
The main traits under selection in TT pure line are body weight (BW) feed conversion, breast size (mass selection), carcass and cuts yield, abdominal fat (indirect selection based on non-selected sibs), fertility, hatchability of fertile eggs and chick viability (independent culling levels). The TT performance level in 1992, as hatched average weight at 35 days of age was 1435 g, and individual feed conversion rate (FCR), from 36 to 42 days of age, of the 300 mass selected males was 2.397. In 2007, as hatched average weight at 42 days of age was 2457 g, and individual FCR from 43 to 49 days of age was 2.798. Note that the age of selection for BW has changed from 35 to 42 days of age in the described period, as well as the FCR evaluation period, which has changed from 36 to 42 days since 1992 to 43 to 49 days of age in 2007.
The sample used in this study was called ‘TT Reference Population’, because it was developed for genomic studies and had about 92 traits measured and evaluated in ~1400 individuals, which were all slaughtered in 2008. Details on this population can be found in Ledur et al. (Reference Ledur, Peixoto, Nones and Coutinho2012) and Fornari et al. (Reference Fornari, Zanella, Ibelli, Fernandes, Cantão, Thomaz-Soccol, Ledur and Peixoto2014). In brief, one sire from each sire family (25) and one dam from each dam family (125) were chosen to generate the TT Reference Population. Matings between close relatives were avoided, and conducted in a proportion of one male to five females to produce about 1600-day-old chicks of both sexes in five hatches. The TT Reference Population founders that had their offspring genotyped represented 20 from the original 25 sires, and 93 from the original 125 dams. The complete and accurate genealogy is available since the foundation of the TT line, totaling 2007 pedigree records distributed in 17 generations. Although the average hottest temperature was 35.0°C in December and the coolest 0.2°C in July from 1992 to 2008, the temperatures are highly variable in this region, and the extremes of the temperature in this period ranged from −3.6°C to 37.5°C (Agrometeorological Station of the Embrapa Swine and Poultry National Research Center).
Genotyping data
Blood samples from 1430 chickens (652 males and 778 females) were collected, of which 113 (20 sires and 93 dams) are the progenitors (born in 2007) and the remaining are full- and half-siblings (born in 2008). The extraction of the genomic DNA was performed using PureLink® Genomic DNA (Invitrogen, Carlsbad, CA, USA) kit. The extracted DNA was quantified using a Qubit® 2.0 Fluorometer (Thermo Fisher Scientific, Waltham, MA, USA) and diluted to a concentration of ~10 ng/ul. Samples were genotyped using the 600 K Affymetrix® Axiom® high-density (HD) genotyping array at the ‘Centro de Genomica Funcional, ESALQ’, University of São Paulo, Brazil.
The genotypes were initially read and edited with the AxiomTM Analysis Suite (Affymetrix®) software using a DishQC removal value of 0.82. The SNPs quality control was performed in PLINK v.1.9 (http://pngu.mgh.harvard.edu/purcell/plink/) excluding SNPs with call rate lower than 98%, significant deviations (P<10−6) from the Hardy–Weinberg equilibrium (HWE), and minor allele frequency (MAF) lower than 2%. Samples presenting call rate lower than 90% were also excluded. For the analysis, only the SNPs with positions attributed to autosomal chromosomes (based on the Gallus gallus v. 4.0 genome reference) were considered.
Linkage disequilibrium and effective population size
The LD estimates were performed with PLINK v.1.9, using the r
2 calculated between marker pairs separated by <5 Mb on each chromosome, as described by Hill and Robertson (Reference Hill and Robertson1968), with the equation
 $r^{2} \,{\equals}\,{{D^{2} } \over {f(A)f(a)f(B)f(b)}}$
, in which f(A), f(a), f(B) and f(b) are the respective frequencies of alleles A, a, B and b, and
 $D{\equals}f\left( {AB} \right){\minus}f\left( A \right)f\left( B \right)$
.
The LD was estimated separately for each category of the avian chromosomes: macrochromosomes (GGA1 to 5), intermediate chromosomes (GGA6 to 10) and microchromosomes (GGA11 to 38), according to the chromosome size classification of the International Chicken Genome Sequencing Consortium (2004). To visualize the pattern for each category of LD, the r 2 values between all pairs of SNPs within each chromosome group were arranged in ascending order, grouped according to their pairwise physical distance in classes of 50 Kb, started from 0 to 5000 Kb, and then the mean was calculated for all of these classes and plotted using the R software (https://www.r-project.org/).
The effective population size (N
e
) for different periods of the population history were estimated with the SNP1101 package (Sargolzaei, Reference Sargolzaei2014), based on the expectation of r
2
in different distances, with the equation described by Sved (Reference Sved1971):
 $N_{e} \,{\equals}\,\left[ {\left( {{1 \over {E\left( {r^{2} } \right)}}} \right){\minus}1} \right]{\times}{1 \over {4c}}$
, where c is the distance between two SNPs, in Morgans, estimated for each chromosome in the LD analysis. The E(r
2) is the expected r
2
at distance c, calculated as
 $N\left( {r^{2} } \right)\,{\equals}\,{1 \over {1{\plus}4N_{e} c}}$
. Each genetic distance (c) corresponds to a value of t generations in the past calculated as
 $t\,{\equals}\,{1 \over {2{\rm c}}}$
(Hayes et al., Reference Hayes, Visscher, Mcpartlan and Goddard2003). The N
e
was investigated in 6 points: 5, 10, 20, 50, 100 and 200 generations ago.
Runs of homozygosity analysis
The ROH were identified using PLINK v.1.9, and calculated for each individual. For the ROH analysis, segments with at least 100 SNPs with a minimum length of 1000 Kb, density of 1 SNP/50 Kb, accepting the presence of one heterozygous SNP, the absence of one SNP in a window of 100 SNPs, and allowed one gap within the 1000 Kb were considered. The population ROH frequency was calculated using all identified ROH. The search for shared ROH, which are consensus regions among individuals, was made by looking for how many individuals had a ROH with at least the same start and end positions. Those overlapped homozygous regions were grouped and called shared ROH, which were identified using a Perl homemade script.
Functional analyses of runs of homozygosity
Genes located within shared ROH regions present in more than 1% of the population were searched using the UCSC genome browser (Galgal 4) and used in the enrichment analysis. This threshold was chosen based on the assumption that ROH occurring in more than 1% of the population has less probability of being randomly assigned. Gene ontology (GO) enrichment analysis was performed using David 6.8 database (https://david.ncifcrf.gov/home.jsp) and the results were considered statistically significant if the false discovery rate (FDR) was lower than 0.20. The REVIGO software (http://revigo.irb.hr/) was used for visualization and removal of redundant terms of the GO enrichment results. A gene network of predicted functional proteins was constructed using the STRING 10.0 software (http://string-db.org/).
Inbreeding estimates based on genomic and pedigree data
Different analyses were performed to estimate the inbreeding coefficient using genomic and pedigree data. The genealogical inbreeding coefficient (F PED) was estimated using the ENDOG v4.8 software (http://pendientedemigracion.ucm.es/info/ prodanim/html/JP_Web.htm) considering all pedigree information that had been recorded since the foundation of the population. To estimate individual genomic inbreeding coefficients using the ROH data (F ROH), the length of the genome covered by ROH was divided by the total chicken autosomal genome length covered by the SNP array (931 280 Kb, Gallus gallus v. 4.0 NCBI, June 2016), as described by Ferencakovic et al. (Reference Ferencakovic, Hamzic, Gredler, Solberg, Klemetsdal, Curik and Sölkner2012). The genomic SNP-by-SNP inbreeding coefficient (F SNP) for each individual i (F SNP(i)) was obtained based on the excess of SNP homozygosity, and calculated as F SNP (i) = (OH i − EH)2/(EH), where OH is the observed number of homozygotes and EH is the expected number of homozygotes. The inbreeding coefficients obtained by the three methods were compared using Pearson’s correlation.
Declaration of ethics in the use of animals
This study was conducted with the approval of the Ethics Committee for Animal Use (CEUA) from the Embrapa Swine and Poultry National Research Center under the protocol no. 011/2010.
Results
In the quality control, 70 552 SNPs failed in the call rate, 121 199 failed the MAF criteria, 13 434 were excluded based on HWE test and 20 256 were present on chromosomes not included in the analysis: 15 305 in the sex chromosomes, 160 in the linkage groups and 4791 in undefined positions, remaining 355 520 SNPs for the analyses (Supplementary Table S1).
Linkage disequilibrium and effective population size
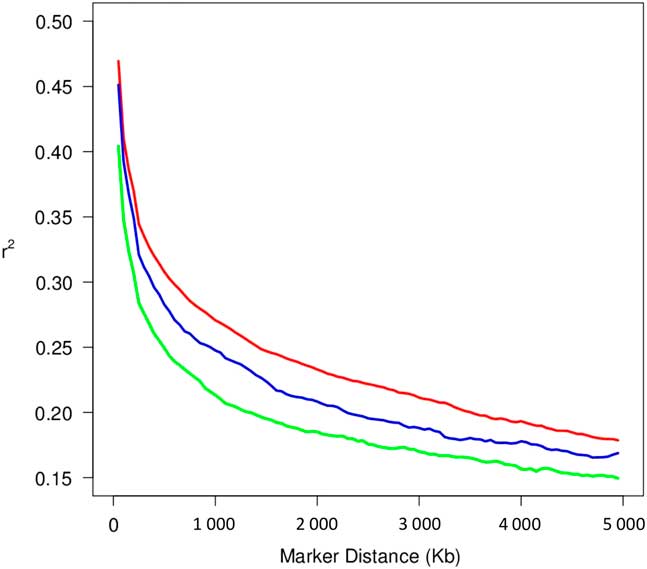
The LD declined as the distance between markers increased in all chromosome groups as shown in Figure 1. The mean r 2 converged to 0.30 approximately at 500 to 550 Kb in macro, 350 to 400 Kb in intermediate and 150 to 200 Kb in microchromosomes. The average LD between adjacent SNPs in all autosomes was 0.37 and micro, intermediate and macrochromosomes presented the lowest, second lowest and highest mean r 2, respectively.
Decay of average pairwise linkage disequilibrium (r 2) over the distance between single nucleotide polymorphisms (SNPs) in the different chromosome size classes (macrochromosomes in red, intermediated chromosomes in blue and microchromosomes in green) in a paternal broiler line.

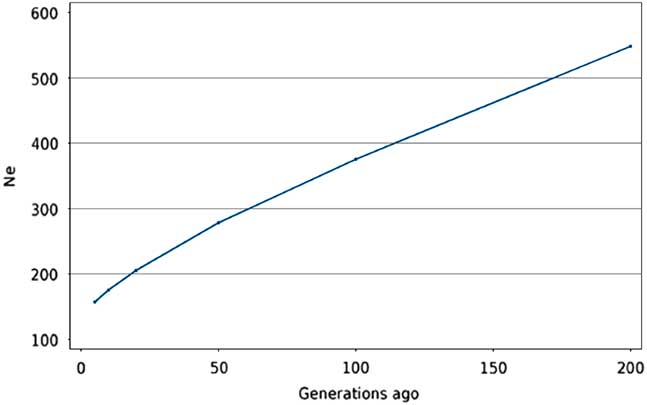
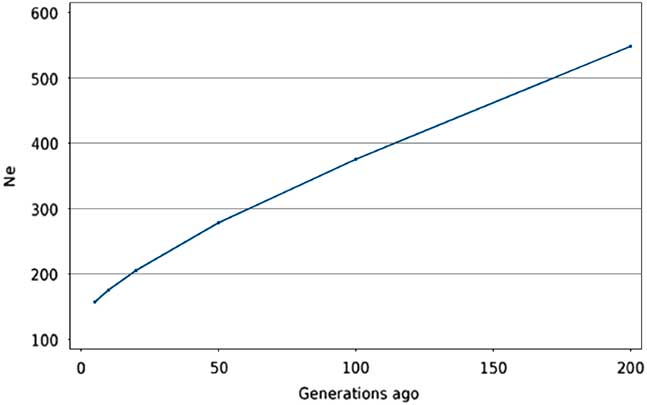
The N e obtained in our study was estimated from five to 200 generations ago (Figure 2). The decay observed in Figure 2 indicates that the N e of the ancestral population based on 200 past generations was much larger, with 548 individuals, compared with the most current generations. In the last five generations, N e ranged from 113 (current population) to 157 chickens.
Estimated effective population size (N e ) over time in a paternal broiler line.
Inbreeding coefficient estimates
The average, minimum and maximum inbreeding coefficients based on pedigree records (F PED) were equal to 0.0423, 0.00 and 0.0981, respectively. Based on ROH observations (F ROH), the average, minimum and maximum inbreeding coefficients were 0.0739, 0.00 and 0.2136, respectively. The estimates of inbreeding coefficient obtained using the SNP-by-SNP (F SNP) method ranged from −0.1669 to 0.1394 with an average of −0.0185. The F SNP sometimes can be negative, when EH is higher than OH i .
The correlation between F ROH and F SNP was moderately high (0.63), however, the correlation between F PED with F ROH and F SNP were low (0.06 and 0.05, respectively).
Runs of homozygosity
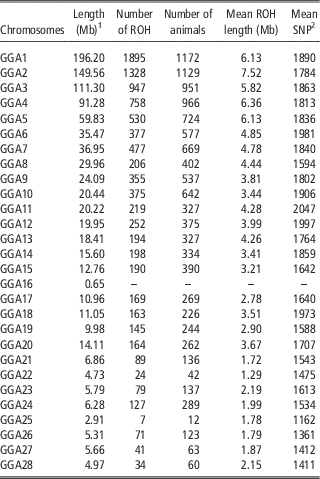
A total of 1279 chickens presented ROH segments with an average of 12.87 ROH per animal and a maximum number of 30 ROH. The average length and the longest ROH were 5.34 and 59.24 Mb, respectively. The macrochromosomes had the highest number of shared ROH among chickens and the largest mean ROH length. Among them, the chromosome GGA1 presented the highest number of shared ROH (1895) in the largest number of animals in the population (1172), whereas GGA2 presented the largest mean ROH length (7.52 Mb). The chromosome GGA16 did not present any ROH segment according to the parameters used (Table 1). The average amount of the genome covered by ROH in the studied population was 7.22% per individual, ranging from 1% to 20.87%.
Summary of runs of homozygosity (ROH) by chromosome in a broiler population

SNP=single nucleotide polymorphism.
1 Chromosome length.
2 Mean SNP per ROH.
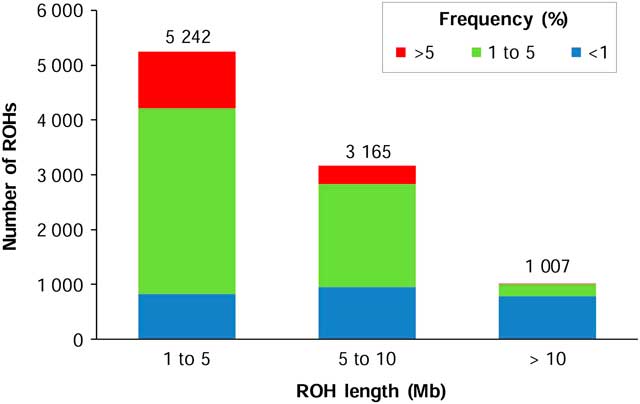
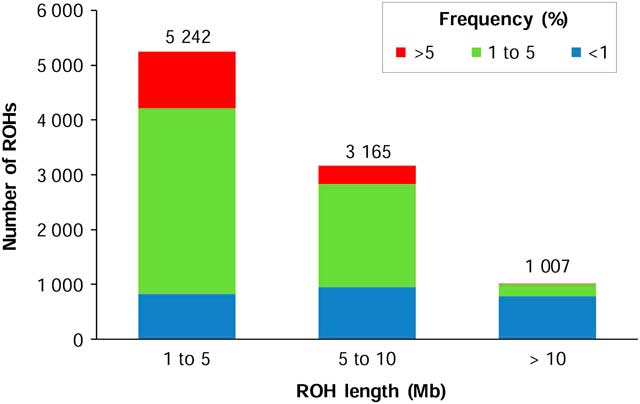
The total number of homozygous segments was 9414, of which 6843 were observed in more than 1% of the population. Most of the identified ROH presented a small size (1 to 5 Mb), with the great majority of the segments (~64%) with frequency between 1% and 5% in the population. Segments with size between 5 and 10 Mb were the second most abundant and presented the highest number of ROH in more than 1% of the population (Figure 3). A ROH of 11.72 Mb located on GGA2 (77 084 081 to 88 808 596 bp) was the largest segment, with a frequency of ~5% in the population. The most frequent shared segment (~28%) identified with 5.21 Mb of length was also located in GGA2 (69 807 237 to 75 014 591 bp). This ROH contains 12 genes of which seven are novel genes, one is a microRNA (gga-mir-6545) and the others are from the cadherin superfamily: cadherin 9 (CDH9), cadherin 10 (CDH10), cadherin 12 (CDH12) and cadherin 18 (CDH18).
Distribution of runs of homozygosity (ROH) identified by length and frequency class in a paternal broiler line.
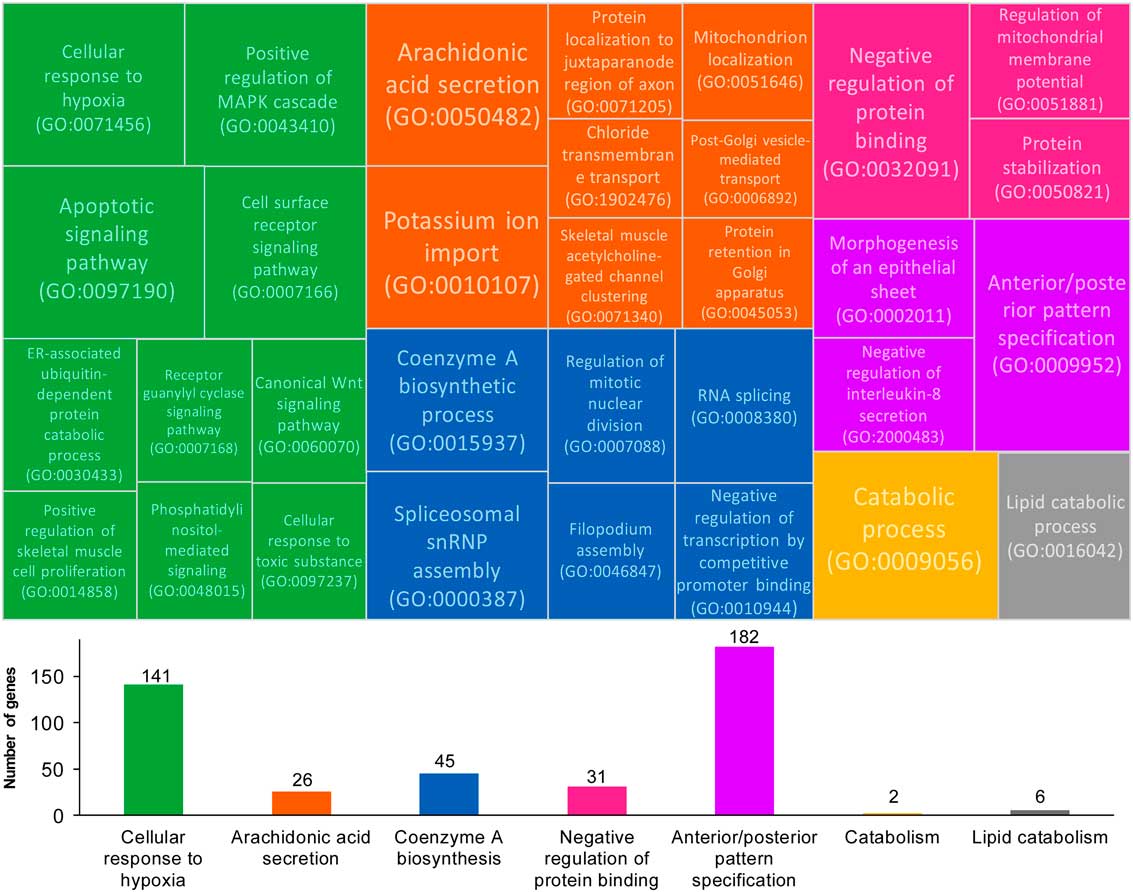
A gene list with 756 genes identified in the ROH regions was analyzed using the GO enrichment analysis. A total of 72 GO-terms was enriched with biological processes (FDR lower than 0.20; Supplementary Material S1), and filtered for redundancy of terms, producing a list of significant GO-terms related to selective pressure for environmental stressors, morphological pattern and immunity (Figure 4). The most relevant GO-terms related to environmental stressors were: cell surface receptor signaling pathway (GO:0007166), positive regulation of Mitogen-Activated Protein Kinases (MAPK) cascade (GO:0043410), cellular response to hypoxia (GO:0071456), canonical Wnt signaling pathway (GO:0060070) and cellular response to toxic substance (GO:0097237), all grouped into the most significant supercluster cellular response to hypoxia (Figure 4).
‘Treemap’ of biological processes based on Gene Ontology terms statistically significant (false discovery rate<0.20) for genes identified in shared runs of homozygosity (ROH) in the broiler population. Each rectangle is a single cluster representative. The representatives are joined into ‘superclusters’ of related terms, visualized with different colors.

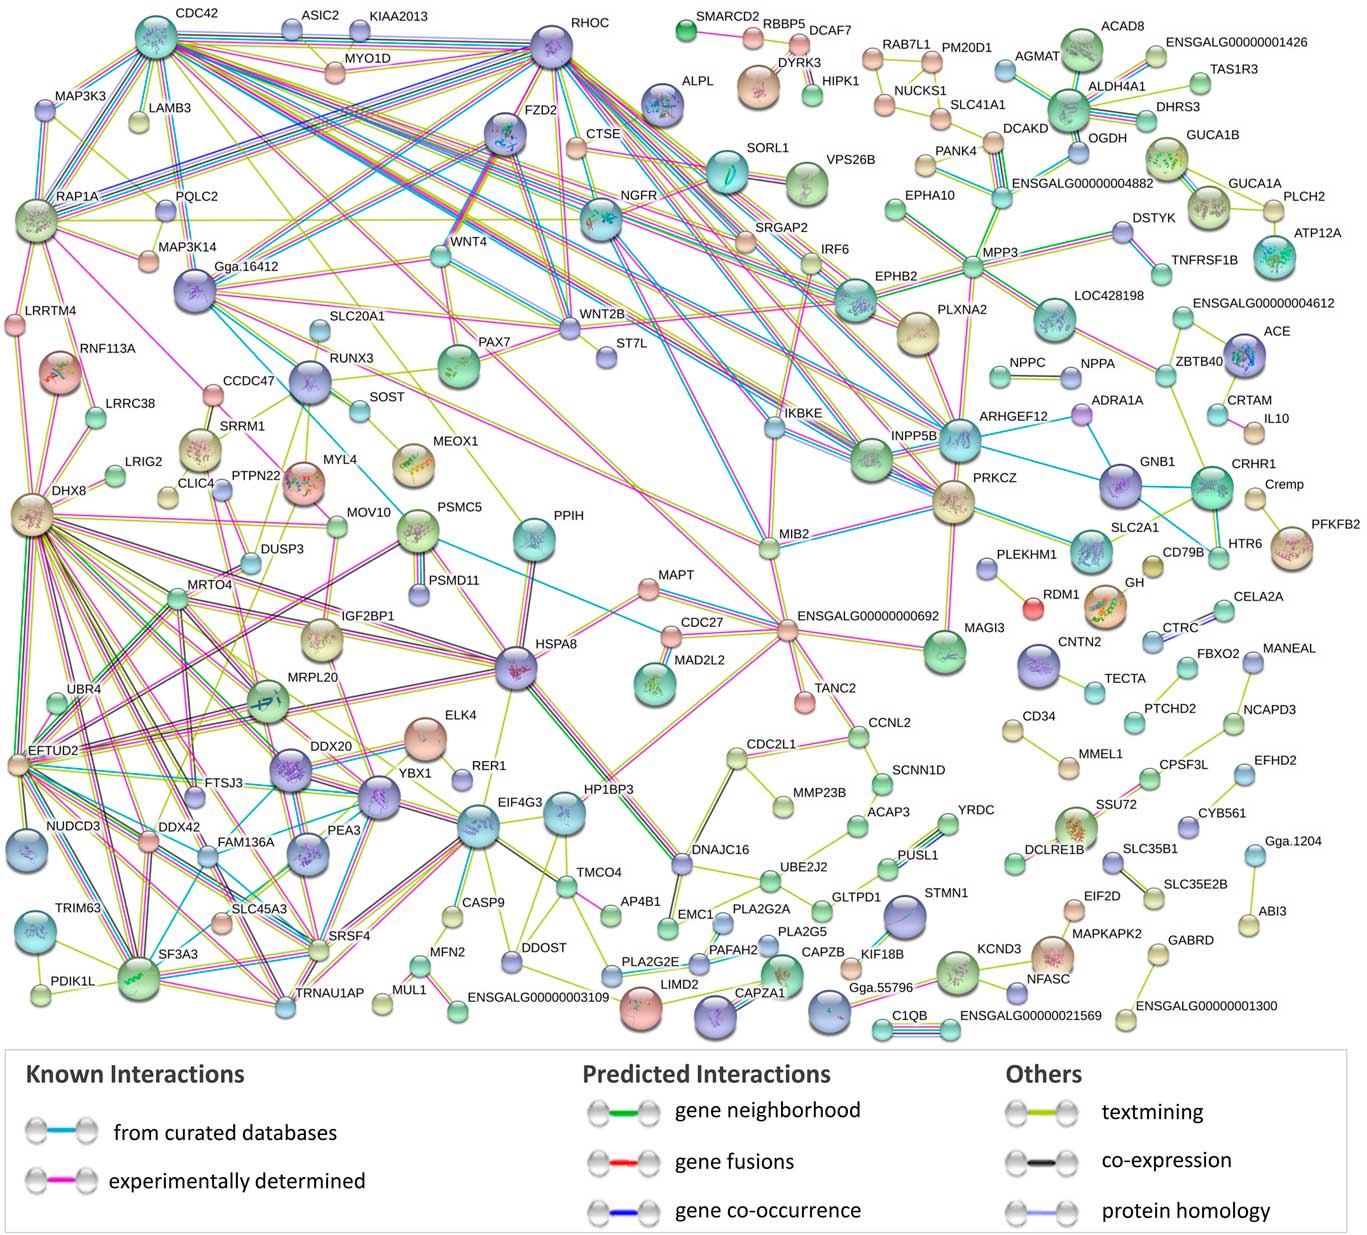
The gene network showed some main interaction nodes grouped by important genes, such as the cell division cycle 42 (CDC42), RAP1A, member of RAS oncogene family (RAP1A), ras homolog family member C (RHOC) and elongation factor Tu GTP binding domain containing 2 (EFTUD2), interacting with several other genes identified in the ROH (Figure 5). Since many interactions were found with these genes, it could be an indication that their variants are possibly involved in important biological processes related to survival traits in this selected population.
Network of predicted functional proteins for the genes located within runs of homozygosity identified in the broiler population created using STRING. The lines represent the predicted interactions between genes.

Discussion
The effects of LD are important to understand the variations in the genome, particularly when selection is being carried out (Bosse et al., Reference Bosse, Megens, Madsen, Paudel, Frantz, Schook, Crooijmans and Groenen2012). In our study, the extension of the LD related to the physical distance between markers was smaller in microchromosomes than in macrochromosomes and in intermediate chromosomes (Figure 1), which is in accordance with the results obtained by other authors (Qanbari et al., Reference Qanbari, Hansen, Weigend, Preisinger and Simianer2010; Fu et al., Reference Fu, Dekkers, Lee and Abasht2015). According to the International Chicken Genome Sequencing Consortium (2004) the difference among the extension of the LD in these chromosome classes occurs because the microchromosomes present higher recombination rates (6.4 cM/Mb), followed by the intermediate chromosomes (3.9 cM/Mb), and the macrochromosomes (2.8 cM/Mb). The average LD found in the current study between adjacent markers in all autosomes (0.37) was comparable with that found by Fu et al. (Reference Fu, Dekkers, Lee and Abasht2015) in pure lines (from 0.34 to 0.40). When purebred and crossbred commercial broiler lines were compared, the extent and consistency of LD for short distances between markers (0 to 10 Kb) were remarkably high, but the crossbred lines had a considerably lower level of LD than the purebred lines (Fu et al., Reference Fu, Dekkers, Lee and Abasht2015).
In this study, the LD was used to estimate N e instead of the homozygosity of individual markers, because it has the advantage of using the recombination rate, which is more controllable than the mutation rate (Hayes et al., Reference Hayes, Visscher, Mcpartlan and Goddard2003). As a result, the latest N e can be estimated because the recombination rates are much higher than mutation rates (Hayes et al., Reference Hayes, Visscher, Mcpartlan and Goddard2003). The N e estimates were substantially higher than those reported by Andreescu et al. (Reference Andreescu, Avendano, Brown, Hassen, Lamont and Dekkers2007) in broiler (from 50 to 200) and by Qanbari et al. (Reference Qanbari, Hansen, Weigend, Preisinger and Simianer2010) in egg-laying chicken lines, which confirms the larger N e estimates for broiler than for layer lines observed by Muir et al. (Reference Muir, Wong, Zhang, Wang, Groenen, Crooijmans, Megens, Zhang, Okimoto, Vereijken, Jungerius, Albers, Lawley, Delany, MacEachern and Cheng2008). The N e estimated in our study for the last five generations was 157 animals (Figure 2). Qanbari et al. (Reference Qanbari, Hansen, Weigend, Preisinger and Simianer2010) found <70 and 50 individuals for brown and white layers, respectively, in five generations ago and pointed out the existence of low inbreeding coefficients in the population. According to these authors, both lines studied, whether commercial or experimental, showed clear evidence of N e decay over the generations. In our study, the latest generation (parental generation) presented N e of 113 animals, which is higher than the recommended by the Food and Agriculture Organization of the United Nations (2004) for conservation purpose, of a minimum of 50 individuals for any livestock species.
In the studied population, the inbreeding coefficient was low in the three methodologies used, evidencing that the matings were well controlled to avoid inbreeding. The low correlation between inbreeding estimates based on pedigree and genomic data is expected for several reasons. According to Ferencakovic et al. (Reference Ferencakovic, Hamzic, Gredler, Solberg, Klemetsdal, Curik and Sölkner2012), F PED methodology does not consider the stochastic nature of recombination and fails to capture the influence of relatedness among founders from the base population. Furthermore, F PED describes IBD status with respect to a rather poorly defined founder generation considered to be unrelated. For example, the estimated human inbreeding from ROH data (F ROH) resulting from the mating of first cousins would be 0.0625, with a SD of 0.0243, whereas the average F PED from the same parents is always the same (0.0625) (Carothers et al., Reference Carothers, Rudan, Kolcic, Polasek, Hayward, Wright, Campbell, Teague, Hastie and Weber2006). This variance increases with each meiosis, and it is even possible for offspring of third cousins to be more autozygous than offspring of second cousins (McQuillan et al., Reference McQuillan, Leutenegger, Abdel-Rahman, Franklin, Pericic, Barac-Lauc, Smolej-Narancic, Janicijevic, Polasek, Tenesa, MacLeod, Farrington, Rudan, Hayward, Vitart, Rudan, Wild, Dunlop, Wright, Campbell and Wilson2008). Also, F PED assumes that the entire genome is selection-neutral and does not account for potential bias resulting from selection (Curik et al., Reference Curik, Sölkner and Stipic2002). The TT line has been under multi-trait selection since 1992, explaining part of the low correlation found between F PED and F ROH in this study (0.06). Although matings among close relatives are avoided, some degree of inbreeding is generated, since TT is a closed population. Low correlation between F PED and F ROH were also observed in several species, as discussed by Zanella et al. (Reference Zanella, Peixoto, Cardoso, Cardoso, Biegelmeyer, Cantao, Otaviano, Freitas, Caetano and Ledur2016), who also found this correlation to be low, of 0.015, for Large White pigs. Therefore, the use of F ROH becomes more efficient in the detection of the real percentage of the genome that is IBD than traditional methodologies.
Regarding ROH, a significant correlation between the sharing of ROH and regions putatively under selection suggests that some shared ROH are the result of a combination of inbreeding and selection (Zhang et al., Reference Zhang, Guldbrandtsen, Bosse, Lund and Sahana2015). In addition, it is possible that ROH carry genes or variants under positive selection (Bosse et al., Reference Bosse, Megens, Madsen, Paudel, Frantz, Schook, Crooijmans and Groenen2012). In this study, the most representative supercluster identified by the GO-terms enrichment was related to response to hypoxia (Figure 4), which is intimately related to oxidative stress. This indicates that the individuals in the analyzed population have possibly experienced selective pressure on their genomes to events that are necessary to deal with oxidative stress, such as selection for rapid growth rate and adaptation. In the last decades, the intense selection for heavier and faster growing broilers, and the intensification of the production system have increased the metabolism of fast-growing chickens; as consequence, metabolic disorders became a worldwide concern. These metabolic problems affect primarily the cardiovascular and skeletal muscle systems, causing more economic losses than infectious agents (Julian, Reference Julian2005). The increase in metabolic disorders, such as heart failure syndrome, ascites and lungs and heart edemas can be directly related to an insufficient oxygen supply (Scheele, Reference Scheele1997).
In response to heat stress, several physiological and biochemical events have the potential to promote ROS in the cell, especially in the mitochondria (Mujahid et al., Reference Mujahid, Sato, Akiba and Toyomizu2006). High levels of these molecules result in the disturbance of balance between oxidation and antioxidant defense systems, causing lipid peroxidation and oxidative damages to proteins and DNA (Lin et al., Reference Lin, Decuypere and Buyse2006). In the enrichment analysis, several GO-terms related to CoA biosynthesis were identified (Figure 4). This enzyme helps to transfer fatty acids from the cytoplasm to mitochondria. The arachidonic acid secretion supercluster was also well represented in the enrichment analysis (Figure 4). This molecule is abundant in the brain, muscles and liver, and previous studies have demonstrated that the mobilization of arachidonic acid occurs in response to oxidative stress and is profoundly different from one cell to another (Balboa and Balsinde, Reference Balboa and Balsinde2006). The GO-term Positive regulation of MAPK cascade (GO:0043410) was also enriched in our study. The activation of different members of the MAPK is involved in directing cellular responses to a diverse array of stimuli, as the response to heat stress (Gorostizaga et al., Reference Gorostizaga, Brion, Maloberti, Paz, Maciel, Podestá and Paz2005). The identification of several genes related to these processes may indicate that associated genetic variants have undergone a positive selection for greater efficiency in maintaining cellular homeostasis. Fleming et al. (Reference Fleming, Koltes, Markey, Schmidt, Ashwell, Rothschild, Persia, Reecy and Lamont2016), studying Ugandan and Rwandan chicken ecotypes, identified genes in ROH and selection signature regions related to kinases, calcium activity and oxidative stress responses, and related these to selective pressure on genes involved in mechanisms used by chickens to tolerate the effects of a challenging environment. Some of the genes identified by Fleming et al. (Reference Fleming, Koltes, Markey, Schmidt, Ashwell, Rothschild, Persia, Reecy and Lamont2016) were also present in the ROH regions found in our population, such as the dispatched RND transporter family member 3 (DISP3) and syntaxin 12 (STX12) genes.
Mujahid et al. (2005) have suggested that oxidative stress resulting from exposure to heat can lead to cytotoxicity and the generated ROS have been demonstrated to be mediators of cellular injury. Anwar et al. (Reference Anwar, Khan, Aslam, Maqbool and Khan2008) reported that broilers under heat stress had the relative weight of their major immunological organs, such as spleen, thymus and bursa of Fabricius, decreased. Aengwanich (Reference Aengwanich2008) also found that the Bursa of Fabricius in heat-stressed broilers was atrophied when examined under histopathological observation. The Bursa of Fabricius is an important oval-like shaped gland located at the proctodaeal region of the cloaca in chickens, and is known to be a primary lymphoid organ where immunologically competent cells are produced, whereas it is also a secondary or peripheral lymphoid organ which produces antibodies (Tsuji and Miypshi, Reference Tsuji and Miypshi2001).
In this study, GO-terms as negative regulation of interleukin-8 secretion (GO: 2000483), associated with the immune system, were identified (Figure 4). Several genes involved in immune system processes have also been identified in the network analysis (Figure 5). One of the genes with the highest number of predicted interactions is the CDC42, reported as critical for interstitial dendritic cell migration during immune responses (Harada et al., Reference Harada, Tanaka, Terasawa, Pieczyk, Habiro, Katakai, Hanawa-Suetsugu, Kukimoto-Niino, Nishizaki, Shirouzu, Duan, Uruno, Nishikimi, Sanematsu, Yokoyama, Stein and Kinashi2012), and overexpressed in chicken macrophages infected with Salmonella enterica (Zhang et al., Reference Zhang, Lillehoj, Kim, Keeler, Babu and Zhang2008). Other genes related to immune response are the RAP1A, which positively regulates T cells via integrin activation (Sebzda et al., Reference Sebzda, Bracke, Tugal, Hogg and Cantrell2002), and the gene EFTUD2, that controls the alternate splicing of the myeloid differentiation primary response 88 (MyD88) innate immunity signaling adaptor to modulate the extent of the innate immune response (Arras et al., Reference Arras, Laws, Leach, Pontis, Freedman, Schwartz and Alper2014).
Another gene with a great number of predicted interactions and that interacts with the CDC42 and RAP1A genes (Figure 5) is the RHOC, which is important in protrusion formation in migrating cells, and was also identified as acting in the response to heat stress in a chicken hepatocellular carcinoma cell line (Sun et al., Reference Sun, Lamont, Cooksey, Mccarthy, Tudor, Derita, Rothschild, Ashwell, Persia and Schmidt2015). Other 31 genes located in the ROH regions in our population (Supplementary Table S2) were also identified by Sun et al. (Reference Sun, Lamont, Cooksey, Mccarthy, Tudor, Derita, Rothschild, Ashwell, Persia and Schmidt2015) as differentially expressed in their transcriptome analysis in response to heat stress in chicken hepatocellular carcinoma cell line. Out of those, the solute carrier family 39 member 6, BCL2 associated athanogene 1, NOP2/Sun RNA methyltransferase family member 2, molybdenum cofactor sulfurase and elongator acetyltransferase complex subunit 2 are located within the longest ROH identified in our population (GGA2: 77 084 081 to 88 808 596 bp). These results reinforce the hypothesis that the ancestors of the studied population had to adapt to the high environmental temperatures.
In the most frequent ROH of the studied population (GGA2: 69 807 237 to 75 014 591 bp), four coding genes of the Cadherin protein family, the CDH9, CDH10, CDH12 and CDH18, involved in the skeletal muscle differentiation were identified (Donalies et al., Reference Donalies, Cramer, Ringwald and Starzinski-Powitz1991). In special, the CDH12 gene was associated with heat stress in chicken cell lines (Sun et al., Reference Sun, Lamont, Cooksey, Mccarthy, Tudor, Derita, Rothschild, Ashwell, Persia and Schmidt2015). Several quantitative trait loci (QTL) related to production traits curated in the Chicken QTL database have already been reported in this ROH segment. The most important traits were breast muscle weight (QTL: 1904), BW at 42 days of age (QTL: 6899) and troponin T concentration (QTL: 1906). Probably, the candidate genes observed in this frequent ROH region are involved with breast and BW, which are important selection criteria applied in our population. Figueiredo et al. (Reference Figueiredo, Rosa, Scheuermann, Jaenisch, Schmidt, Ledur, Brentano and Costa2003), evaluating the genetic gain of the TT population during 15 generations of selection, found an improvement in BW of 758 g and in average breast area of 31.95 cm2. In summary, the results showed that the genome of this broiler line had undergone a strong homogenizing effect at loci related to important production traits under selection, and possibly improving their adaptability to survive in new breeding environments.
Conclusion
The use of ROH to evaluate selective pressure in chicken populations can provide new insights into the population history and the discovery of genomic regions and candidate genes involved in the expression of adaptive and production traits. It can be highlighted that this chicken population may have had to adapt to survive in environments with high temperatures, usually found in the tropics, and intensified by the high density of broilers in breeding facilities. This adaptation led to the homozygosity of genomic regions that harbor genes involved in the maintenance of homeostasis and the immune system, favoring the tolerance in this type of environment. Also, the conserved regions identified based on ROH are possibly related to the production traits under selection in this paternal broiler line.
Acknowledgments
The authors are grateful to Alexandre L. Tessmann for technical assistance. This study was supported by the Brazilian Agricultural Research Corporation – Embrapa (project no. 01.11.07.002.04.02), by the thematic project (2014/08704-0) from São Paulo Research Foundation (FAPESP) and by the ‘Conselho Nacional de Desenvolvimento Científico e Tecnológico’ (CNPq, project no. 449564/2014-2). JAPM, APS and LBJ received a scholarship from the ‘Coordenação de Aperfeiçoamento de Pessoal de Nível Superior – CAPES’ and GCMM and TFG from FAPESP. DPM and LLC are CNPq fellows.
Supplementary material
To view supplementary material for this article, please visit https://doi.org/10.1017/S1751731117002671