I. INTRODUCTION
The phenomenon “grain boundary segregation” is known for decades. Although the first indirect evidence of the effect of changed composition of grain boundaries of copper on interfacial cohesion has been reported already in 19th century,Reference Hampe1 probably the first direct reference in the literature comes from 1950s when Stewart et al.Reference Stewart, Thomas, Wauchope, Winegard and Chalmers2 showed by autoradiography that polonium (i.e., radioactive isotope 210Bi) enriches grain boundaries in lead. After the starting period of indirect detection, extended studies of grain boundary segregation have been facilitated by the development of surface analytical techniques such as Auger electron spectroscopy (AES), X-ray photoelectron spectroscopy (XPS or ESCA—electron spectroscopy for chemical analysis), etc.Reference Hondros, Seah, Hofmann, Lejček, Cahn and Haasen3 In this respect, the publication of Kalderon explaining the reasons for catastrophic damage of the rotor in the Hinkley Point power station in 1968 represents the very first application of AES in the field of grain boundary segregation.Reference Kalderon4 Since that time, numerous studies of grain boundary segregation of various solutes in different host metals were published. Somewhat later, molecular dynamics (MD)Reference Hashimoto, Ishida, Yamamoto and Doyama5 and tight binding (TB)Reference Masuda-Jindo6 calculations of the energy of grain boundary segregation have been started. Besides them, various other approaches to theoretical calculations have been later developed, mainly Monte Carlo and density functional theory (DFT) as summarized in the recent review.Reference Lejček, Šob and Paidar7
During those more than 70 years of real and intensive study of the grain boundary segregation, extensive understanding of this phenomenon was achieved. The development of this field can be documented, e.g., by establishment of its thermodynamics and kinetics, development of models for description of chemical composition of the interfaces in real multicomponent systems, models of nonequilibrium segregation joined mainly with material irradiation or deformation, and the relationship of the segregation with metallurgical problems such as intergranular embrittlement and grain boundary engineering (GBE).Reference Lejček8 In the following, we will present recent trends and achievements and discuss some open questions appearing during the development of the field.
II. RECENT TRENDS IN STUDYING GRAIN BOUNDARY SEGREGATION
The recent studies of grain boundary segregation have been focused on the following tasks: (i) stabilization of grain size (i.e., nanocrystalline structures) by grain boundary segregation; (ii) relationship between grain boundary segregation and changes of intercrystalline cohesion; (iii) GBE; and (iv) nonequilibrium segregation. Extensive attention has also been paid to (v) development of new techniques to experimental studies of grain boundary segregation; (vi) theoretical calculations of the segregation energy including development of new procedures of these calculations; and (vii) studies of grain boundary segregation in nonmetallic systems. Besides, (viii) new models of grain boundary segregation have been proposed including considerations of the segregation site in the grain boundary core; and (ix) development of the concept of grain boundary complexions which also shows the importance of the segregation entropy as a decisive parameter describing this phenomenon. During the last 5 years, more than 500 papers related to these 9 basic trends were published according to the Scopus database, which documents that the interest in the field of grain boundary segregation is permanently stable and large. Let us briefly summarize the recent effort in the individual issues listed above.
Stabilization of grain boundaries by grain boundary segregation has been frequently studied with extended interest as the importance of nanocrystalline materials is growing similarly as the requirements on their stability at enhanced temperatures. Solute segregation is one of the main stabilizing features and has been investigated from various viewpoints and model formulations.Reference Murdoch and Schuh9–Reference Liang, Chen, Yang, Zhang and Zhang14 In this respect, the effect of entropy is also often considered as its importance increases with increasing temperature.Reference Zhou, Hu, Huang and Luo15 The present task is to find the rules for stabilizing effects and selection of suitable systems in which the nanocrystalline structure remains unchanged. In this respect, positive enthalpy of mixing plays the crucial role.Reference Murdoch and Schuh9–Reference Chookajorn and Schuh11 The effect of the grain boundary segregation on the stabilization of nanocrystalline structures consists in complex link of reduced grain boundary energy, boundary migration kinetics, and mobilityReference Abdeljawad and Foiles13 which is often anisotropic: in such case, growth of few grains is thus possible on account of the otherwise stabilized nanostructure.Reference Svoboda and Fischer16 This is inevitable, however, as few but large grains may appear in the materials similarly to the abnormal grain growth. Typical hosts for the study of the grain size stabilization are nickel,Reference Liang, Chen, Yang, Zhang and Zhang14,Reference Zhou, Hu, Huang and Luo15,Reference Waseda, Goldenstein, Lenz Silva, Neiva, Chantrenne, Morthomas, Perez, Becquart and Veiga17 tungsten,Reference Chookajorn and Schuh18 and iron.Reference Liang, Chen, Yang, Zhang and Zhang14 Great attention is also paid to immiscible nanocrystalline alloys.Reference Abdeljawad, Lu, Argibay, Clarke, Boyce and Foiles19 Indeed, the solute segregation is not the single stabilizing effect of the nanostructure: Another one is the drag of the boundary migration caused by presence of precipitates (e.g., Zener drag). However, the necessary condition for formation of the precipitates at the grain boundaries is preceding solute segregation at those regions.Reference Chen, Liu, Yang, Shen and Zhao20
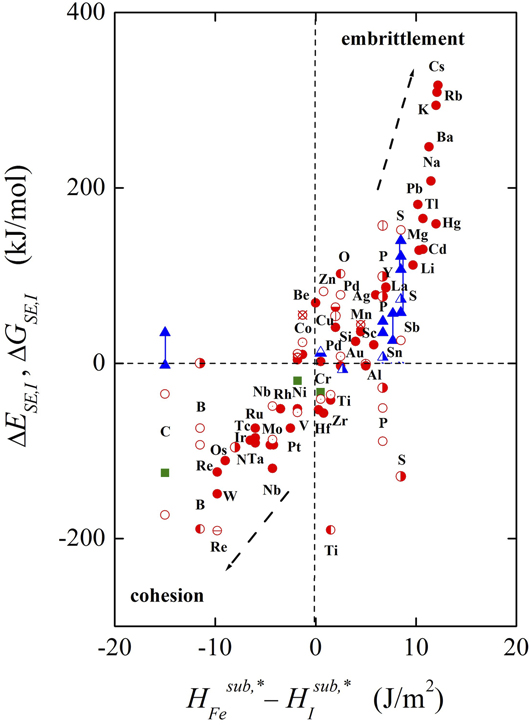
Another consequence of grain boundary segregation is segregation-induced change of intergranular cohesion. This subject is mainly studied on technologically important and/or prospective materials as nickel,Reference Lejček, Šob and Paidar7,Reference Luo21–Reference Djamal, Gall and Lefkaier23 tungsten,Reference Li, Kong, Wei, Liu and Fang24,Reference Scheiber, Razumovskiy, Pusching, Pippan and Romaner25 iron,Reference Lejček, Šob and Paidar7,Reference Lejček, Šandera, Horníková, Řehák and Pokluda26–Reference He, Wu, Jia, Wang, Dou and Yang28 aluminum,Reference Babicheva, Dmitriev, Bai, Ying, Kang and Zhou29–Reference Sauvage, Lee, Matsuda and Horita31 magnesium,Reference Basu, Pradeep, Mießen, Barrales-Mora and Salman32 vanadium,Reference Jo, Madakashira, Suh and Han33 niobium,Reference Shi, Zhu, Zhang and Sun34 and NiAl.Reference Kovalev, Wainstein and Rashkovskiy35 The quantitative data on this relationship were recently summarized and critically discussed in review papers.Reference Lejček, Šob and Paidar7,Reference Gibson and A Schuh36,Reference Gibson and Schuh37 For example, the dependence of the strengthening/embrittling energy (for definition, see Eq. (6) in Part III) on the difference of the sublimation enthalpies of host iron and solute elements is shown in Fig. 1.Reference Lejček, Šob and Paidar7 The anisotropic effect of fracture propagation in S-doped nickel confirmed that the crack tends to propagate along general grain boundaries while low-angle, special and twin grain boundaries are more resistant against the fracture damage.Reference Kobayashi, Maruyama, Saito, Tsurekawa and Watanabe22 From the viewpoint of the atomic size, it seems that the characteristic strengthening/embrittling energy is closely related to the ratio of atomic radii of the host and segregated atoms: the segregated atoms with larger radii than the host atom usually act as embrittlers and those with smaller radii act as cohesion enhancers.Reference Li, Kong, Wei, Liu and Fang24 Another approach shows that the decisive role in the segregation-induced changes of the cohesion consists in the tendency of individual solutes to bond breaking.Reference Scheiber, Razumovskiy, Pusching, Pippan and Romaner25,Reference Shi, Zhu, Zhang and Sun34,Reference Gibson and Schuh37 However, the strengthening/embrittling energy is defined as a difference of the segregation energies at the grain boundaries and at the free surface (for their definition, see Eq. (5) in Sec. III), and the surface segregation also plays an important role in changes of the cohesion.Reference Lejček, Šandera, Horníková, Řehák and Pokluda26
Dependence of the strengthening/embrittling energy, ΔE SE,I, and/or the Gibbs energy, ΔG SE,I, on the difference of sublimation energies of α-iron and respective solute. Blue triangles represent experimental data of ΔG SE,I at differently oriented grain boundaries. Symbols connected by vertical lines show limiting values of individual data. The red circles and green squares are the values calculated by DFT methods and by other theoretical approaches, respectively; the symbols of the same type correspond to the same source. Reprinted with permission from Ref. Reference Lejček, Šob and Paidar7. Copyright 2017 Elsevier.

Despite the description of the solute segregation at interfaces seems to be well elaborated,Reference Lejček8 new models of grain boundary segregation emphasizing the role of entropy have been further developed which shed more light to individual dependences or refine the existing models. A new method was proposed to estimate energetic quantities of the grain boundary segregation on the basis of diffusion measurements in binary systems with limited solid solubility. Besides determining the grain boundary diffusivity, this method allows us to evaluate the characteristic parameters of the grain boundary segregation.Reference Esin and Souhar38 KaptayReference Kaptay39 extended the Butler equation to model equilibrium energy and composition of grain boundaries in polycrystals. Based on the Cahn–Hilliard equation, a phenomenological model was proposed which describes different types of distribution of dissolved components as, e.g., depletion and/or enrichment of the grain boundary, and competitive precipitation in the bulk and at the grain boundary.Reference L’vov and Svetukhin40 Additionally, a qualitative model has also been proposed to explain the contradiction between theoretical calculations of preferentially substitutional segregation of phosphorus at the grain boundaries of iron at 0 K and experimental indications of its interstitial segregation: This model is based on consideration of temperature dependence of the Gibbs energy of segregation for both positions in the grain boundary core and suggests the existence of a transition of the segregation site in the grain boundary core.Reference Lejček and Hofmann41 The importance of entropy in quantitative thermodynamic considerations has also been emphasized in the prediction of the grain boundary segregationReference Lejček, Zheng, Hofmann and Šob42 (and also in classification of grain boundaries on the basis of their chemical compositionReference Lejček, Jäger and Gärtnerová43). Practical importance of the entropy in the grain boundary segregation was documented on above-mentioned stabilization of the nanocrystalline structure in multicomponent nickel-based alloys containing particles of high-entropy alloys.Reference Zhou, Hu, Huang and Luo15
Both the grain size stabilization and the relationship between the grain boundary segregation and changes of the intergranular cohesion can be successfully applied in the concept of the GBE. In this respect, a new specific branch—grain boundary segregation engineering—has been proposed.Reference Raabe, Sandlöbes, Millán, Ponge, Assadi, Herbig and Choi44–Reference Kuzmina, Ponge and Raabe46 According to this concept, solute segregation is utilized to manipulate specific grain boundary structures, compositions, and properties to enable optimum material behavior.Reference Raabe, Herbig, Sandlöbes, Li, Tytko, Kuzmina, Ponge and Choi45 This effect is documented for example by Mn containing maraging steel in which ductile and tough martensite is produced.Reference Raabe, Sandlöbes, Millán, Ponge, Assadi, Herbig and Choi44,Reference Kuzmina, Ponge and Raabe46
Further progress has also been made in the concept of grain boundary complexions during last five years. Present knowledge on grain boundary complexions was thoroughly summarized with respect to their categorization and transitions.Reference Cantwell, Ming, Dillon, Luo, Rohrer and Harmer47,Reference Dillon, Tai and Chen48 In this respect, bilayer grain boundary complexions and their faceting were observed and described in Cu–Bi alloys.Reference Kundu, Asl, Luo and Harmer49 These bilayers were found to be the main cause for significantly enhanced liquid metal embrittlement and corrosion.Reference Luo21 Stable grain boundary complexions are also formed in polycrystalline alumina when the boundaries are enriched by yttrium, lanthanum, and/or magnesium. The values of the segregation energy at selected grain boundaries by the force field-based energy minimization method suggest that there is a critical solute concentration (3–4 atoms/nm2) for achieving the monolayer grain boundary complexion with the lowest mobility. Twin grain boundaries were found to be more favorable than general high angle grain boundaries to form monolayer complexions necessary for limiting grain growth.Reference Tewari and Bowen50
Recent effort in the field of nonequilibrium grain boundary segregation has been focused on the establishment of a unified mechanism of nonequilibrium segregation and segregation-induced embrittlement. This mechanism based on thermally induced and/or stress-induced nonequilibrium grain boundary segregation describes three types of intergranular embrittlement—reverse temper embrittlement of steels, intergranular corrosion embrittlement of stainless steels, and intermediate temperature embrittlement of metals and alloys.Reference Xu, Zheng, Wang and Misra51 These problems represent a consequence of an interim substantial increase of the grain boundary concentration of a harmful solute before it approaches an equilibrium value. For example, this mechanism is responsible for the embrittlement of Bi-doped nickelReference Zheng, Chellali, Schlessinger, Meng, Baither and Schmitz52 and for loss of hot ductility of various stainless steels.Reference Liu, Yu, Wang and Xu53 To overcome the problems of embrittling the steels, it was suggested to avoid slow cooling of the material from the aging temperature or keeping it at intermediate temperatures.Reference Song, Zhao and Si54
However, the grain boundary segregation is not limited to metals and alloys which represent the earliest studied materials in many respects. Besides them, other materials have recently been studied in relationship to grain boundary segregation. In this connection, main attention has been paid to oxides like ZrO2,Reference Lee, Prinz and Cai55–Reference Feng, Yokoi, Kumamoto, Ikuhara and Shibata60 TiO2,Reference Ma, Cantwell, Pennycock, Zhou, Oxley, Leonard, Pennycook, Luo and Harmer61–Reference Yan, Kang, Du, Gan and Yi63 CeO2,Reference Lee, Prinz and Cai55,Reference Meng, Lin, Zhou, Yang, Kong and Meng64 UO2,Reference Andersson, Tonks, Casillas, Vyas, Nerikar, Ubruaga and Stanek65 and ZnOReference Straumal, Protasova, Mazilkin, Goering, Schütz, Straumal and Baretzky66; as well as to silicon,Reference Stoffers, Cojocaru-Mirédin, Seifert, Zaefferer, Riepe and Raabe67 ferrites,Reference Mondal, Murty and Murthy68–Reference Mondal, Murty and Murthy70 perovskites,Reference Yoon, Lee, Bae, Jo, Chung, Kim, Kang and Chung71 spinels,Reference Cao, Kundu, Yu, Harmer and Vinci72 and multiferroics.Reference Zachariasz, Kulawik and Gudzek73 A phenomenological model was proposed to explain the origin of grain boundary complexions and the first-order complexion transitions which may occur in CuO-doped TiO2 bicrystals.Reference Ma, Cantwell, Pennycock, Zhou, Oxley, Leonard, Pennycook, Luo and Harmer61 In these materials, the effect of segregation on their electric and magnetic properties have been frequently studied.Reference Meng, Lin, Zhou, Yang, Kong and Meng64,Reference Straumal, Protasova, Mazilkin, Goering, Schütz, Straumal and Baretzky66–Reference Mondal, Murty and Murthy69,Reference Yoon, Lee, Bae, Jo, Chung, Kim, Kang and Chung71,Reference Zachariasz, Kulawik and Gudzek73,Reference Boyle, Carvillo, Chen, Barbero, Mcintyre and Song74 Hydrothermal stability, mechanical stability, and translucency were studied in materials for dental applications such as 3Y-TZP ceramics.Reference Zhang, Vanmeensel, Batuk, Hadermann, Inokoshi, Van Meerbeek, Naeret and Vleugels57 Considerable attention has been paid to the site of the segregant in the grain boundary core, i.e., which atom is substituted there.Reference Feng, Yokoi, Kumamoto, Ikuhara and Shibata60,Reference Ma, Cantwell, Pennycock, Zhou, Oxley, Leonard, Pennycook, Luo and Harmer61,Reference Andersson, Tonks, Casillas, Vyas, Nerikar, Ubruaga and Stanek65,Reference Yoon, Lee, Bae, Jo, Chung, Kim, Kang and Chung71 It was also found that energetically stable configurations of the segregants vary in dependence on their ionic radii.Reference Yokoi, Yoshiya and Yasuda56,Reference Yokoi, Yoshiya and Yasuda58 Although ZnO with high portion of grain boundaries can exhibit ferromagnetism itself, doping with “magnetic atoms” such as manganese, cobalt, iron, or nickel, and their segregation facilitates its appearance.Reference Straumal, Protasova, Mazilkin, Goering, Schütz, Straumal and Baretzky66
For the study of the grain boundary segregation and mainly its fine features, a feasible experimental tool is required. Therefore, further development of methodology and top instrumental equipment—high-resolution electron microscopy (HRTEM) and 3D atom probe tomography (3D APT)—has been reported recently. At present, the best atomic resolution at the interfaces is reached by spherical aberration-corrected scanning transmission electron microscopy (Cs-corrected STEM), which was applied for the first time in the study of chlorine and oxygen segregation at the grain boundaries in copper interconnects.Reference Nagano, Tamahashi, Sasajima and Onuki75 Aberration-corrected high-angle annular dark-field imaging in transmission electron microscopy was used to distinguish fine details of distribution of Hf atoms in the grain boundary core of Al2O3: it was proved that apparent multiple layer segregation is, in fact, single-layer segregation on the faceted grain boundary.Reference Yu, Wu, Rickman, Chan and Harmer76 Solute segregation to inversion domain boundaries in ZnO was used as an example of the best procedure of transformation of obtained nanobeam-mode spectra to quantify the areal density of atoms contained within a very thin layer of a matrix material with a precision better than 1 atom/nm2 in all these cases.Reference Walther, Hopkinson, Daneau, Recnik, Ohno, Inoue and Yonenaga77 In contrast to HRTEM which provides us with site resolution of segregants at the grain boundary, 3D APT displays the distribution of the segregants in a relatively large volume (i.e., volume of the order of 103 cubic nanometers) inside the material albeit not identifying the site in the grain boundary core.Reference Babinsky, Weidow, Knabl, Lorich, Leitner and Primig78 Therefore, it is a very important tool in studies of the grain boundary segregation mainly in nanocrystalline materials as done, for example, in the cases of characterization of the A15 phase in a bronze-route Nb3Sn superconducting wire with a Cu–Sn(Ti) bronze matrix,Reference Sandim, Tytko, Kostka, Choi, Awaji, Watanabe and Raabe79 of analysis of solute redistribution in pearlitic steel,Reference Li, Choi, Goto, Borchers, Raabe and Kirchheim80 and of distribution of boron and alloying elements at prior austenite grain boundaries in a quenched martensitic steel.Reference Li, Ponge, Choi and Raabe81 A simplified nondestructive 3D electron backscatter diffraction (EBSD) methodology was proposed which enables us to measure all five degrees of freedom of grain boundaries combined with segregation analysis using 3D APT. The approach is based on two 2D EBSD measurements on orthogonal surfaces at a sharp edge of the specimen followed by the analysis of the grain boundary composition using 3D APT.Reference Herbig, Raabe, Li, Choi, Zaeferer and Goto82,Reference Mandal, Pradeep, Zaefferer and Raabe83 Nevertheless, a more precise procedure for the preparation of the desired specimen to study grain boundaries in refractory metals with a dual focused ion beam/scanning electron microscope is still required.Reference Li, Ponge, Choi and Raabe81
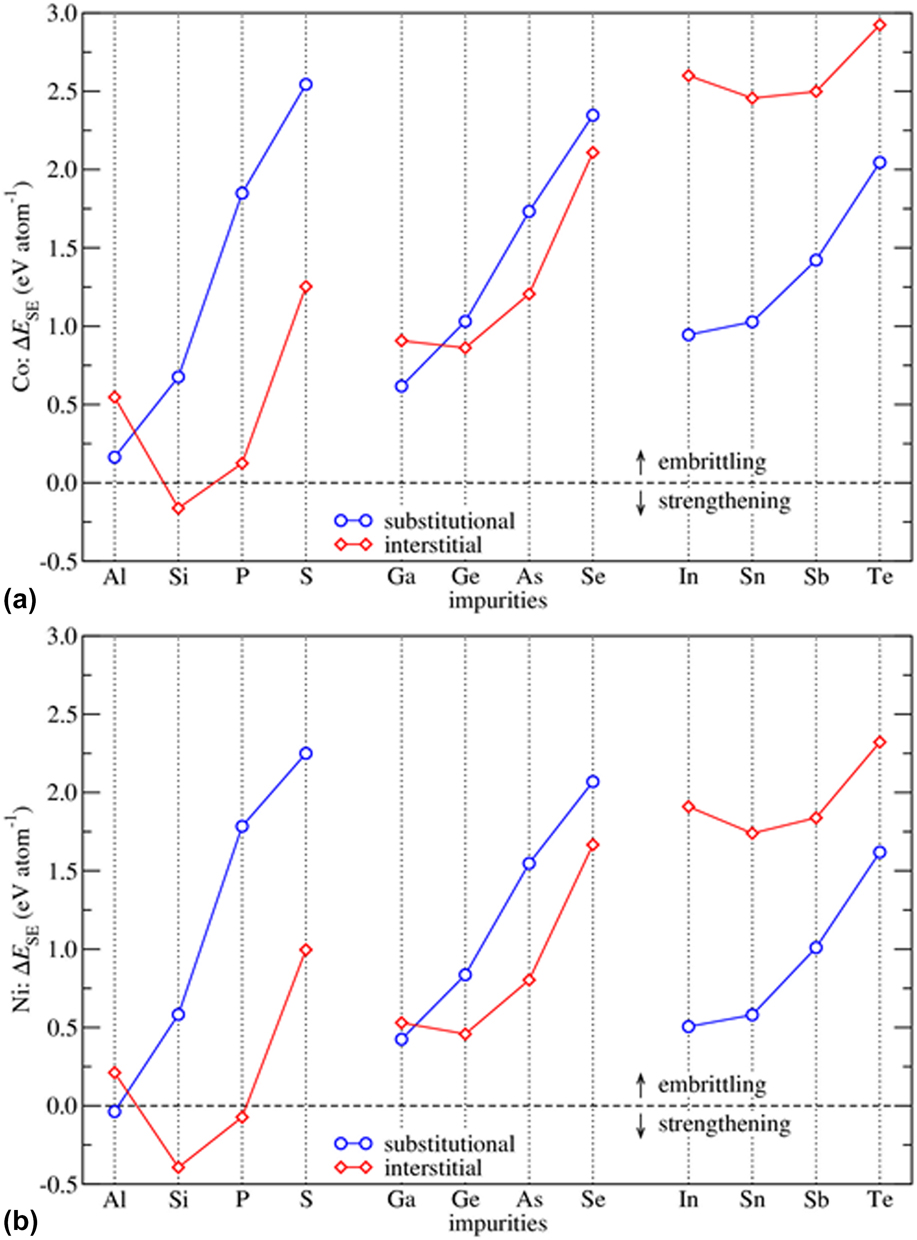
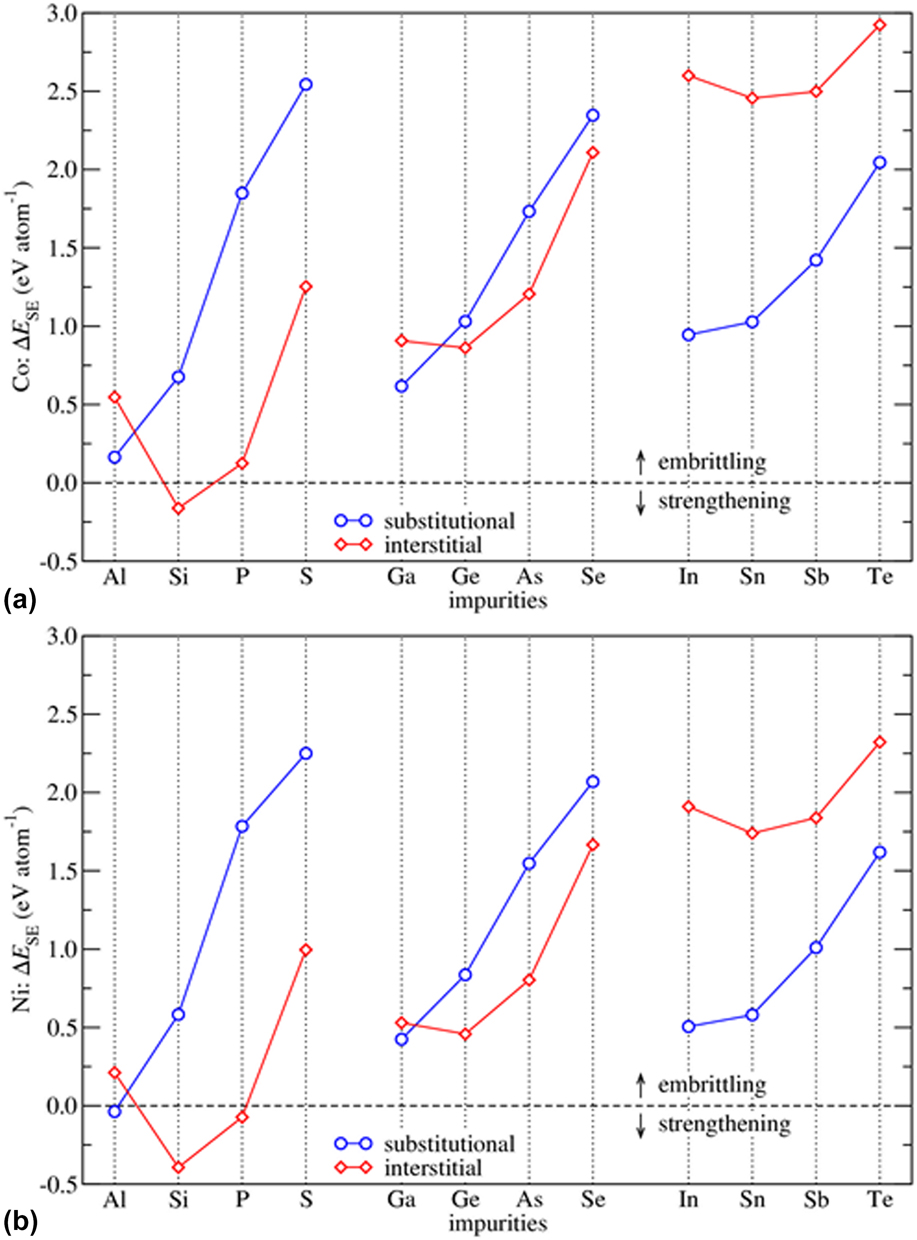
Last but not least, theoretical calculations of the segregation energy have been intensively performed during the period of 2013–2017, too. The systems representing both the technologically applied materials and materials with application potential in the near future have been studied. As expected, the main host element for these studies is α-iron,Reference Solanki, Tschopp, Bhatia and Rhodes84–Reference Zemła, Wróbel, Wejrzanowski, Nguyen-Manh and Kurzydłowski91 followed by nickelReference Bentria, Lefkaier and Bentria92–Reference Všianská, Vémolová and Šob97 and aluminum.Reference Rajagopalan, Bhatia, Solanki and Tschopp98–Reference Huber, Grabowski, Militzer, Neugebauer and Rottler102 Frequently, the systems based on tungstenReference Li, Kong, Wei, Liu and Fang24,Reference Scheiber, Razumovskiy, Pusching, Pippan and Romaner25,Reference Scheiber, Pippan, Puschnig, Ruban and Romaner103–Reference Wang, Niu and Wang107 and molybdenumReference Scheiber, Pippan, Puschnig, Ruban and Romaner103,Reference Scheiber, Pippan, Puschnig and Romaner104,Reference Sun, Jin, Zhou, Zhang and Lu108,Reference Lenchuk, Rohrer and Albe109 have also been studied. BaZrO3 represents the nonmetallic system of increasing interest in connection with impurity and solute segregation.Reference Lindman, Helgee, Nyman and Wahnström110–Reference Lindman, Bjørheim and Wahnström115 In vast majority of these cases, the DFT procedures have been applied. Some of the above studies were performed according to the pattern coined by Všianská and Šob.Reference Všianská and Šob116 The qualitative progress in the development of the procedures for calculations of the segregation energy was done when the quantum mechanics (QM)-based methods were combined with molecular mechanical ones to enlarge the computational repeat cell by several orders of magnitude.Reference Huber, Grabowski, Militzer, Neugebauer and Rottler102 This approach enabled us to calculate the energetic characteristics of general grain boundaries having low symmetry which cannot be obtained with help of classical DFT methods. It was proven quantitatively that sulfur segregates interstitially at Σ5 (210) grain boundary of α-iron. However, presence of chromium prevents its segregation.Reference Li, Dang, Wang, Zhang and Han86 While both sulfur and chromium segregate at different sites in the grain boundary core, this is a flagrant example of repulsive interaction during solute segregation in a multicomponent system. Despite it is known that substitutional alloying elements significantly affect the processes running in steels such as recrystallization and austenite-ferrite phase transformation, mechanisms of their interaction with the interfaces remain unexplored. DFT calculations of segregation of niobium, molybdenum, and titanium at grain boundaries in iron suggest the co-segregation of these solutes at intermediate distances.Reference Jin, Elfimov and Militzer87 A new approach was proposed to design Ni-based polycrystalline superalloys: This approach is based on the idea that the creep-rupture characteristics of a superalloy are mostly determined by the strength of interatomic bonding at grain boundaries and in the bulk of the γ matrix. From this point of view, Zr, Hf, Nb, Ta, and B are proposed as the most promising low-alloying additions.Reference Razumovskiy, Lozovoi and Razumovskii93 The calculated strengthening/embrittling energies of numerous solutes at nearly Σ3 (111) [110] tilt symmetric grain boundary in tungsten suggest that solutes with larger atom radius than tungsten, i.e., Sr, Th, In, Cd, Ag, Sc, Au, Ti, and Zn, embrittle tungsten while those with smaller atom radius—Cu, Cr, and Mn—can be considered as cohesion enhancers.Reference Li, Kong, Wei, Liu and Fang24 Besides them, boron, carbon, and beryllium were identified as potential alloying additions for an increased intergranular cohesion in tungsten and molybdenum. Similar to previously studied solute segregation at grain boundaries of nickel host,Reference Všianská and Šob116 calculations of the grain boundary and surface segregation energies in cobalt suggested that interstitially segregated Si should be the cohesion enhancer of the Σ5 (210) grain boundary while interstitially segregated S, Ge, As, and Se, and substitutionally segregated Ga, In, Sn, Sb, and Te are grain boundary embrittlers; interstitially segregated P and substitutionally segregated Al have a very small effect on the grain boundary cohesion (Fig. 2).Reference Všianská, Vémolová and Šob97 Unfortunately, a very important characteristic of the grain boundary segregation—segregation entropy—has not been calculated despite its importance was unambiguously proved.Reference Lejček8,Reference Lejček and Hofmann41,Reference Lejček, Zheng, Hofmann and Šob42 It is also interesting that some solutes were found to change their site in the grain boundary core from substitutional to interstitial upon segregation.Reference Scheiber, Pippan, Puschnig and Romaner104
Strengthening/embrittling energy, ΔE SE, at the Σ5 (210) GB in fcc Co (a) and Ni (b). Reprinted with permission from Ref. Reference Všianská, Vémolová and Šob97. Copyright 2017 IOP Publishing.
III. OPEN QUESTIONS IN GRAIN BOUNDARY SEGREGATION
Substantial progress in understanding the grain boundary segregation, in development of the experimental techniques enabling its study and mainly in calculation of the segregation energies has been done during the last five years. However, with this achievement, new questions have been opened which need to be addressed. Examples of such questions are as follows: Why there is an extreme disagreement in the values of the segregation energies for some solutes while there is quite a good agreement for others in the same host metal? What is the segregation site of individual solutes in the grain boundary core (mainly for metalloids in transition metals)? What is the role of the entropy in grain boundary segregation? Here, we will touch these questions and formulate some conclusions and consequences.
A. Comparison of theoretical energies of grain boundary segregation with experimental values of segregation enthalpy
The majority of the experimental data are correlated according to the Langmuir–McLean segregation isotherm. This type of description deals with characteristic thermodynamic quantity of the grain boundary segregation, the molar Gibbs energy of segregation, ΔG I. In general, this isotherm can be written asReference Lejček8
 $${{X_{\rm{I}}^{{\rm{GB}}}} \over {{X^0} - X_{\rm{I}}^{{\rm{GB}}}}} = {{{X_{\rm{I}}}} \over {1 - {X_{\rm{I}}}}}\exp \left( { - {{\Delta {G_{\rm{I}}}} \over {RT}}} \right)\quad ,$$
where  $X_{\rm{I}}^{{\rm{GB}}}$ and X I are the grain boundary and bulk concentrations of the solute I in a binary M–I solid solution, X 0 is the saturation level of the grain boundary segregation, R is the universal gas constant, and T is the temperature. ΔG I is composed of two terms, the standard (ideal) molar Gibbs energy of segregation,
 $\Delta G_{\rm{I}}^{\rm{0}}$, and the excess molar Gibbs energy of segregation,
 $\Delta G_{\rm{I}}^{\rm{E}}$,
 $$\Delta {G_{\rm{I}}} = \Delta G_{\rm{I}}^0 + \Delta G_{\rm{I}}^{\rm{E}}\quad .$$
Let us note that the standard state is chosen as the unperturbed bulk pure substance (i.e., element and—in the case of the host—also chemical compound, intermetallic compound, etc.) at the temperature T at which the segregation is studied, and under normal pressure in the structure of the host material, M. The other term on the right-hand side of Eq. (2), 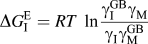 $\Delta G_{\rm{I}}^{\rm{E}} = RT\;\ln {{\gamma _{\rm{I}}^{{\rm{GB}}}{\gamma _{\rm{M}}}} \over {{\gamma _{\rm{I}}}\gamma _{\rm{M}}^{{\rm{GB}}}}}$, is a combination of the corresponding activity coefficients,
 $\gamma _i^\xi$, reflecting the difference between ideal and real behavior,
 $a_i^\xi = \gamma _i^\xi X_i^\xi$, where
 $a_i^\xi$ are the activities (i.e., generalized concentrations) of i in the state ξ.Reference Lejček8 As their values are hardly measurable,
 $\Delta G_{\rm{I}}^{\rm{E}}$ is usually evaluated according to a suitable model. The Fowler approach is frequently used to approximate the effect of activity coefficients in binary systems, using a coefficient of binary interaction of I–I in M, αI(M),
 $$\Delta G_{\rm{I}}^{\rm{E}} = - 2{\alpha _{{\rm{I}}\left( {\rm{M}} \right)}}\left( {X_{\rm{I}}^{{\rm{GB}}} - {X_{\rm{I}}}} \right)\quad .$$
The molar Gibbs energy of segregation, ΔG I, controls the grain boundary composition in binary M–I solid solution at temperature, T, and volume solute concentration, X I. Unfortunately, it depends on X I, and in a nontrivial way on T because of temperature dependence of  $X_{\rm{I}}^{{\rm{GB}}}$ and thus, it can hardly be extrapolated.
As the Gibbs energy, G, is composed of two terms, enthalpy, H, and entropy, S,Reference Lejček8,Reference Lejček and Hofmann117
 $$G = H - TS\quad ,$$
and—as was shown recentlyReference Lejček8,Reference Lejček and Hofmann117 — $\Delta H_{\rm{I}}^0$ and
 $\Delta S_{\rm{I}}^0$ are independent of temperature, therefore, according to Eq. (4),
 $\Delta G_{\rm{I}}^0$ is a linear function of temperature. According to the choice of the standard state,
 $\Delta G_{\rm{I}}^0$ is independent of X I and therefore it can be well extrapolated. However, it describes
 $X_{\rm{I}}^{{\rm{GB}}}$ only if
 $\Delta G_{\rm{I}}^{\rm{E}} = 0$, i.e., in an ideal or infinitesimally diluted system.Reference Lejček8,Reference Lejček and Hofmann117
The characteristic quantity used in theoretical approaches to the grain boundary segregation is the Helmholtz energy of segregation, ΔF I. This energy represents the difference between the energy of the system with the solute atom located at the grain boundary and the system with the same atom located in the bulk. However, the calculations of the interfacial segregation are frequently performed at 0 K (MS, DFT) and thus, only the internal energy of segregation,  $\Delta E_{\rm{I}}^\Phi$, is determined,
 $$\Delta E_{\rm{I}}^\Phi = E_{\rm{I}}^\Phi - E_{\rm{I}}^{\rm{b}}\quad ,$$
where  $E_{\rm{I}}^\Phi$ is the energy of the computational repeat cell with the atom I located at the interface (Φ = GB for the grain boundary or FS for the free surface), and
 $E_{\rm{I}}^{\rm{b}}$ is the energy of the same cell with the atom I located in the bulk. It is apparent from the definition that ΔE I reflects the real state of the grain boundary segregation. However, the recent analysisReference Lejček, Šob and Paidar7 showed that with a reasonable precision,
 $\Delta H_{\rm{I}}^0$ and ΔE I can be well compared as their difference,
 $\Delta H_{\rm{I}}^0 - \Delta {E_{\rm{I}}} = P{\rm{d}}V_{\rm{I}}^{\rm{E}}$, is negligible at normal pressure.Reference Lejček, Zheng, Hofmann and Šob42
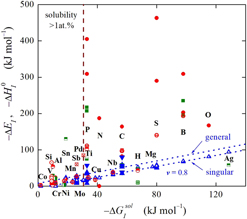
A recently published comparison of the values of the theoretically calculated segregation energy, ΔE I, and experimental values of the standard segregation enthalpy,  $\Delta H_{\rm{I}}^0$, showed that there exists an extreme disagreement between them for some solutes in iron and nickel, whereas some solutes exhibit very good agreement.Reference Lejček, Šob and Paidar7,Reference Lejček, Šob, Paidar and Vitek118 The plot of these values characterizing the grain boundary segregation against the solid solubility of the particular solute I,
 $X_{\rm{I}}^ *$, in α-iron (represented by the Gibbs energy of solution,
 $\Delta G_{\rm{I}}^{{\rm{sol}}} = RT\ln X_{\rm{I}}^ *$) showed two distinct areas—one of a very good agreement for well soluble solutes (
 $X_{\rm{I}}^ * > 0.01$) while the other one exhibiting substantial disagreement for less soluble solutes (
 $X_{\rm{I}}^ * \lt 0.01$), see Fig. 3.
Plot of the segregation energy and/or enthalpy of grain boundary segregation, ΔE I and  $\Delta H_{\rm{I}}^0$, versus the Gibbs energy of solution,
 $\Delta G_{\rm{I}}^{{\rm{sol}}} = RT\ln X_{\rm{I}}^ *$ (i.e., solid solubility,
 $X_{\rm{I}}^ *$), in α-Fe. (a) Complete dependence; (b) detail for solutes with high solid solubility (
 $X_{\rm{I}}^ * > 0.01$). Solid triangles: experimental data (AES, FIM, 3D APT); empty triangles and/or dashed lines: (experimental) prediction [in (a), it is prediction for solute segregation at general (upper line) and special (bottom line) grain boundaries]; dotted lines in (b): extent of the error of the values determined experimentally; solid circles: DFT values; solid squares: other theoretical values (MS, TB). Reprinted with permission from Ref. Reference Lejček, Šob and Paidar7. Copyright 2017 Elsevier.

The level of the limiting concentration,  $X_{\rm{I}}^ * \approx 0.01$, coincides obviously with the “concentration” of a single atom in the computational repeat cell: In DFT calculations, the number of atoms in the computational supercell is usually close to 100 so that X I ≈ 0.01. If the solid solubility of the solute is lower than this concentration limit, the configuration of the system with the solute atom placed in the bulk is nonequilibrium one and, consequently, the segregation energy, ΔE I, involving
 $E_{\rm{I}}^{\rm{b}}$ is also nonequilibrium one, i.e., it has no physical meaning. Of course, it is hard to compare a block with a single atom in a cell containing 100 atoms with the system containing say billions of atoms where the concentration has a real meaning. On the other hand, the computational supercell may represent the system quite well, and it is supposed that it is periodically repeated in the space so that we can imagine that a system can be formed by a solute creating, e.g., a “nanowire” through the lattice. If we consider only a single atom in the cell, we cannot in principle account for any interaction between two solute atoms, i.e., an important contribution to the energy of the bulk and consequently segregation energy is completely omitted. The objections that the computation converges to a single value do not explain this problem as it can converge to a local minimum which can be far from the correct energy of the bulk system,
 $E_{\rm{I}}^{\rm{b}}$. However, despite the fact that some characteristics of interfacial segregation calculated for low-solubility segregants are unreliable due to physically meaningless values of
 $E_{\rm{I}}^{\rm{b}}$ in Eq. (5), we can reliably determine the strengthening/embrittling energy, ΔE SE,I, which refers on the effect of the segregant to the changes of the intergranular cohesion, as this incorrectly determined term is removed,
 $$\Delta {E_{{\rm{SE,I}}}} = \Delta E_{\rm{I}}^{{\rm{GB}}} - \Delta E_{\rm{I}}^{{\rm{FS}}} = \left( {E_{\rm{I}}^{{\rm{GB}}} - E_{\rm{I}}^{\rm{b}}} \right) - \left( {E_{\rm{I}}^{{\rm{FS}}} - E_{\rm{I}}^{\rm{b}}} \right) = E_{\rm{I}}^{{\rm{GB}}} - E_{\rm{I}}^{{\rm{FS}}}\quad .$$
Nevertheless, the discussion about the reliability of the segregation energy is still open and needs proofs, tests, and final answering.
B. Solute site in the grain boundary core: interstitial or substitutional?
One of the examples of a solute exhibiting large scatter of the data shown in Fig. 3(a) is phosphorus. However, the solid solubility of phosphorus in the volume of α-iron is rather close to the limit value of  $X_{\rm{I}}^ * \approx 0.01$. One of the sources of surprisingly large scatter among the theoretical values of ΔE I for a single grain boundary is the considered site of the segregated atom in the grain boundary core. Phosphorus is a substitutional solute in bulk α-iron and frequently, it is a priori accepted as the substitutional segregant.Reference Rez and Alvarez119–Reference Yuasa and Mabuchi121 Despite that, it is also sometimes a priori considered as the interstitial segregant.Reference Hashimoto, Ishida, Yamamoto and Doyama5,Reference Wu, Freeman and Olson122,Reference Fen and Wang123 In some theoretical papers, the calculated values of ΔE P for both interstitial and substitutional sites are compared to show the site preference (lower segregation or binding energy indicates the preference of the site). Yamaguchi’s calculations provide a quantitative evidence for the preference of substitutional segregation in the second boundary layer (as read from the figures, ΔE P ≅ −80 kJ/mol for interstitial and ΔE P ≅ −110 kJ/mol for substitutional segregation at Σ3{111} grain boundary of α-iron)Reference Yamaguchi124 although—compared to the reported accuracy of ±10 kJ/mol of the determination of ΔE P, see Ref. Reference Yamaguchi125—this difference is rather small. Rajagopalan et al.Reference Rajagopalan, Tschopp and Solanki126 report stable substitutional segregation position either in the 2nd or in the 3rd layer at numerous grain boundaries. Nearly the same values of ΔE P for substitutional segregation in the 2nd layer and for interstitial segregation at the Σ3{111} grain boundary of α-iron is reported by Ko et al.Reference Ko, Jeon, Lee, Lee and Lee127 although they claim that substitutional segregation is preferred. On the other hand, interstitial segregation is preferred elsewhere. Braithwaite and RezReference Braithwaite and Rez128 refer the interstitial position to be more stable at the Σ5{210} grain boundary than the substitution position in the 2nd layer; however, for calculations of the exchange and correlation energy, they applied the local density approximation which does not describe the energetics of iron correctly. Wachowicz and KiejnaReference Wachowicz and Kiejna129 report distinctly different values of ΔE P for substitutional and interstitial segregation at Σ3{111} grain boundary (about −15 kJ/mol and about −310 kJ/mol, respectively) as well as for Σ5{210} grain boundary (about −80 kJ/mol and about −405 kJ/mol, respectively). However, the values given for the interstitial segregation are too low (i.e., too large in absolute value) to describe the segregation correctly.Reference Lejček, Šob and Paidar7 Our own preliminary calculationsReference Všianská and Šob130 show that the interstitial position is stable at the Σ5{210} grain boundary while the substitutional position is unstable. We also compared energetics of phosphorus segregation in the substitutional position in the 2nd layer and in the interstitial position directly at the Σ3{111} grain boundary. In comparison with Yamaguchi,Reference Yamaguchi124 we used a more precise setting for our calculations. Contrary to Yamaguchi,Reference Yamaguchi124 we obtained nearly the same energetic values for both positions with a slight preference for the interstitial position at the grain boundary.
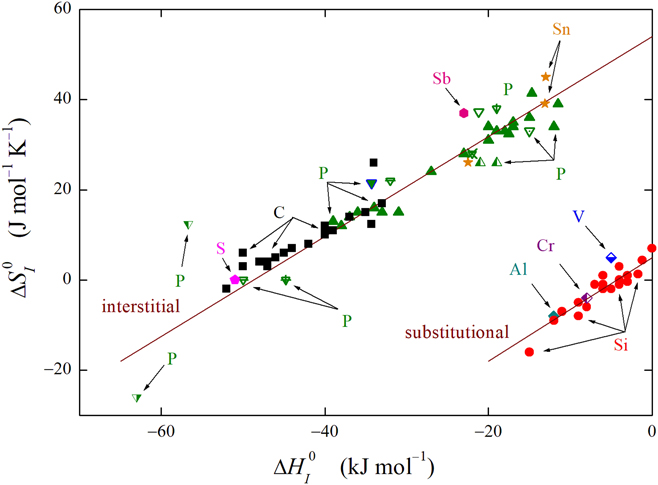
On the other hand, indirect experimental evidence based on the enthalpy–entropy compensation effect suggests interstitial segregation of phosphorus.Reference Lejček and Hofmann41,Reference Lejček and Hofmann117 In its integral form, the enthalpy–entropy compensation effect for grain boundary segregation (which is also reported in more detail in Sec. III.C) is represented by a linear dependence between the standard enthalpy,  $\Delta H_{\rm{I}}^0$, and standard entropy,
 $\Delta S_{\rm{I}}^0$, of grain boundary segregation,Reference Lejček8,Reference Lejček and Hofmann117
 $$\Delta S_{\rm{I}}^0 = {{\Delta H_{\rm{I}}^0} \over {{T_{{\rm{CE}}}}}} + \Delta S'\quad ,$$
where ΔS′ is the integration constant. In the case of the grain boundary segregation in α-iron, expression (7) is well fulfilled by various solutes (Fig. 4). It is apparent from Fig. 4 that this dependence splits into two branches, the upper one for interstitial segregants and the lower one for substitutional solutes. Accordingly, phosphorus, tin, antimony, and probably also other metalloids may be supposed to segregate interstitially at the grain boundaries of α-iron. Let us note that not only the experimental results but also theoretical values of Ko et al.Reference Ko, Kim and Lee131 on temperature dependence of the grain boundary concentrations at three different grain boundaries calculated by the MC approach using a modified embedded-atom method which provide us with the values of the segregation enthalpy and entropy, fit with the interstitial branch in Fig. 4.
Integral form of the enthalpy–entropy compensation effect for grain boundary segregation in α-iron. Full symbols: segregation of C (squares), P (triangles), and Si (circles) at individual grain boundaries. Other symbols are literature data for solute segregation in polycrystalline α-Fe.Reference Lejček and Hofmann41,Reference Lejček and Hofmann117 Theoretical values according to Ko et al.Reference Ko, Kim and Lee131 are the half-solid triangles at the right-hand side of the figure just under the interstitial branch (denoted by nearly horizontal arrow for P). Reprinted with permission from Ref. Reference Lejček and Hofmann41. Copyright 2016 IOP Publishing.

It is apparent from the above survey that the position of the segregated phosphorus at the grain boundaries of α-iron is not clearly determined at all. Some theoretical results show qualitative agreement with experimental deductions; however, quantitatively, there is a large discrepancy. The other theoretical values contradict with the experiment, although according to Yamaguchi,Reference Yamaguchi124 the difference between the substitutional and interstitial position should be small.
C. Role of entropy in grain boundary segregation
It is apparent from Part B that the entropy is an important thermodynamic variable also in grain boundary segregation. Unfortunately, this parameter is not used regularly in the segregation considerations; better say, it is frequently (or nearly always) neglected. Probably, it is the consequence of the fact that the procedure of its theoretical calculation is complicated or has not been elaborated yet and that it represents an additional variable for evaluation of experimental data.
We did already see that the entropy plays an important role in explanation of the site preference in the grain boundary segregation. This example as well as other confirmations result from the existence of the enthalpy–entropy compensation effect.Reference Lejček8,Reference Lejček, Zheng, Hofmann and Šob42,Reference Lejček and Hofmann117 In fact, Eq. (7) is only an integral form which seems to suggest that entropy and enthalpy are mutually dependent. However, it is not so—the enthalpy–entropy compensation effect says that the changes of enthalpy caused by a changed intensive parameter (here the grain boundary structure, Ψ) are compensated by the changes of the entropy caused by the same change of that parameter,Reference Lejček8,Reference Lejček and Hofmann117
 $${T_{{\rm{CE}}}} = {{{{\left( {{{\partial \Delta H_{\rm{I}}^0\left( \Psi \right)} \over {\partial \Psi }}} \right)}_{{\rm{T,P}}}}} \over {{{\left( {{{\partial \Delta S_{\rm{I}}^0\left( {{\Psi _i}} \right)} \over {\partial \Psi }}} \right)}_{{\rm{T,P}}}}}}\quad .$$
In fact, the T CE represents the reciprocal value of the slope of the enthalpy–entropy compensation effect shown in Fig. 4. The value of T CE for ferritic iron is 900 K and is identical for both branches of this dependence, i.e., for substitutional as well as interstitial segregants.Reference Lejček and Hofmann41,Reference Lejček and Hofmann117 Unfortunately, this is the only host for which the value of T CE was determined till now as there is no sufficient information on the values of the segregation entropy for solutes in other hosts.
The direct consequence of Eq. (8) combined with Eq. (4) is that at compensation temperature, T CE,  ${\rm{d}}\Delta G_{\rm{I}}^0 = 0$, i.e.,
 $\Delta G_{\rm{I}}^0 \ne f\left( \Psi \right)$. This means that at T CE, all grain boundaries in a polycrystal possess the same composition. This also means that the magnitude of the anisotropy of grain boundary composition observed at low temperatures is reduced if temperature approaches T CE and disappears at T CE. Above T CE, the anisotropy of solute segregation is reversed, i.e., general boundaries which exhibited stronger segregation at lower temperatures that special ones, possess lower solute concentrations at high temperatures (Fig. 5).Reference Lejček, Jäger and Gärtnerová43 On its basis, for example, anomalous structural dependence of silicon segregation at grain boundaries of a stainless steel (i.e., maximum silicon segregation at special {013}, {012}, and {023} grain boundaries) was explained.Reference Lejček8,Reference Lejček, Jäger and Gärtnerová43
Dependence of atomic fraction of phosphorus at [100] symmetric tilt grain boundaries,  $X_{\rm{P}}^{{\rm{GB}}}$, in an Fe–3.55 at.% Si–0.0089 at.% P–0.014 at.% C alloy on misorientation angle, θ, at various temperatures. 45° [100], {0kl} is the incommensurate symmetrical tilt grain boundary for which k/l is irrational. Reprinted with permission from Ref. Reference Lejček, Jäger and Gärtnerová43. Copyright 2010 Elsevier.

The enthalpy–entropy compensation effect is a very important phenomenon and is of general thermodynamic validity. It has been observed in many other areas of material science, chemistry, biology, etc. Examples of these processes are not only solute segregation at free surfaces and grain boundaries but also grain boundary diffusion and migration, dislocation glide, hydrogen bonding, crystal melting, formation of van der Waals complexes, solubility, micellization, adsorption, enantiomer separation, gas and liquid chromatography, water sorption, solvation, thermal transitions, solution extraction, polymer degradation, conformational equilibrium, ionic hydration, dielectric relaxation, antibiotic dissociation, enzyme binding, catalysis, thermal death of microorganisms, depolymerization of food saccharides, cucumber tissue softening, nonenzymatic browning of potato strips, and conductance of transistors.Reference Lejček8,Reference Lejček and Hofmann117
The above considerations have a very important consequence—they clearly emphasize the necessity to consider entropy in the grain boundary segregation albeit it has been frequently omitted. The segregation entropy was already shown to be important in the above mentioned reversion of the anisotropy of grain boundary segregation which has serious consequences, e.g., for the classification of individual high-angle grain boundariesReference Lejček8,Reference Lejček, Jäger and Gärtnerová43 and prediction of grain boundary segregation.Reference Lejček8,Reference Lejček and Hofmann41,Reference Lejček and Hofmann117,Reference Lejček, Hofmann and Janovec132 In our opinion, it is necessary to find effective procedures for computing the segregation entropy and determine the missing values: only in this case, we will be able to deal reasonably with grain boundary segregation. Let us document it on the classical example of phosphorus segregation at grain boundaries in ferritic iron. The data were measured by Erhart and GrabkeReference Erhart and Grabke133 for various bulk concentrations of phosphorus at temperatures ranging between 400 and 900 °C. The correlation of the temperature dependence of phosphorus grain boundary concentration for the bulk concentrations X P = 0.0017 provides us with the values of segregation enthalpy,  $\Delta H_{\rm{P}}^0 = - 36$ kJ/mol, and segregation entropy,
 $\Delta S_{\rm{P}}^0 = 22$ J/(mol K). (Erhart and Grabke give the values
 $\Delta H_{\rm{I}}^0 = - 34.3$ kJ/mol and
 $\Delta S_{\rm{I}}^0 = 21.5$ J/(mol K) which were averaged for all bulk concentrations used.) This is documented in Fig. 6 by red circles and solid red line. If the segregation entropy is neglected and the correlation of the experimental data is done only by “effective” segregation enthalpy,
 $\Delta H_{\rm{P}}^{{\rm{eff}}} = - 55$ kJ/mol, representing the “best fit” of the experimental data (blue dashed line in Fig. 6), we see that this line does not fit the experimental data properly. This comparison shows that the segregation entropy cannot be neglected in the case of accurate considerations. From this point of view, the calculations of the grain boundary concentration based exclusively on the use of the segregation energy calculated for 0 K by DFT methods as it is sometimes presented,Reference Suzudo and Yamaguchi90,Reference Yamaguchi124,Reference Zhang, Feng, Liu, Lu and Wang134 are doubtful and thus unreliable.
Temperature dependence of phosphorus grain boundary segregation in iron as measured by Erhart and Grabke.Reference Erhart and Grabke133 X P = 0.0017. Red circles are the experimental grain boundary concentrations and solid red line represents the fit of the data with  $\Delta H_{\rm{I}}^{{\rm{0}}} = - 36$ kJ/mol and
 $\Delta S_{\rm{I}}^{{\rm{0}}} = 22$ J/(mol K); blue dashed line is the fit of the data using an effective enthalpy of segregation,
 $\Delta H_{\rm{I}}^{{\rm{eff}}} = - 55$ kJ/mol without considering the segregation entropy

Additionally, consideration of the entropy enables us to shift the understanding of the grain boundary segregation and all connected fields to a higher level as it is indispensable in explanation of many effects, which have not been solved yet.
IV. CONCLUSIONS
The progress achieved in the field of the grain boundary segregation during last five years (2013–2017) was presented and discussed in this paper. Fundamental progress has been achieved mainly in stabilization of nanocrystalline structures by grain boundary segregation, in the concept of grain boundary complexions and in GBE where a new branch of grain boundary segregation engineering was formulated. Great attention was also paid to the development of both experimental techniques to study grain boundary segregation and computational procedures of determination of the segregation energy. In the latter case, the combination of the MD and QM seems to be the most promising tool for overcoming many objections connected with calculations of the segregation energy. The study of the segregation is not limited to metallic hosts but has been gradually extending to other materials like ceramics, multiferroics, semiconductors, oxides, and silicon. However, every progress opens new questions which need to be addressed. Here we did touch three problems: (i) comparison of the theoretical calculations of the segregation energy and experimental results of the segregation enthalpy; (ii) site preference of metalloids in the grain boundary core; and (iii) the role of entropy in the grain boundary segregation. In these areas, we show possible reasons of difficulties but we are aware that they require further effort to reach final explanation. We demonstrate here that a great attention should be paid to reliability of the obtained data. A special problem is the segregation entropy: it can be determined experimentally but theoretical information about it is very rare. However, it is a very important thermodynamic parameter which cannot be omitted in treatments of solute segregation as many questions cannot be answered without considering this quantity.
ACKNOWLEDGMENTS
This work was supported by the Czech Science Foundation [Projects Nos. GB P108/12/G043 (PL) and GA 16-24711S (MŠ, MV)], by the Academy of Sciences of the Czech Republic [Institutional Projects RVO:68378271 (PL) and RVO:68081723 (MŠ, MV)], and by the Ministry of Education, Youth and Sports of the Czech Republic under the project CEITEC 2020 (LQ1601) (MŠ, MV). Computational resources were provided by the Ministry of Education, Youth and Sports of the Czech Republic under the Projects CESNET (Project No. LM2015042), CERIT-Scientific Cloud (Project No. LM2015085), and IT4Innovations National Supercomputer Center (Project No. LM2015070) within the program Projects of Large Research, Development and Innovations Infrastructures.