I. INTRODUCTION
Hafnia has three polymorphs under atmospheric pressure. At room temperature, the stable phase is monoclinic, it transforms into the tetragonal phase with a transition enthalpy of ∼8.4 kJ/mol when heated to ∼1800 °C.Reference Luo, Zhou, Ushakov, Navrotsky and Demkov1 The cubic phase forms above ∼2500 °C.Reference Wang, Zinkevich and Aldinger2−Reference Stacy and Wilder4 Neither tetragonal nor cubic bulk structures can be retained by quenching from high temperature. However, they can exist as metastable nanomaterialsReference Luo, Demkov, Triyoso, Fejes, Gregory and Zollner5–Reference Aarik, Aidla, Mandar, Sammelselg and Uustare9 and bulk cubic phases can be stabilized by doping with Ca2+, Mg2+, Y3+ and other rare earth elements.Reference Stacy and Wilder4
Surface and interface energies play a significant role in stabilizing nanomaterials but such experimental data for yttria-stabilized hafnia (YSH) are not available. The surface enthalpies of different polymorphs of TiO2,Reference Ranade, Navrotsky, Zhang, Banfield, Elder, Zaban, Borse, Kulkarni, Doran and Whitfield10, Reference Levchenko, Li, Boerio-Goates, Woodfield and Navrotsky11 Al2O3,Reference McHale, Auroux, Perrotta and Navrotsky12, Reference McHale, Navrotsky and Perrotta13 Fe2O3,Reference Bomati-Miguel, Mazeina, Navrotsky and Veintemillas-Verdaguer14, Reference Mazeina and Navrotsky15 and ZrO2Reference Pitcher, Ushakov, Navrotsky, Woodfield, Li, Boerio-Goates and Tissue16, Reference Radha, Bomati-Miguel, Ushakov, Navrotsky and Tartaj17 have been measured by high-temperature oxide-melt solution calorimetryReference Navrotsky18 and enthalpy maps showing phase stability crossover at the nanoscale of these materials have been proposed. In this method, samples with the same bulk composition and structure but different surface areas (SA), are dropped from room temperature into an oxide melt and the corresponding heat effect (drop solution enthalpy, ∆H ds) is measured. Providing that the final state is the same (dilute solution in oxide melt), and SA is the only variable, the difference in drop solution enthalpy between samples is directly related to surface enthalpy. Due to the small changes in PV (pressure × volume) term, the surface enthalpy can be considered as the surface energy.
We have reported surface enthalpy measurements for monoclinic hafnia.Reference Zhou, Ushakov, Wang, Ekerdt, Demkov and Navrotsky19 In the current work, we present results for Y2O3 stabilized cubic hafnia with x = 0.10, 0.17 and 0.24 in YxHf1 − xO2 − x/2. The cubic YSH samples were prepared by annealing amorphous precursors synthesized by a coprecipitation method. The surface enthalpies of cubic YSH with different compositions were measured by high temperature solution calorimetry and water adsorption calorimety.Reference Ushakov and Navrotsky20 The surface enthalpies of pure cubic and tetragonal hafnia were approximated. An enthalpy map of the stability of cubic, tetragonal and monoclinic hafnia as a function of SA is proposed.
II. EXPERIMENTAL PROCEDURE
YxHf1 − xO2 − x/2 samples with nominal composition x = 0.10 (1YSH), 0.17 (2YSH) and 0.24 (3YSH) were prepared by coprecipitation from hafnium oxychloride (HfCl2O⋅8H2O, 99.99%, Noah Technologies, San Antonio, USA) and yttrium chloride hexahydrate (YCl3⋅6H2O, 99.99%, Alfa-Aesar, Ward Hill, MA).Reference Lee and Navrotsky21, Reference Ushakov, Brown and Navrotsky22 10 mL 0.25 M aqueous solution of hafnium oxychloride and appropriate volume of 0.25 M yttrium chloride hexahydrate were mixed to produce the desired compositions. The mixed solution was added dropwise to approximately 10 mL concentrated ammonium hydroxide aqueous solution (NH4OH, 29%, Sigma-Aldrich, St. Louis, MO) while stirring. The pH of the resulting solution was greater than 10. The mixture was stirred vigorously at room temperature overnight. The resulting white precipitate was isolated by centrifugation, washed with deionized water and ethanol, and then dried overnight at 100 °C AgNO3 aqueous solution was used to test the complete removal of chloride from the precipitate. Thermal analysis using a Netzsch ST 449 (Netzsch GmbH, Selb, Germany) was performed on the dried products to find the crystallization temperatures. The powders were then divided into several parts and annealed at temperature from 680 to 1000 °C for 1 h to get cubic phases with different crystallite size.
Powder x-ray diffraction patterns (XRD) were obtained using a Bruker D8 Advance x-ray diffractometer (Bruker AXS, Madison, WI) with Cu Kα (λ = 1.5406 Å) operating at 40 kV and 40 mA. Crystallite sizes and SAs were calculated via Rietveld refinement implemented in JADE software (Materials Data Inc., Livermore, CA). Crystallite sizes were also measured via transmission electron microscopy (TEM) (Phillips CM12, Royal Philips Electronics Inc., Amsterdam, The Netherlands) at 120 kV with LaB6 filament. Chemical analysis was carried out on a Cameca SX-100 electron microprobe (CAMECA, Gennevilliers Cedex, France) at 15 kV and 10 nA. Before the analysis, samples with x > 0.10 were sintered above 1500 °C to remove the adsorbed water without phase separation. For the sample with x = 0.10 microprobe analysis was performed on a laser-melted sample. The sample compositions were calculated from the average of eight data points. The amount of water adsorbed on the surface of nanoparticle samples was determined by weight loss experiments, in which the sample was weighed before and after calcination.
A Micromeritics ASAP 2020 instrument (Micromeritics, Norcross, GA) was used to measure nitrogen adsorption isotherms on YSH samples and calculate Brunauer-Emmett-Teller (BET)Reference Brunauer, Emmett and Teller23 SAs. This instrument was also used to dose water vapor into custom-made cells for Setaram DSC 111 Calvet calorimeters (Setaram Instrumentation, Caluire, France), to measure the enthalpy of water adsorption at 25 °C. This methodology has been described previously.Reference Ushakov and Navrotsky20 Prior to adsorption experiments, all samples were degassed at 600 °C for 2 h. These conditions are chosen to maximize H2O removal without coarsening the sample. The total SA of the sample was around 5 m2 and the dose amount was set to 0.3 μmol of H2O vapor per m2 of the total SA of the sample.
High temperature solution calorimetryReference Navrotsky18 in molten sodium molybdate at 700 °C was performed with a custom-built Calvet twin calorimeter to determine the variation in enthalpy with SA. Before drop solution experiments, all samples were equilibrated in the calorimetry laboratory maintained at 24 ± 1 °C and 50 ± 5% humidity. The methodology and methods for calculating surface enthalpy from the calorimetric data have been reported previously.Reference McHale, Navrotsky and Perrotta13, Reference Zhou, Ushakov, Wang, Ekerdt, Demkov and Navrotsky19
III. RESULTS
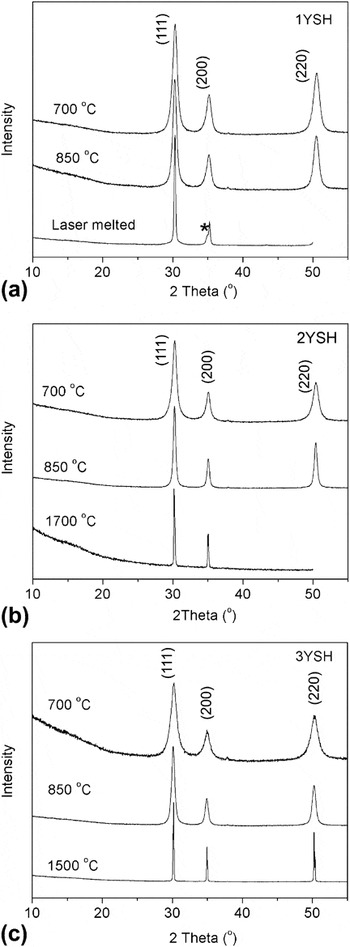
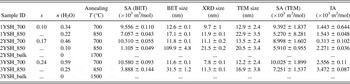
Both the chemical compositions obtained by microprobe analysis and the water content obtained via weight loss experiment are listed in Table I. Powder x-ray diffraction indicated all the samples before annealing were amorphous and those annealed at 700–1700 °C were fluorite type cubic phase (Fig. 1). The XRD peaks become narrower as the annealing temperature increases, indicating the increase of particle size. No bulk cubic phase for the sample with x = 0.10 was made, since no pure phase was obtained by annealing the sample up to 1600 °C. The laser melting method was tried to prepare pure bulk cubic phase, however, the product contains tetragonal phase as indicated by XRD pattern in Fig. 1(a).
XRD patterns (CuKα radiation) of YSH nanoparticle samples with different compositions and annealed at different temperatures. The starred peak in the pattern of 1YSH correspond to (002) line of tetragonal phase (P42/mmc).

Compositions, annealing temperatures, surface and interface areas, and crystal size of YSH nanoparticle samples.

Both BET SAs and XRD crystallite size of YSH samples of different compositions and annealed at different temperatures are shown in Table II. The BET SA of YSH samples decreases and the XRD crystallite size increases as the annealing temperature increases. To calculate the XRD SA from the XRD crystallite size, the density of YSH was determined from the cell parameters obtained from XRD whole pattern refinement.
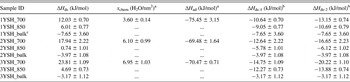
Enthalpies of drop solution and water adsorption.

a Here we assume samples with the same composition have the same ∆H ad and chemisorbed water coverage.
b ∆H ds-1 and ∆H ds-2 is the corrected drop solution enthalpy via the first and second water correction method, respectively.
c From Ref. [Reference Lee and Navrotsky21].
Table I shows that the XRD crystallite size is significantly less than the BET size, indicating the existence of interfaces that are not available for N2 gas adsorption. Thus the nanoparticles are polycrystalline or aggregated. This is consistent with our previous work on yttria-stabilized zirconia (YSZ).Reference Costa, Ushakov, Castro, Navrotsky and Muccillo24 For YSZ, BET and XRD sizes are reasonably close only for the sample annealed at 600 °C, while XRD sizes are substantially smaller than BET sizes for samples annealed above 700 °C.Reference Costa, Ushakov, Castro, Navrotsky and Muccillo24 The difference between XRD and BET size also correlates with the composition. Crystals in samples with higher yttrium content tend to be more aggregated, resulting in larger difference between XRD and BET size, as shown in Table I. Crystallite sizes measured by TEM are also shown in Table I. It is expected that TEM size be close to BET size for loosely aggregated samples (those annealed at low temperature), while it is close to XRD size for highly aggregated samples (those annealed at high temperature).
Interface areas (IA), shown in Table I, were calculated using the following relationReference Radha, Bomati-Miguel, Ushakov, Navrotsky and Tartaj17, Reference Zhou, Ushakov, Wang, Ekerdt, Demkov and Navrotsky19, Reference Shvareva, Ushakov, Navrotsky, Libera and Elam25

where SA (XRD) is the XRD SA, and SA(BET) is the specific SA measure by gas adsorption.
The drop solution enthalpies (∆H ds) are listed in Table II. Since the solution calorimetry experiments were performed on hydrated samples, the enthalpy difference between a YSH nanoparticle sample and its corresponding bulk phase arises from both surface/interface enthalpy and the presence of adsorbed water. A correction for the enthalpy caused by adsorbed water is necessary to accurately calculate the surface/interface enthalpy of pure oxide.
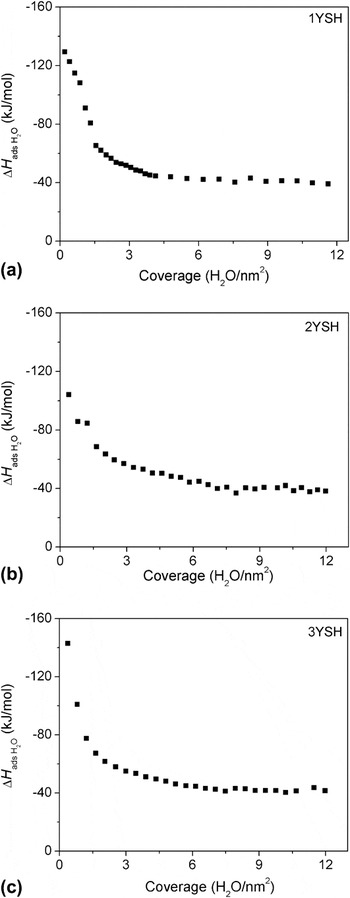
Figure 2 shows a typical water adsorption curve with differential water adsorption enthalpy as a function of water coverage on the surface of YSH nanoparticles. The first dose of water vapor adsorbs with an enthalpy more exothermic than −140 kJ/mol. As water coverage increases, adsorption enthalpy becomes less exothermic and eventually approaches the water condensation enthalpy (−44.0 kJ/mol).Reference Robie, Hemingway and Fisher26 The water with a differential enthalpy of adsorption more exothermic than −44.0 kJ/mol is considered as chemisorbed water and the remaining water is treated as physisorbed water that is energetically equivalent to liquid water. The average water absorption enthalpy (∆H ad) of chemisorbed water and the amount of chemisorbed (x chem) water for each sample are shown in Table II. Samples with the same composition are assigned the same ∆H ad and chemisorbed water coverage. The ∆H ad of YSH is close to that of YSZ with similar Y content.
Differential enthalpy of water adsorption on the surface of YSH nanoparticles versus water coverage: (a) 1YSH; (b) 2YSH; (c) 3YSH.

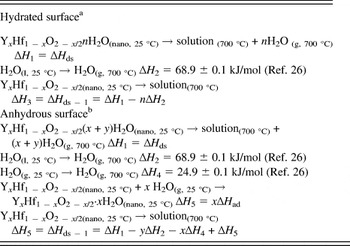
Using the thermodynamic cycle in Table III, two types of water correction can be made to the drop solution enthalpy data. In the first method, the adsorbed water is treated as energetically identical to liquid water and the heat of adsorption is the heat of condensation of water vapor into liquid water at 25 °C; while in the second method, the water adsorption enthalpy measured above is used for the correction.
Thermodynamic cycle used to calculate the corrected drop solution enthalpy of hydrated and anhydrous YSH samples.

a n is the total amount of water adsorbed on the surface of YSH.
b x is the amount of chemisorbed water and y is the amount of physisorbed water.
The relation between corrected drop solution enthalpies of nanopowders and the drop solution enthalpy of corresponding bulk phase can be expressed as follows:

where H surface is the surface enthalpy and H interface is the interface enthalpy. As in our previous work on monoclinic zirconiaReference Radha, Bomati-Miguel, Ushakov, Navrotsky and Tartaj17 and hafnia,Reference Zhou, Ushakov, Wang, Ekerdt, Demkov and Navrotsky19 we take H interface = 0.2 H surface and combine Eq. (1) and Eq. (2):

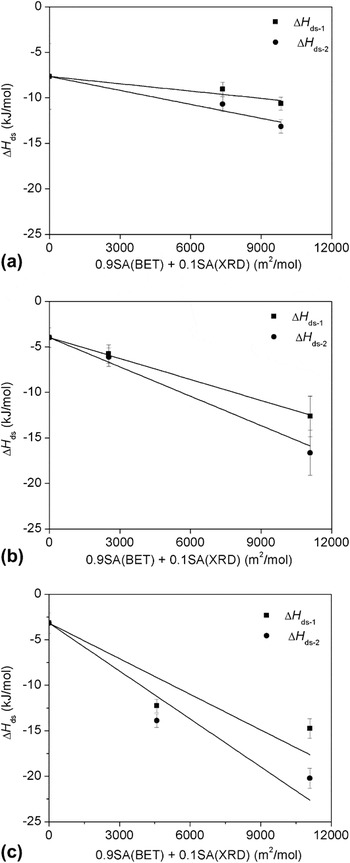
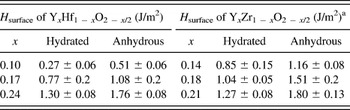
The corrected drop solution enthalpies (∆H ds − 1 and ∆H ds − 2 in Table II) of samples with the same composition but different SA are then plotted as a linear function of [0.9SA(BET) + 0.1SA(XRD)] in Figs. 3(a) and 3(b). The enthalpy in Fig. 3(a) was obtained using the first method of water correction, while that in Fig. 3(b) was via the second method. The negative slope of each line in Fig. 3(a) is the surface enthalpy of YSH at certain yttrium concentration with hydrated surface, while that in Fig. 3(b) is for anhydrous surface. All the surface enthalpies, e.g., the negative of the slopes of the lines, are listed in Table IV, together with the surface enthalpies of YSZ. Considering the similarity between hafnia and zirconia, it is reasonable that YSH and YSZ have similar surface enthalpies for similar yttrium concentration.
Corrected drop solution enthalpy as a linear function of 0.9SA(BET) + 0.1 SA (TEM): (a) 1YSH; (b) 2YSH; (c) 3YSH.

Surface enthalpies of YxHf1 − xO2 − x/2 and YxZr1 − xO2 − x/2 with different compositions.

a Data from Ref. Reference Costa, Ushakov, Castro, Navrotsky and Muccillo24.
IV. DISCUSSION
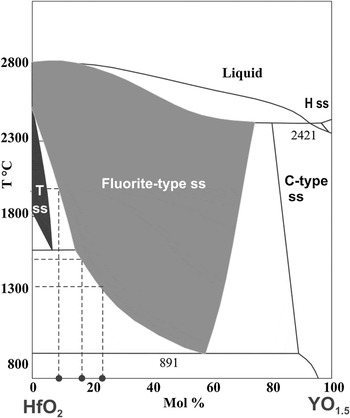
According to the equilibrium phase diagramReference Wu and Jin27 (Fig. 4), below 890 °C all studied YSH compositions would be separated into two phases—Y-rich C-type solid solutions and monoclinic HfO2. Fluorite phase would be stable for bulk compositions studied at 1400–2000 °C with higher temperature corresponding to lower Y content. Nevertheless, no phase separation was observed on annealing of compositions with x = 0.17 and 0.24 and fluorite type phase was retained. Tetragonal phase appears in the sample quenched from laser melting with x = 0.1. The observed stabilization of fluorite-type solid solutions at lower temperatures is due to size effect in nanomaterials, which is essentially related to the lower surface energy of fluorite phase compared with monoclinic and tetragonal.
HfO2–YO1.5 phase diagram after Ref. Reference Wu and Jin27. Fluorite-stable-temperatures for the bulk phase with the studied compositions are labeled.

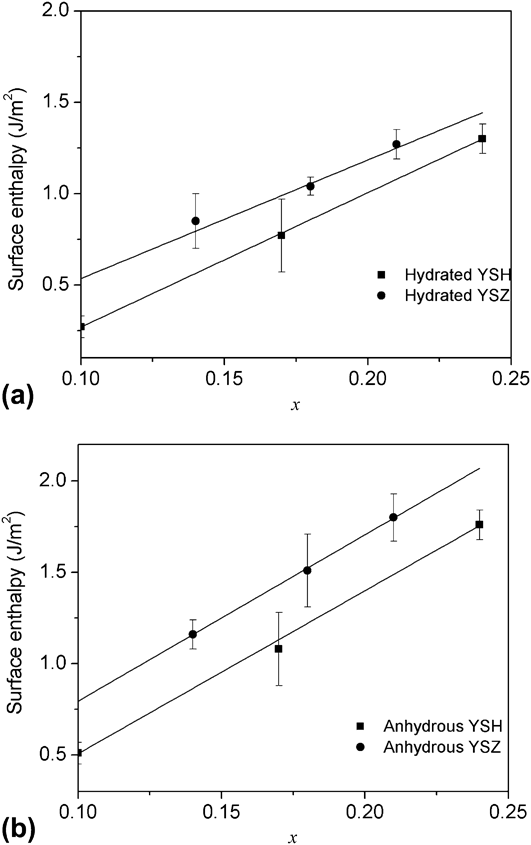
Figure 5 shows the surface enthalpy of YSH as a function of the concentration of yttrium. The data for YSZReference Costa, Ushakov, Castro, Navrotsky and Muccillo24 are also plotted for comparison. The trend of surface enthalpy over composition for YSH is almost parallel to that for YSZ but with 0.2–0.3 J/m2 less endothermic surface enthalpy at a given yttrium content.
Surface enthalpy of YxHf1 − xO2 − x/2 versus yttrium content (x).
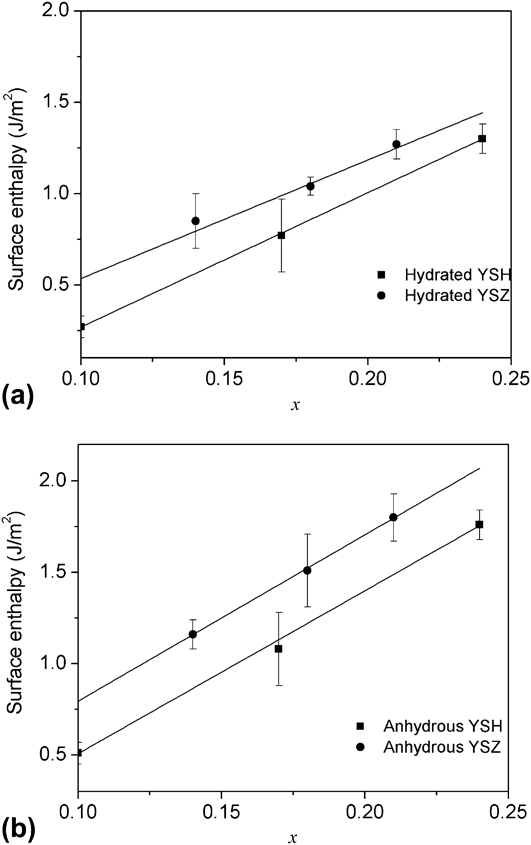
For the studied range of compositions, the relationship between surface enthalpy and composition is close to linear for both YSH and YSZ.Reference Costa, Ushakov, Castro, Navrotsky and Muccillo24 However, this trend should not be extrapolated to pure fluorite yttria, as unreasonably high values of 7.0 (hydrated) and 8.5 (anhydrous) J/m2 would be obtained. Surface enthalpy for anhydrous C-type Y2O3 was measured earlier as 1.66 J/m2.Reference Zhang, Navrotsky, Guo, Kennedy, Clark, Charles and Liu28 C-type structure is closely related to YSH defect fluorite type structure and differs only in complete ordering of oxygen vacancies caused by changes from AO2 to A2O3 stoichiometry.
On the other side, extrapolation to the pure fluorite-type HfO2 would give negative values for surface enthalpy, which are not physically meaningful. Due to lack of data points below x = 0.1, we use the surface enthalpy at x = 0.1 to approximate the value for pure cubic hafnia. Therefore, for the calculations below the enthalpies of hydrated and anhydrous surfaces of cubic hafnia are estimated to be 0.27 ± 0.06 and 0.51 ± 0.06 J/m2, respectively
Based on the observed increase of surface enthalpy of YSZReference Costa, Ushakov, Castro, Navrotsky and Muccillo24 and YSH with Y content, there may be a thermodynamic driving force for Zr and Hf segregation to the surface of fluorite phase. One should clearly distinguish the cases of true surface segregation driven by the decrease of surface enthalpy from that of phase separation followed by segregation of the minor phase to grain boundaries. However, we did not investigate such effects further.
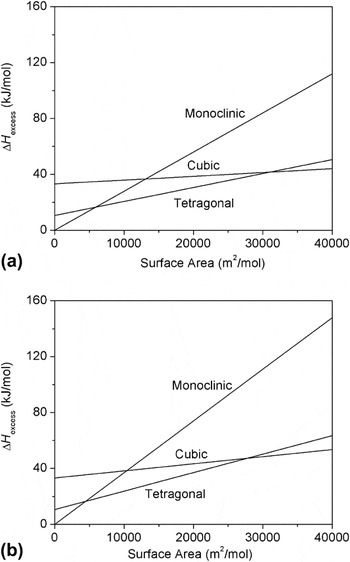
Using the data for cubic hafnia from this work and the data for monoclinic hafnia from our previous work,Reference Zhou, Ushakov, Wang, Ekerdt, Demkov and Navrotsky19 and using the data for tetragonal zirconiaReference Pitcher, Ushakov, Navrotsky, Woodfield, Li, Boerio-Goates and Tissue16, Reference Ushakov and Navrotsky20 to estimate that for tetragonal hafnia, the approximate enthalpy crossover map for monoclinic, tetragonal and cubic hafnia is calculated and shown in Fig. 6. Since the entropy contribution to the Gibbs free energy at room temperature for solid is small, the enthalpy crossovers can be essentially considered as the Gibbs free energy crossovers. These crossovers represent the phase stability changing with the SA at room temperature. The calculation shows the monoclinic-to-tetragonal energy crossover happens at a SA of 4612 m2/mol (21.9 m2/g) for hafnia with hydrated surface and at 4458 m2/mol (21.2 m2/g) for anhydrous surface. This corresponds to particle 28.3 and 29.4 nm in diameter, respectively. The tetragonal-to-cubic crossovers occur at 30,527 (145.0 m2/g) and 27,889 m2/mol (132.5 m2/g) for hydrated and anhydrous phases respectively, corresponding to particle sizes of 3.9 and 4.3 nm in diameter. The reason that the crossover point of anhydrous phases is at a larger particle size than that of hydrated phases could be attributed to the larger stabilizing effect of water vapor on monoclinic phase than tetragonal and cubic phase, suggested by Murase and Kato,Reference Murase and Kato29, Reference Murase and Kato30 and proven by our measurements of adsorption enthalpies. However, hydration changes the crossover points by only about 10%. We conclude that the surface enthalpies and phase stability crossover behavior of YSZ and YSH are generally similar.
Stability crossover of monoclinic, tetragonal and cubic hafnia: (a) hydrated phases; (b) anhydrous phases. Note: The surface enthalpy of tetragonal hafnia [SE (tetra, HfO2)] is estimated by standard error (tetra, HfO2) = standard error (tetra, ZrO2)/SE (cubic, ZrO2)·standard error (cubic, HfO2), the excess enthalpy of bulk tetragonal zirconia is used for that of bulk tetragonal hafnia.

V. CONCLUSION
Yttria-stabilized cubic hafnia, YxHf1 − xO2 − x/2, with x = 0.10 to 0.24 have been synthesized by precipitation. High-temperature solution calorimetry and water adsorption calorimetry were used to determine the surface enthalpy of these materials. The surface enthalpy increases linearly with yttrium concentration in the studied composition range. Using previously published surface enthalpy values for monoclinic hafnia and tetragonal zirconia and the surface enthalpy of YSH with the lowest yttrium concentration to approximate that of pure cubic hafnia, the stability crossovers for HfO2 polymorphs are derived.
ACKNOWLEDGMENT
This work is supported by the U.S. Department of Energy, Office of Basic Energy Sciences under Award DE-FG02-03ER46053. We thank Fen Xu, Sarah Roeske and Brian Joy for electron microprobe analysis.