1 Introduction
Public pension systems raise sustainability and adequacy concerns that often seem at odds. In particular, many reforms undertaken for recovering financial sustainability reduce the generosity of pension benefits. In the EU15 countries, the fraction of elderly at risk of poverty displays a generally increasing trend among countries in which the social security system is under reform. In Italy, for example, the poverty rate increased from 18% in 1996 to 22% in 2007 (Eurostat, 2009).
Italy has experimented with various solutions to reform its unsustainable defined benefit (DB) public pension system. The first reform in 1992 set up a modified DB system in which pension benefits were linked to lifetime average earnings and eligibility requirements were tightened. The second major reform in 1995 designed a notional defined contribution (NDC) system the main principles of which were a pension benefit based on contributions paid and on life expectancy, with very flexible eligibility requirements. While ensuring long-term sustainability, the 1995 reform set up a long transition process. The third major reform in 2008 considerably tightened the age requirements to claim a pension, enhancing sustainability also in the short run.
The Italian social security reform process constitutes a sort of natural experiment for analysing the consequences of various pension regimes. Our paper studies the different incentives to retirement implicit in the various pension systems, as well as the adequacy and the redistributive properties of the regimes progressively redesigned by the reforms. Two different branches of the economic literature analyse this topic. The first one focuses on the analysis of the economic determinants of retirement behaviour, while the second focuses on the simulation of the effects of pension reforms (on distribution, sustainability, etc.). Usually the second line of research builds microsimulation models endowed with very simple (and nonbehavioural) rules for retirement, for example assuming that individuals retire as soon as eligible (Borella and Coda Moscarola, Reference Borella and Coda Moscarola2006) or aligning the exits to the observed patterns (Mazzaferro and Morciano, Reference Mazzaferro and Morciano2005; Dekkers et al., Reference Dekkers, Buslei, Cozzolino, Desmet, Geyer, Hofmann, Raitano, Steiner, Tanda, Tedeschi and Verschueren2009; Richiardi and Leombruni, Reference Richiardi and Leombruni2006). Social security rules are, however, expected to influence the optimal working and retirement paths by both constraining retirement decisions into a specific range of possible retirement ages and generating financial incentives to retire at later ages.
The retirement behaviour literature accounts for the role played by financial incentives embedded in the pension rule, reconciling the empirical evidence with life-cycle theory. Coile and Gruber (Reference Coile and Gruber2000) for the United States, Baker et al. (Reference Baker, Gruber and Milligan2003) for Canada, Blundell et al. (Reference Blundell, Meghir and Smiths2002) for the United Kingdom, and Belloni and Alessie (Reference Belloni and Alessie2009) for Italy, just to name a few, all find that individuals' retirement choices do respond to financial incentives embedded in the public pension system, as well as to social security wealth. In particular, the absence of age-related incentives to retire in defined contribution plans has been found to lead US workers to retire almost two years later compared with workers under DB plans (Friedberg and Webb, Reference Friedberg and Webb2005).
Our study simulates the effects of the major social security reforms undertaken in Italy during the last 20 years, adding to the literature on microsimulation by accounting for individuals' reactions to financial incentives when deciding to retire. For this purpose, we use a cohort microsimulation model in which retirement behaviour is treated in a probabilistic way using the retirement decision rule estimated by Belloni and Alessie (Reference Belloni and Alessie2009) for Italian workers. We compare these results with a minimum retirement age scenario, in which individuals retire as soon as possible (nonbehavioural scenario). This methodology allows us to disentangle the effects of the increase in the minimum age requirements to qualify for a pension (as can be seen in the nonbehavioural scenario) from the effects of the change in the financial incentives to retirement embedded in the pension formulae (the behavioural scenario).
We find that shifting from a generous defined benefit (DB) system to an actuarially fair notional defined contribution (NDC) system induces individuals, particularly men, to postpone retirement. Voluntary postponement of retirement would grant employees a replacement rate comparable to that obtained in the pre-reform DB regime, while the self-employed experience a substantial reduction in their replacement rate.
This paper is organized as follows. Section 2 reviews the main features of the pension reforms that occurred between 1992 and 2009, focussing on the main three reforms that deeply changed the financial incentives to prospective retirees. Section 3 describes our microsimulation model and specifies the main hypothesis underlying our simulation exercise. Section 4 shows the simulated effects of the various pension regimes on the average age of retirement, adequacy issues, and redistribution. Section 5 presents our conclusions.
2 The Italian pension system
In the last two decades, the Italian pension system has undergone a number of major reforms, all directed to recover long-term sustainability. Indeed, the pre-reform (pre-1992 in what follows) system was characterized by a DB pension formula based on the last few years of earnings combined with soft eligibility rules, without any actuarial correction for age at retirement (see Table 1).
Main characteristics of the pension reforms in Italy

The first reform, which took place in 1992, set new – and more stringent – eligibility requirements while preserving the DB system. After the transition phase, pensionable earnings were based on the entire worker's earnings history and revaluated at the nominal GDP growth rate. No actuarial correction for age at retirement was provided for, but the pension indexation mechanism was downgraded from wages to prices. Such an indexation mechanism has been since maintained by all subsequent reforms.
The reform approved in 1995 rescheduled a new (and long) transition towards an NDC formula. The NDC formula harks back to actuarial fairness principles. Benefits are commensurate with the amount of payroll taxes paid, capitalized at an interest rate equal to GDP's rate of growth and annuitized according to life expectancy at retirement. Accessibility to retirement was made more flexible. Individuals were entitled to retire from the age of 57 onwards, subject only to the constraint of having a pension higher than 1.2 times the minimum old age allowance.Footnote 1 Subsequently, adequacy concerns drove the introduction of incentives for private sector employees and self-employed workers to start contributing to private pension plans (Budget Law, December 2006).
Finally, the 2008 reform stepped in to modify the NDC regime. From 2008 onwards, the age requirement to claim a seniority pension has been gradually raised. For younger cohorts of workers completely under the NDC regime – such as the ones we consider in our study – the minimum retirement age was raised to 60 for women and to 65 for men. At the same time, the possibility of claiming a seniority benefit has been reintroduced by imposing a complex system of requirements of age plus seniority (see Table 1).
3 The microsimulation model
Our analysis is conducted using CeRPSIM2, an updated and expanded version of CeRPSIM (Borella and Coda Moscarola, Reference Borella and Coda Moscarola2006). According to the taxonomy proposed by Bourguignon and Spadaro (Reference Bourguignon and Spadaro2006), CeRPSIM2 is a dynamic partial-equilibrium microsimulation model of the social security system, which relies on a behavioural rule for modelling retirement decisions.Footnote 2 It is designed to analyse the distributional features embedded in the Italian pension system during its transition from a DB to an NDC system. It is composed of three main modules: the population module, the pension module, and the retirement module.Footnote 3
The population module is designed to support a cohort population and is able to simulate lifetime patterns for individuals born since 1950. In this study, however, we focus on a single cohort born between 1991 and 2000 (with median year of birth 1995) and analyse its behaviour through subsequent reforms of the pension system. The advantage of this methodology is that different pension rules are applied to the same group of individuals, with the same working history, so that the outcomes vary only in response to the pension reforms. The simulated population evolves in accordance with a set of deterministic and stochastic elements conditional on individual socioeconomic characteristics. Particular attention has been devoted to modelling individuals' earnings paths as the sum of a group-specific deterministic component and an individual-specific stochastic component estimated from a panel of administrative data.
The pension module computes pension benefits according to the various pension regimes set up by Italian legislation up to 2008. This is a very detailed module able to compute pensionable earnings and contributions paid, check eligibility requirements, and compute the pension benefits for a number of schemes and different regimes. Pension benefits are computed for individuals who retire from the year 2000 onwards. The program is able to replicate the pre-1992-reform rules, as well as each of the subsequent reforms up to 2008.
The retirement module determines whether an eligible individual actually retires according to two alternative criteria. First, individuals are assumed to claim their pension benefit as soon as they are eligible. This requires not only that they meet the minimum age and seniority eligibility requirement, but also that they wait for an ‘exit window’ to become active.Footnote 4 This nonbehavioural criterion depicts the ‘minimum age’ scenario that we use as baseline.
Second, we model retirement behaviour in a probabilistic way using the retirement decision rule estimated by Belloni and Alessie (Reference Belloni and Alessie2009) on a sample of Italian workers during the period 1985–2000. Their probit estimates highlight the key role played by the economic incentives to retirement implicit in the pension scheme, in line with previous research for the United States (Gruber and Wise, Reference Gruber and Wise2004; Coile and Gruber, Reference Coile and Gruber2000; Baker et al., Reference Baker, Gruber and Milligan2003). Including this retirement behavioural equation in our microsimulation model allows us to define an ‘optimal age’ scenario to be compared with the ‘minimum age’ one.
Cohort definition and parameters
We simulate one cohort of individuals, born between 1991 and 2000 (hereafter cohort 1995, from the median year of birth). We calculate the main life events relevant for the retirement of about 12,000 heterogeneous individuals, about 6,000 of which are employed in the private sector or self-employed. We restrict our attention to these two categories of workers, as public sector employees and other minor schemes are not covered by our retirement behavioural equation. We then study the retirement outcome of this cohort under different retirement rules, as defined in our retirement module, and under different pension legislation.
To study the impact of the reforms on retirement behaviour, we show the results as if the pre-1992 system were still in place and then implement the main subsequent reforms one at a time. Therefore, our results show, for the same population, the effects of the DB system (pre-1992 system), the less generous modified DB system (the 1992 reform), the actuarially fair NDC system (the 1995 reform), and the NDC system with tighter minimum age requirements (the 2008 reform).
When we simulate the 2008 reform, we assume that all workers participate in the second pillar. Workers belonging to the private sector are assumed to automatically transfer their entire severance pay flows (6.91% of their gross wages) to pension funds from 2007 on; self-employed workers are also hypothesized to participate in the second pillar with a contribution rate equal to that of private employees.
Throughout all the calculations presented in this paper, we use a discount rate equal to 1.5% in real terms. As will be seen, this assumption helps in the evaluation of the long-term sustainability of the social security system. The rate of return of the pension fund is fixed at 2% in real terms, net of administrative costs. The real GDP growth rate and future inflation rate are set equal to 1.5% and 1.6%, respectively.
All the simulations are based on RG48 cohort mortality tables (see Appendix for a description) that are kept invariant over the projection horizon. The annuity rates for the computation of the pension benefits under the NDC rule are calculated accordingly. Minimum pensions, minimum contributions, and ceilings are indexed to nominal GDP growth.
Measures for adequacy and distribution analysis
We wish to study the effects of the introduction of a behavioural rule on individual retirement age, on the adequacy of the pension benefits received at that age, and on the distributive impact of the pension rules.
As a measure of adequacy we use the replacement rate (RR) calculated as the ratio between the first pension benefit and the average of the last three wages received by an individual. It is a measure of the level of benefits and of the ability to preserve purchasing power during retirement. While certainly not exhaustive, the RR can be a good starting point for exploring the adequacy of the pension system. In particular, low-income individuals, who would not have accumulated wealth, would need nearly a 100% net RR to avoid a drop in consumption after retirement (see Smith, Reference Smith2003).
As in Feldstein and Liebman (Reference Feldstein and Liebman2002), we interpret social security as an insurance provision against longevity risk and attribute any departure from actuarial neutrality to redistribution. The intergenerational distributive impact of the pension system is investigated by using the present value ratio (PVR), while the intragenerational one is explored through the so-called RS index proposed by Reynolds and Smolensky (Reference Reynolds and Smolensky1977). The PVR is the benefit-to-tax ratio; that is, the ratio between the present value of the pension benefits to be received and the present value of payroll taxes paid, both valued at retirement. If greater than 1 when calculated at an interest rate equal to the GDP's growth rate, then the system is granting to retired individuals more than would be justified in a pension system in financial equilibrium. The system is redistributing resources from (future) generations active in the labour market to currently retired ones.
The RS index is defined as the difference between the Gini coefficients of lifetime income under an hypothetical actuarially fair system and under the actual system. Since an actuarially fair system perfectly preserves the original distribution of lifetime income, the RS index measures the variation in the inequality of lifetime income induced by the actual pension system. If this variation is positive, the actual pension system is benefiting the less well off relative to the better off.
4 Results
Our results are based on the simulation of cohort 1995, to which we apply in turn the different pension systems devised by the reforms in Italy. As previously described, these reforms allow us to compare results under rather typical pension systems: a DB system with a benefit based on the last few earnings (pre-1992), a DB system based on average lifetime earnings (1992), an NDC system with a fair degree of flexibility in retirement age (1995), and, finally, an NDC system with stricter eligibility rules (2008).
The effect of the reforms on retirement age
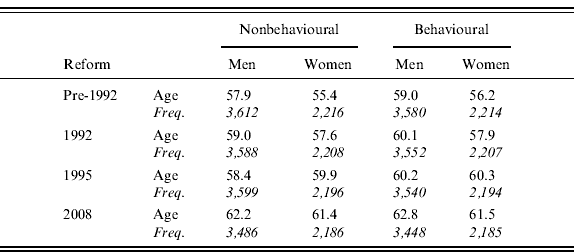
Table 2 shows the average retirement age of our population for each reform. Results are reported for both the nonbehavioural rule, which posits that each individual retires as soon as possible, and the behavioural model, which adopts the behavioural rule described above to assess whether an individual postpones retirement or not. The nonbehavioural results are useful to assess the effects of the minimum age requirements of each pension system considered, while the behavioural results depict the optimal ages of retirement under each regime. The effect of the changing financial incentives is observed by comparing the minimum (nonbehavioural) results with the optimal (behavioural) results.
Average age of retirement by reform, gender, and retirement rule

As reported in Table 2, the reform process unequivocally leads to a progressive rise in the average retirement age of individuals because of both the increase in the minimum age requirements to qualify for a pension (as can be seen in the nonbehavioural scenario) and the annullment of the financial incentives to early retirement (the behavioural scenario). According to the nonbehavioural results (first two columns in Table 2), the average minimum retirement age under the pre-1992 system would have been around 57.9 years for men and around 55.4 years for women, whereas after the 2008 reform these numbers are about 62.2 years for men and about 61.4 years for women.
When taking into account the choice of retirement (third and fourth columns in Table 2) – that is, the reaction of individuals to financial incentives and the role played by the preferences for leisure during old age – the average retirement age of workers rises further with respect to the minimum, under each scenario: after the 2008 reform the average age reaches 62.8 years for men – starting from 59 years under the pre-1992 system – and 61.5 years for women – instead of 56.2 years under the pre-1992 scenario.
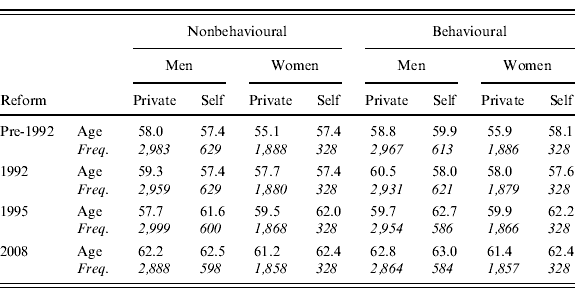
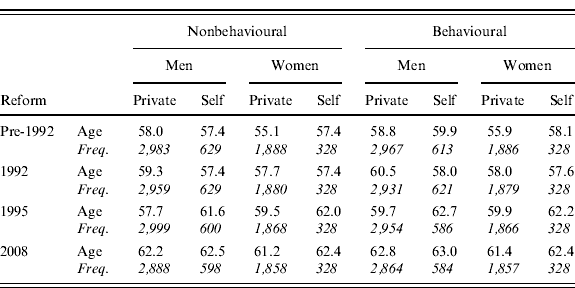
Beyond the expected conclusions about the increase in the average retirement age, further disentangling the results by working scheme reveals many interesting aspects that account for the great heterogeneity in the career profiles and pension rules of the self-employed and of employees (see Table 3). In particular, it is a common perception that, under the pre-1992 DB rule, the financial incentives to early retirement were so high that the retirement age coincided mostly with the age of eligibility. Our simulation results only partially support such a thesis. Under the pre-1992 scenario, the difference between the average optimal (behavioural) and minimum (nonbehavioural) retirement ages is about 0.8 year for male and female private employees and 0.7 year for self-employed women, while it reaches 2.5 years for self-employed men.Footnote 5 The minimum retirement age for the self-employed does not substantially differ by gender and is about 57.4 years, while the optimal retirement age is 58.1 years for women and 59.9 years for men. Among private employees, men display a minimum retirement age of about 58 years and an optimal one of 58.8 years, while women have the lowest retirement ages, the minimum age being 55.1 years and the optimal one being 55.9 years.
Average age of retirement by reform, gender, working scheme, and retirement rule
The motivation for this evidence is easily found in the life-cycle theory framework. Retirement decisions, in fact, depend on many factors, primarily individual preferences for nonworking time (leisure and time devoted to household production), marginal financial incentives to retire early, and expectations about future consumption needs. While the first two factors encourage the individual to anticipate retirement, the third one discourages it. The final outcome is a composite of these effects and, according to the results presented, the third factor appears here to more than compensate for the first two.
By tightening the eligibility requirements for the employees and by confirming the previous requirements for the self-employed, the 1992 reform raises the minimum (nonbehavioural) retirement age of the former leaving the one of the latter unchanged.Footnote 6 Nevertheless, it also changed the financial incentives to retirement, the direction and magnitude of such a change depending on the shape of the earnings profile for each category of workers considered. In particular, male employees react to these incentives by postponing their retirement on average by 1.2 years with respect to the minimum age, reaching an average optimal (behavioural) retirement age of 60.5 years. On the other hand, female employees and the self-employed (both men and women) voluntarily postpone their average retirement age by at most 0.6 year, so that the incentive to postpone for them is less than under the previous system (especially in the case of self-employed males). The optimal retirement age under the 1992-reform decreases with respect to the pre-1992 reform to 58 for both self-employed men and private employees women and to 57.6 for self-employed women.
The 1995 reform, together with a less generous pension benefit computed according to an NDC system, introduced flexibility in the retirement age after the age of 57. Workers with pension benefits below a certain threshold (1.2 times the income support for the elderly), however, cannot retire before turning 65. This rule explains the average minimum (nonbehavioural) retirement age displayed in Table 3: while for male employees it is lower with respect to the previous DB systems (57.7 instead of 59.3 years under the 1992 reform), for all other categories the reverse is true, meaning that is more likely for these categories to accrue a low pension benefit and be forced to postpone retirement.Footnote 7 In particular, the minimum average retirement age reaches 59.5 years for female employees, while that for self-employed men and women is 61.6 and 62 years, respectively.
As for the behavioural response, the relative strength (and eventually the direction) of the forces driving retirement decisions are expected to change deeply under the NDC system, which removes the financial disincentives to work typical of a DB system. In particular, it is a common perception that under the more strictly defined contribution rule of the 1995 reform, individuals will tend to postpone retirement well beyond the minimum retirement age (even more than before), despite the lower minimum age requirement to access pensions. Our simulations confirm such a thesis for men but find scant evidence for women. The average optimal age for men is in fact two years higher than the minimum for private employees and one year higher for the self-employed, while for women the gap reduces to less than half a year (0.5 year for employees, 0.2 year for the self-employed).Footnote 8
Finally, Table 3 further allows us to understand if the constraints on the minimum retirement ages imposed by the 2008 reform will be binding. To answer this question we have to compare the optimal (behavioural) average age under the 1995 reform with the minimum (nonbehavioural) average age under the rules of the 2008 one.Footnote 9 According to our results, the 2008 reform is expected to be binding for private employees, whose optimal retirement age under the 1995 system is lower than the minimum retirement age required after the 2008 reform. The average optimal retirement age expected under the 1995 regime is in fact 59.7 years for male employees and 59.9 years for female employees. The minimum retirement age under the 2008 regime is higher and equal to 62.2 years for men and 61.2 years for women.
In contrast, the 2008 reform does not seem to be binding for the self-employed men and only very slightly binding for women. The lower contribution rates of the self-employed coupled with the NDC system (both the 1995 and 2008 systems) will lead these workers to accrue lower pension benefits, and adequacy concerns will push them to work longer. Indeed, the average optimal retirement age expected under the 1995 regime is 62.7 years for males and 62.2 years for females, while the minimum age under the current regime is 62.5 years for men and 62.4 years for women.
Adequacy
The debate on the effects of the NDC reforms is focussed on the question of the adequacy of the pension benefits even more than on the average retirement age. The common perception is that the Italian DB system is adequate from the point of view of the level of the benefits provided, while the NDC system is not. In order to assess the adequacy of the different pension systems, Table 4 shows the median and mean replacement rates (RR) granted to our simulated workers under the different reforms, computed as the ratio of the first pension benefit to the average of the last three years of earnings.Footnote 10 We assume that earnings and pension benefits are a good approximation of living standards before and after retirement. While consumption would probably be a better proxy, it is not computed in our microsimulation model; for a detailed discussion of RR criticalities, see Borella and Fornero (Reference Borella and Fornero2009).
Replacement rates by reform, scheme, gender, and retirement rule

Note: Replacement rates are calculated as the ratio between the first pension benefit and the average of the last three wages received by an individual. All figures are gross of income and payroll tax rates.
Focussing on the behavioural scenario in the right panel of Table 4, the pre-1992 system would grant our simulated workers an RR in the range of 65% to 73%, while after the 1992 reform the median RRs tend to increase by about 1–5 percentage points.Footnote 11 This happens not only because the minimum retirement age tends to increase, but also because under the 1992 formula the revaluation coefficients of the lifetime earnings are higher than the ones adopted in the previous system. Despite the longer reference period for the computation of the pensionable earnings characterizing the modified DB formula, flat-earnings careers benefit more from the revaluation coefficients. As a consequence, female employees face the highest increase in RR.
With the 1995 reform – that is, with the NDC system – the RR granted for each year of contribution is lower, especially at younger ages. The median behavioural RR for private employees under the 1995 system is about 54% for both men and women. Self-employed workers show a greater reduction in their RRs, which fall to 38% and 41% for women and men respectively. This reduction is due to their lower payroll tax rate – 20 versus 33% for employees – which was unaccounted for by the DB system, although it plays an important role in the NDC system.
By increasing the retirement age, the 2008 reform raises the RR for all the categories considered. The median behavioural RR for private employees reaches a value equal to 66% for men and almost 60% for women. The change in the degree of adequacy of pensions for private employees appears to be only partially threatened by the less generous defined contribution rule. The median RR for men is almost equal to that attained in the pre-reform system, while the one for women is about 5 percentage points lower. As for the self-employed, the adoption of an NDC rule, coupled with their lower contribution rate, results in median RRs close to 40%; that is, about 20–30 percentage points lower than in the pre-1992 regime.
Right after the introduction of the NDC system, adequacy concerns induced legislation to stimulate the contribution to a second pillar component. Adhesion to the second pillar (that we apply to workers under the 2008 reform only) can help in maintaining adequate pensions because of both the flows of additional contributions and the higher expected rate of return granted by the pension funds with respect to the public system (2% market rate versus 1.5% economic growth). Under the hypothesis of a contribution rate of 6.91% of the working income, the additional RR granted is around 12–14 percentage points. As reported in Table 4, the optimal comprehensive RR (first plus second pillar) would then attain a level of about 71–79% for female and male private employees and 51–57% for the self-employed. Of course, this comes at the price of being fully in charge of the financial risk characterizing the second pillar and, for employees, of renouncing the option of receiving severance pay as a lump sum at retirement. The first official data after the reform, however, show that participation in the second pillar has been quite limited: The adhesion rate of employees in 2007 was 24.9% and the total number of participants, including the self-employed, was only 4.5 million (Covip, 2008).
The RRs reported in Table 4 are gross of income and payroll taxes. The payroll tax rate is, however, very different for the two categories of workers considered. As already mentioned, private employees are subject to a payroll tax equal to 33% of their gross wage; however, only one-third of the burden is in the worker's charge since the remaining two-thirds are paid by employers; that is, the payroll tax in the employer's charge constitutes a sort of extra payment, not accounted for in the gross wages.Footnote 12 Self-employed workers are instead subject to a payroll tax rate of 20% of their income, obviously fully in their charge.
If we compute the RRs on income net of the contributions paid by the worker (that is, gross of income tax only), we then expect a general increase in their level and a reduction in the difference between the RRs of private employees and the self-employed. As reported in Table 5, the median comprehensive (first plus second pillar) behavioural RRs under the 2008 reforms become equal to 89% and 80% for male and female private employees, respectively, and 71% and 63% for male and female self-employed, respectively.
Net replacement rates (no payroll taxes)

Note: Net replacement rates are calculated as the ratio between the first pension benefit and the average of the last three wages received by an individual. Wages are net of payroll tax rates (gross of income tax only).
Assessing the pension system's distributive properties
To synthesize the pension systems' distributive impact, Table 6 reports the present value ratio (PVR) and Table 7 shows the Reynolds–Smolensky (RS) index.
Median PVR by gender, scheme, and income quartiles – behavioural scenario
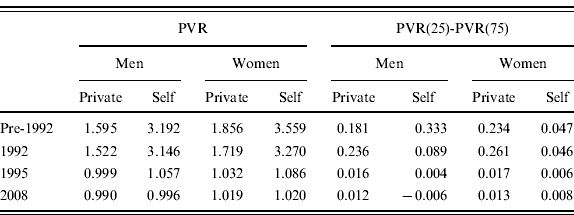
Note: PVR is the present value ratio, the ratio between the present value of the benefits that the worker will receive in the future and the present value of the contribution paid during his working life, both valued at retirement. The income quartiles are determined on the basis of the lifetime labour income valued at birth. The PVR for the lowest income quartile is PVR(25), while the PVR for the highest one is PVR(75).
Reynolds–Smolensky index by reforms (*100) – behavioural scenario

Note: The Reynolds–Smolensky index is the difference between (i) the Gini coefficients of lifetime income under an hypothetical actuarially fair system (i.e. the Gini index computed on permanent labour income only) and (ii) the Gini under the actual system (the Gini index computed on permanent labour income plus the social security wealth).
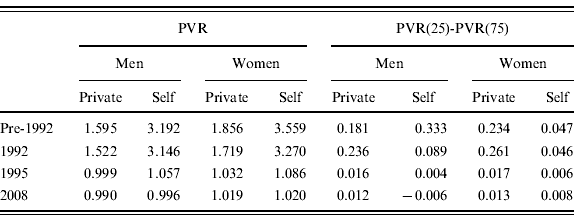
The pre-1992 Italian pension system was highly generous and highly redistributive. As shown in Borella and Coda Moscarola (Reference Borella and Coda Moscarola2006), such a redistribution was both good – that is, directed towards low-income individuals – and bad – that is, directed towards high-income individuals. The NDC system will instead be almost actuarially fair, granting an internal rate of return of about 1.5% in real termsFootnote 13 and cancelling out almost all the redistribution. As shown in the left panel of Table 6, in the pre-reform system, the PVR of private employees is around 1.6–1.9 and that for the self- employed is around 3.2–3.6. In other words, that DB system is granting benefits to workers about two to three times higher than what they paid in terms of contributions, redistributing from future to current generations. Under the NDC systems (1995 and 2008), the PVR decreases instead for all categories to values ranging between 0.99 and 1.2; that is, it is very close to the actuarial equality between contributions paid and benefits received. This equality also indicates that, as long as the expected value of the long-term real GDP growth embedded in the annuity rates is realized without systematic errors, the NDC system is financially sustainable in the long run.Footnote 14
The second panel of Table 6 shows the difference between the average PVR in the lowest and in the highest income quartile, as a measure of progressivity of each pension system. In the pre-1992 system, such a difference for private employees is about 23 percentage points for women and 18 percentage points for men. For self-employed men this difference is even higher, at 33 percentage points, while for women, on the contrary, it is only about 5 percentage points. This is a consequence of the fact that in the pre-1992 system the PVR granted to self-employed women was quite high at all lifetime income levels.
The 2008 system, despite the general reduction in redistributive impact, is also slightly progressive thanks to the minimum old-age allowance to which low-income pensioners are entitled. The gap in the PVR of employees in the lowest income quartile with respect to that in the highest income quartile is 1.2–1.3 percentage points. For the self-employed, it is instead virtually equal to zero; more precisely, for men it is slightly negative, meaning that the system becomes somewhat regressive for them.
Table 7 reports the RS index that measures the (eventual) reduction in the income concentration index brought on by the pension system. A positive RS index indicates that the pension system is redistributing from the rich to the poor, since it reduces lifetime income inequality.Footnote 15
The overall effect of the first pillar pension system in reducing the income concentration index ranges between 2.33 and 2.70 percentage points in the DB systems (i.e., pre-1992 and 1992 systems), while it is negligible under the NDC systems (0.34 and 0.26 percentage points in 1995 and 2008). The second pillar, being actuarially fair, grants a PVR equal to 1 (and for this reason it is not reported in the tables of this section) and, given the hypothesis about the equality of the contribution rate among different schemes, does not change the overall redistributive impact of the pension system.
5 Conclusions
This paper contributes to the literature on the adequacy and redistribution of pension systems. We focus on the case of Italy, since it underwent three main pension reforms during last 20 years with the aim of recovering long-term financial sustainability. Italy shifted from a generous DB system – characterized by a short period for computing pensionable earnings and very low age/seniority requirements to attain eligibility – to a stricter DB – with a longer reference period for the computation of pensionable earnings and higher age/seniority eligibility requirements. Italy then designed an actuarially fair NDC system with flexible access to retirement – from the ages of 57 to 65 – and, finally, shifted to a modified NDC with stricter age/seniority requirements. In particular, the effects of this last reform have not been studied much.
We approached the problem by adopting a microsimulation perspective. We built CeRPSIM2, an upgrade of our previous cohort dynamic microsimulation model (Borella and Coda Moscarola, Reference Borella and Coda Moscarola2006), in which we accounted for optimality in the individual choice of retirement age by including a behavioural rule for retirement. We then simulated the effects of different pension systems – as shaped by the various Italian reforms – on a cohort of individuals, born in 1995. We modelled retirement according to two different rules: a nonbehavioural approach, in which workers retire as soon as they become eligible, and a behavioural approach, in which workers retire when their utility is at a maximum.
The comparison between the behavioural and nonbehavioural approaches in modelling retirement decisions allows us to better infer many consequences of the various pension systems. It is a common perception that shifting from a generous DB system to an NDC system induces individuals to postpone retirement in order to preserve the adequacy of their pension benefits. Our research confirmed this, but also highlighted two additional and probably lesser-known facts. Actually, the pre-reform scenario already contained incentives for some categories to postpone retirement. This was the case, in particular, for self-employed men who, despite the generosity of the pre-reform pension rule, were entitled to low pensions and postponed retirement for adequacy reasons. Second, women tend to always postpone less than men, demonstrating a higher preference for nonworking time. The absence of any intervention policy to help women in child care or adult care duties may be a cause. The ages around retirement are indeed the ones where the risk of having to provide care to elderly parents or look after grandchildren is highest.
By tightening eligibility requirements, the 2008 reform is expected to be binding for private employees, whose optimal retirement age under the 1995 system is lower than the minimum retirement age required after the 2008 reform. It is not binding, however, for the self-employed, who would choose any way to postpone retirement in order to increase their – otherwise very low – pension benefits.
Concerning the adequacy of benefits, we found that voluntary postponement of retirement and, above all, participation in the second pillar would grant employees a comprehensive RR (first plus second pillar) higher than the one obtained from the sole first pillar in the pre-reform regime. Of course, this comes at the cost of renouncing severance pay and accepting the financial risk characterizing pension funds. As for the self-employed, first pillar RRs are greatly reduced by the NDC reform, which links benefits to contributions paid. Even after considering delayed retirement and participation in the second pillar, the net replacement rates for self-employed are about 20 percentage points. lower than the (very generous) pre-reform system.
Finally, we analyse the redistributive impact of the various pension systems. The pre-reform DB system is far more generous and redistributive than the NDC one; however, the pre-1992 social security system had a small impact in modifying the Gini concentration index of lifetime income, indicating that the system was only moderately progressive. The NDC system, being inspired to actuarial fairness, has instead almost no effect on lifetime income distribution.
We would like to thank Chiara Monticone for her help in updating CeRPSIM to legislative evolution and two anonymous referees, Elsa Fornero, participants to the 4th Euroframe Conference (Bologna, Italy), and participants to the CEPS conference on Microsimulation Models (Brussels, Belgium) for useful comments. We gratefully acknowledge financial support from MIUR (PRIN 2006) and Fondazione CRT.
Appendix – The microsimulation modelFootnote 16
CeRPSIM2 is a microsimulation model designed to analyse the distributional features embedded in the Italian pension system during its transition from a DB system to an NDC system. It is composed of three main modules: the population, pension, and retirement modules.
A1 The cohort population module
The module includes a demographic section and a labour market section, which simulate all the main life events of individuals. Individuals' transitions across different states (marital status, labour status, etc.) are conditioned on individual socioeconomic characteristics and are modelled throughout a Monte Carlo procedure; that is, they are evaluated by performing a random draw from a uniform distribution and comparing it to the relevant probability taken from available sociodemographic surveys or from national statistics data. If the value of the draw is higher than the sample probability, the individual changes his status; if not, the individual remains in the initial state.
Once individuals are born, their lives evolve according to various routines which determine the day and month of birth, gender, region of residence, performance in the labour market, family status, and survival. We illustrate these routines in turn after briefly describing the data sources used.
Data sources
Transition probabilities are drawn from the national statistics (Istituto Nazionale di Statistica, ISTAT) data and from two national micro datasets: the Bank of Italy's Survey of Household Income and Wealth (SHIW) and a sample of administrative data drawn from the main social security scheme (Istituto Nazionale di Previdenza Sociale, INPS) archive.
The INPS archive officially records the complete earnings and contribution histories of all participants, that is employees in the private sector and some categories of self-employed (craftsmen, tradesmen, and farmers). The available sample is formed by all individuals born on March 5 – so that the theoretical sample frequency is 1:365 – and reports employment spells from 1985 to 1998. The archive contains very rich information about the earnings histories of the workers, recording spells of unemployment as well as labour income earned each year.
As typical with administrative data, demographic information is, on the other hand, less rich. The sample records the date and province of birth of the worker, as well as gender. No information about family status is available, or about the education level of the worker. For this reason, we complement it with information contained in the SHIW, which is run about every two years since 1989 to 2006 on a representative sample of Italian households.
Life-invariant characteristics
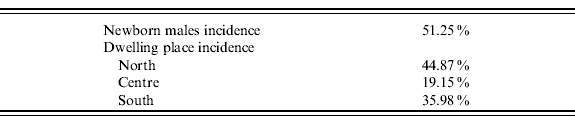
At the beginning of the simulation of each cohort, a user-set number of individuals aged 0 are created. The life-invariant characteristics routine randomly assigns each individual a date of birth, gender, and region of residence through a Monte Carlo procedure. In each cohort, the date of birth is uniformly distributed through the year: This feature of the program allows one to accurately model the moment when a worker is eligible to claim a pension benefit according to the so-called exit windows (which are indeed linked to the date of birth). Gender and region of residence are randomly assigned according to the gender and the regional distribution of newborn in the year 2002 (ISTAT, 2003a).

Mortality
In each time, every individual enters the mortality subroutine, which determines whether that individual will survive or not in the simulated time period on the basis of gender-specific mortality tables. Individuals who are predicted to die in the simulated year still enter all subsequent routines until the cycle for the year in progress is completed. Afterwards, they are recorded as dead and are no longer taken into account in the population routines.
All our simulations are based on RG48 mortality tables. These are cohort mortality tables elaborated by the State General Accounting Department (Ragioneria Generale dello Stato, RGS). They originally refer to the cohort born in 1948 but can be extended to future cohorts by the provided age-shifting formulas.
Education
In the program, individuals are forced into school until they turn 17 (that is, they complete compulsory education). As recorded in the SHIW, the fraction of individuals who do not complete compulsory education for cohorts born after 1950 is low and tends to 0 for younger cohorts. In addition, according to Italian legislation, individuals cannot work before reaching the age of 16, which means that they cannot start contributing into the pension system before then.
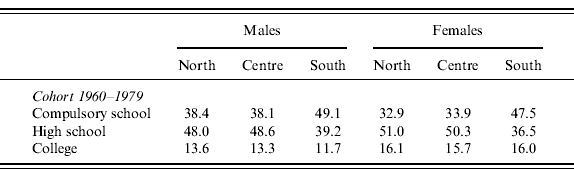
After completion of compulsory schooling, the individual decides whether to continue studying or not. The routine models this decision as a random process and the probabilities of getting a higher degree or a university degree are derived from the SHIW data. We assume that the 1995 cohort, whose behaviour is currently unobservable, will reproduce the same education shares of cohorts born between 1960 and 1979. Frequencies are allowed to vary according to gender and region of residence (north, centre, or south).
We do not account for school dropouts and once an individual decides to start a cycle of study, he or she completes it. This hypothesis is forced by SHIW data, which only report the highest educational degree achieved by each individual. Individuals who choose not to continue studying and individuals who complete their college enter the participation routine.Footnote 17
Education level by gender, region, and cohort (percentage)
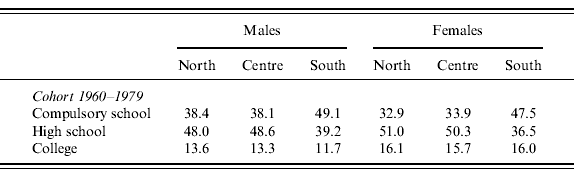
Source: SHIW, 2004–2006.
Participation
When individuals choose to no longer be students (or are forced to quit school by the program because they are university graduates), they decide whether or not to enter the labour force. This decision is modelled as a once and for all choice: if an individual decides to enter the labour force, that individual will remain active in the labour market until retirement (or death), possibly facing spells of unemployment. On the other hand, if an individual decides not to enter the labour force, he or she will remain forever out of it.
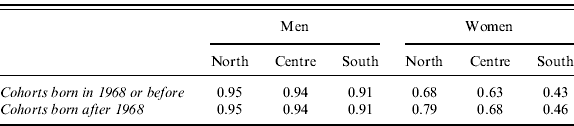
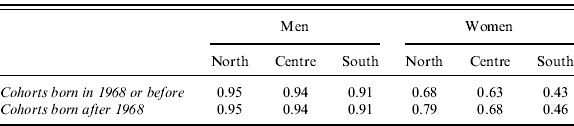
Participation rates are specific for cohorts (born before and after 1968), gender, and region and refer to the year 2002 (ISTAT, 2003b).
First job
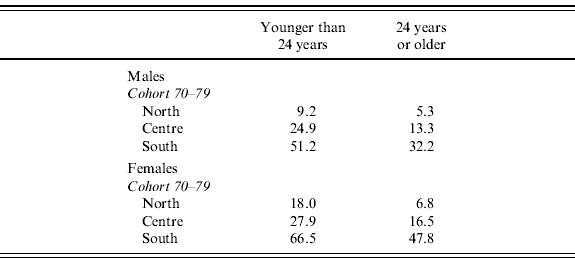
An individual joining the labour force for the first time enters the first-job routine. According to the observed probabilities, the individual can succeed in finding a first job in the current year. If a job is not found, the individual is recorded as not employed and will re-enter this routine in the following time periods. The probability of finding a first occupation is drawn from SHIW data for the only cohort for which this kind of information is available (individuals born between 1970 and 1979). We assume the same probabilities apply to the 1995 cohort. The probabilities also vary according to age class (younger or older than 24 years), gender, and region of residence (north, centre, and south). As the probabilities vary according to age class, we implicitly take into account the education level (college graduates enter the labour force after they turn 24).
Probability of unemployment conditional on looking for a first job (percentage)

Source: SHIW, various years.
Kind of employment and social security scheme
Once an individual finds an occupation, he or she is randomly assigned to a social security scheme and a professional qualification. These characteristics do not change throughout the individual's lifetime.
The assignment of the social security scheme proceeds in two steps: a first random draw determines to which of three main schemes the worker belongs: private sector employees), public sector employees, or self-employed. The relevant probabilities, computed from the SHIW data, vary according to region of residence (north, centre, or south), education level (mandatory school, high school, or university degree), gender, and cohort (born before or after 1960).
A second random draw determines the social security sub-scheme to which the worker belongs, when relevant: ‘regular’ private sector employee (86.7%) or agricultural worker (13.3%) if the main scheme is private sector employee and craftsman (40%), tradesman (40%), or farmer (20%) if the main scheme is self-employed. The appropriate frequencies are computed from our administrative data sample. Although a variety of different social security sub-schemes also exist in the public sector, all public workers are modelled as belonging to the main sub-scheme.Footnote 18
A third random draw determines, where relevant, whether the individual is white collar or blue collar, conditional on the individual's scheme. Individuals who start working before age 18 are registered as blue collar, individuals who start working after that age have a probability of 35% of being blue collar in the private sector and of 10% of being blue collar in the public one.Footnote 19 These frequencies are computed from the administrative data (SHIW for public sector workers) without any further sub-grouping, since the number of observations at this level of disaggregation is limited.
Number of weeks
Conditional on having a job and on the number of weeks worked in the previous year, this routine determines the number of weeks worked.
We compute sample frequencies separately for private employees and employees in the agricultural sector. To do so, we take two steps: we first discretize the number of weeks worked each year in our administrative panel into six classes (0, 1–13, 14–26, 27–39, 40–47, 48–52) and then we compute transition probabilities for each age class (16–24, 25–34, and 35–64) and for each region (north, centre, and south).
For the self-employed, we assume that, conditional on working, they work 52 weeks per year.Footnote 20 Using our administrative sample, we compute the probabilities of being unemployed conditional on the past year's employment status. These probabilities vary according to age (in classes), gender, and region of residence.Footnote 21
Public sector employees do not face unemployment spells: on the one hand, we lack data to compute unemployment probabilities for this group of workers; on the other, it seems a reasonable assumption given the stability of work relationships in the Italian public sector.
Earnings
Earnings profiles have been estimated on administrative data separately for private sector and self-employed workers, men and women, white and blue collar.Footnote 22
The estimated equation is


where x it is a vector of individual characteristics, including a constant, a polynomial in age (third degree for self-employed, fourth degree for employees), cohort dummies (cohorts 1935, 1945, 1955, 1965, 1975), regional dummies (north, centre, south), and time dummies, which are assumed to sum to zero and be orthogonal to a time trend.
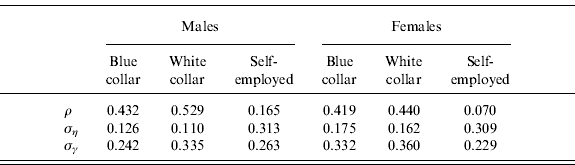
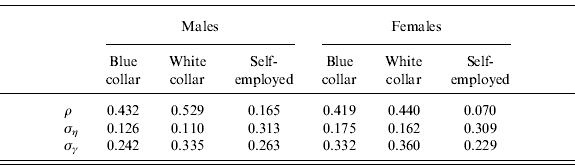
The unobserved component is assumed to be the sum of a random effect (γi) which does not vary over time and is uncorrelated with the explanatory variables included in the equation, plus an AR(1) component with parameter ρ. The AR(1) process plus an individual random effect has been found to be a good characterization of the unobserved component of earnings in Italy in previous work (Borella, Reference Borella2004).
In the microsimulation model, each individual is given an average log earnings profile for his or her age and group (defined by cohort, gender, region, and occupation) plus an error term formed by the sum of the two unobserved components. The first one is drawn from a normal distribution with variance σγ2 at the beginning of active life and it permanently shifts up or down the average profile for the individual to whom it refers. The second component, which is also individual specific and varies over time, is formed by the shock from the previous period times the autoregressive parameter ρ plus an error term drawn from a normal distribution with variance ση2.
Estimates for unobserved error components
Source: Authors' calculations based on SHIW, various years.
Marital status
In this routine individuals are recorded as children (as opposed to heads of households) until they finish their schooling years. When they are between 14 and 50 years of age, provided they are no longer students, they may get married according to the gender- and age-specific probabilities available from the 1991 census data. Conditional on being married, an individual faces the possibility of becoming divorced (probabilities also available from 1991 census data) or widowed according to the mortality table used in the program. It should be noted that we do not explicitly model the spouse or his or her income. Marital status becomes relevant, however, when computing individual social security wealth.
A2 The pension module
The pension module is a very detailed module able to compute pensionable earnings and contributions paid, check the eligibility requirements, and compute the pension benefit for a number of schemes and for different regimes. Pension benefits of the first and second pillars are computed for individuals who retire from the year 2000 onwards.
The program is able to replicate the pre-1992-reform regime as well as each of the subsequent reforms, up to 2008. As described in the main text, the most important ones are (1) the 1992 reform, which modified the DB regime, (2) the 1995 reform, which introduced the NDC scheme, and (3) the 2008 reform, which tightened eligibility requirements. In addition, the same module computes the minimum pension – applying to retirees in the DB system – and old-age income maintenance – applying to nonretirees in the DB system and to all individuals in the NDC scheme.
The schemes covered, as already mentioned, are private sector employees, employees in the agricultural sector, public sector employees, and the self-employed, the latter categorized into craftsmen, tradesmen, farmers, and farmers in disadvantaged regions. All these schemes differed greatly in eligibility rules, payroll taxes, and the computation of benefits until the 1995 reform imposed uniformity. The equalizing process, which has been gradual, is at present almost complete. Differences in the definition of pensionable earnings (or income) and in payroll tax rates are nonetheless also maintained in the future.
This module further computes for each individual the present value of payroll taxes paid during the whole working life and the present value of the pension benefits to be received. These two quantities are the building blocks for various money's worth measures used in both the retirement module and our analysis. Finally, this module computes a measure of permanent income, defined as the present value at birth of lifetime working incomes.
A3 The retirement module
This module is able to simulate the retirement decisions of individuals according to two alternative criteria.
According to what we named the nonbehavioural scenario, individuals are assumed to claim their pension benefits as soon as they are eligible. This requires not only that they meet the minimum eligibility requirement, but also that they wait for an exit window to become active.Footnote 23
Second, we model retirement behaviour in a probabilistic way using the coefficients of the probit estimates by Belloni and Alessie (Reference Belloni and Alessie2009). Their estimates are based on a sample of Italian administrative data (such as the one we use to estimate earnings profiles), which includes complementary files. The strength of their work lies in the availability in their data of actual seniority at retirement. This information allows one to precisely estimate the effect of money's worth measures on the probability of retirement. The authors use data covering the period 1985–2000 and provide separate estimates for males and females. The main money's worth measures used in these estimates are the present value of pension benefits (PVB) and the peak value (PV), defined as the maximum forecasted accrual at each age. In particular, the present value of pension benefits for an individual of age a evaluating retirement at the same age a is defined as

where T is the life span, ρ is the discount factor at age s (which includes the real interest rate, the conditional survival probability, and accounts for survivor benefits), and B(s) is the pension benefit received at age s. The present value of benefits for a worker of age a who evaluates retirement at a subsequent age h takes into account the contributions that are still to be paid

where the discount factor used for contributions ρ′ includes the real interest rate and the conditional survival probability. The peak value, used as a measure of marginal incentive in the probit specification, is defined as

that is the maximum accrual forecast at age a up to the maximum age of retirement R – assumed to be 70 years both in Belloni and Alessie (Reference Belloni and Alessie2009) and in our simulations.
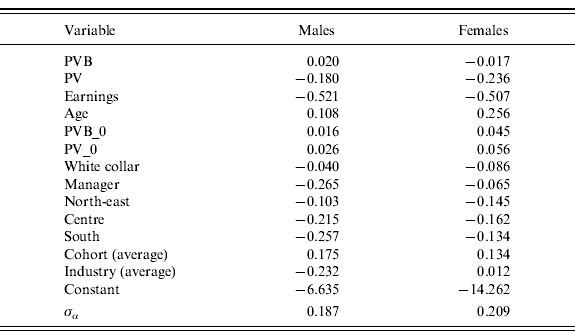
Since Belloni and Alessie's (Reference Belloni and Alessie2009) estimates are based on PVB and PV evaluated in 2006, while our workers are born in 1995 and retire after 2030, we scale back to 2006 our PVB and PV measures (as well as other monetary variables) in order to take into account inflation and economic growth. Other covariates include occupation and geographical area; the coefficients we use are reported in Table A6.
Probit estimates for the probability of retirement

Note: Probit coefficients from Belloni and Alessie (Reference Belloni and Alessie2009) : dependent variable=1 if a worker decides to retire,=0 otherwise; specification with PV and no age dummies. We use the average of the coefficients for the cohort as we have only a single cohort (not covered in the estimates) and we specify no industry in our artificial population. Here PVB_0 and PV_0 are the present value of benefits and the peak value in the first year of eligibility, respectively, and are included to account for the correlation between unobserved heterogeneity and explanatory variables (i.e., a quasi-fixed effect approach is used). The uncorrelated part of the unobserved heterogeneity is α with standard deviation σα reported in the table.