

Individual involvement in physical activity for improved health or exercise training for competitive sporting events (e.g., running races, charity walks) has dramatically increased over the last 5 years (Scheer, Reference Scheer2019). The research examining physical activity or exercise often treats these types of fitness workouts interchangeably. However, for some time scholars have called for an increased understanding of the distinct physical activity types (Caspersen, Powell, & Christenson, Reference Caspersen, Powell and Christenson1985). On the one hand, physical activity is a general term that describes ‘bodily movement produced by skeletal muscles that result in energy expenditure’ (Caspersen, Powell, & Christenson, Reference Caspersen, Powell and Christenson1985, p. 126) and is measured through mode (type), volume (frequency), and intensity of physical activity (Calderwood, Gabriel, Rosen, Simon, & Koopman, Reference Calderwood, Gabriel, Rosen, Simon and Koopman2016; Powell, Paluch, & Blair, Reference Powell, Paluch and Blair2011). Individuals often engage in physical activity in hopes of meeting personal health goals. On the other hand, exercise is a particular type of training for a sporting event or competition. As such, exercise is a sub-type of physical activity that is goal-directed towards a specific purpose, such as training for a competitive sporting event (Powell, Paluch, & Blair, Reference Powell, Paluch and Blair2011). Thus, examining the distinctions between individual involvement in different physical activity types, namely regular physical activity versus exercise training is warranted.
Important to the workplace, the time individuals allocate to physical activity may lessen the time or energy given to their work performance. A growing body of organizational research seeks to understand the role and impact of the physical activity types on employees' performance outcomes (see Calderwood, ten Brummelhuis, Patel, Watkins, Gabriel, and Rosen, Reference Calderwood, ten Brummelhuis, Patel, Watkins, Gabriel and Rosen2021). In their review, Calderwood et al. (Reference Calderwood, ten Brummelhuis, Patel, Watkins, Gabriel and Rosen2021) developed the resource-based model of physical activity framework positioned in conservation of resources (COR) theory that explicitly considers the potential resource gains or losses that stem from employee participation in physical activity. Their conceptualization, drawing on Hobfoll's (Reference Hobfoll1989) original COR work, depicts how trade-offs in resources influence disparate individual responses to physical activity, and seeks to unpack the highly variable positive and negative results reported in the research examining the interface between physical activity and the workplace. This variability often stems from ambiguity in the distinct physical activity type examined and clouds our understanding of the associated value or trade-offs to other areas of life (Powell, Paluch, & Blair, Reference Powell, Paluch and Blair2011). As noted above, physical activity exists broadly as energy expenditure that results from skeletal movement; whereas exercise is subtype of physical activity where one trains to reach goals in a sporting event (Caspersen, Powell, & Christenson, Reference Caspersen, Powell and Christenson1985; Powell, Paluch, & Blair, Reference Powell, Paluch and Blair2011). An example of how these different physical activity types might impact employee outcomes differently may make these distinctions clear. Someone who engages in regular physical activity could perform strength training three times a week over their lunch hour. Someone who exercises to meet a particular goal might follow a training plan that requires more than 10 h of weekly physical activity to prepare for a competition. Thus, one purpose of our study is to examine the divergent outcomes that may spill over from employee participation in the different physical activity types.
In addition, different individual resources might be required when employees participate in the different types of physical activity. Specific to resources required for employee engagement in physical activity, Calderwood et al. (Reference Calderwood, ten Brummelhuis, Patel, Watkins, Gabriel and Rosen2021) explain how three categories of resources: physical (e.g., enhanced energetic state: Sliter, Sinclair, Cheung, and McFadden, Reference Sliter, Sinclair, Cheung and McFadden2014), affective (e.g., reduced depression: Mammen and Faulkner, Reference Mammen and Faulkner2013), or cognitive (e.g., improved attention: Wollseiffen et al., Reference Wollseiffen, Ghadiri, Scholz, Strüder, Herpers, Peters and Schneider2016) emerge from employees' engagement in physical activity. Adding to these three resources, we believe that employees' psychological states might be a fourth resource generated by physical activity. Hobfoll (Reference Hobfoll2002) positions psychological states as resources individuals consider valuable, primarily related to control, agency, or mastery in addressing issues at hand. In support of our purported fourth resource in the physical activity space, emerging literature demonstrates how physical activity might influence psychological states in the form of perceived passion (Luth, Flinchbaugh, & Ross, Reference Luth, Flinchbaugh and Ross2017) or feelings of competency (Oerlemans, Bakker, & Demerouti, Reference Oerlemans, Bakker and Demerouti2014) that might spill over to impact employees' workplace outcomes either positively or negatively. Furthermore, it may be hasty to assume there are always beneficial outcomes to one's psychological resources, especially when we factor in trade-offs (i.e., energy, time) that may arise from the different physical activity types. For instance, scholarly work has outlined the deleterious outcomes of obsessive training for competition (Luth, Flinchbaugh, & Ross, Reference Luth, Flinchbaugh and Ross2017), or how beneficial exercise recovery only occurs when employees are intrinsically motivated to exercise (Ten Brummelhuis & Trougakos, Reference Ten Brummelhuis and Trougakos2014). Thus, to extend the known psychological resources that might benefit employees in the physical activity domain, we consider one's grit, or perseverance and consistency of interest to reach a desired outcome (Duckworth, Peterson, Matthews, & Kelly, Reference Duckworth, Peterson, Matthews and Kelly2007). We surmise that employee grit might be influenced by their engagement in different types of physical activity and, in turn, as a psychological resource help employees' reach improved outcomes.
In summary, our research goals hope to extend our understanding of employee participation in physical activity in three ways. First, we address Calderwood et al.'s (Reference Calderwood, Gabriel, Rosen, Simon and Koopman2016) call to tease-apart the ‘multifaceted nature of employee physical activity’ (p. 1105) to discern the unique effect of employee participation in different types of physical activity in two different studies. This focus allows us to understand whether different modes of physical activity (i.e., regular physical activityFootnote 1 vs. exercise) represent a resource or demand that may influence job-related outcomes. Second, we position different types of physical activity as an antecedent to employee grit which may be associated with divergent employee outcome perceptions of career satisfaction and training stress. Examining grit in this capacity may elucidate a new type of resource, namely psychological resources, in Calderwood et al.'s resource-based model (Reference Calderwood, ten Brummelhuis, Patel, Watkins, Gabriel and Rosen2021). Lastly, we examine employee perceptions of career satisfaction and training stress, novel correlates of job performance in the occupational health domain, to understand the physical activity – job performance relationship better. Next, we offer theoretical support for our model.
Theoretical background
Scholars frequently use resource theories to position the trade-offs that may exist in employee participation in different physical activity types. COR theory describes resources as ‘objects, personal characteristics, conditions, or energies’ deemed necessary by a person (Hobfoll, Reference Hobfoll1989, p. 516). Without such resources, management scholars demonstrate how employees can experience increased levels of stress or demands (Bakker & Demerouti, Reference Bakker and Demerouti2007). In support of the COR theory, a body of research in work/family conflict and job burnout outlines how employees with (or without) resources can lead to experienced gains (or losses) (e.g., Grandey & Cropanzano, Reference Grandey and Cropanzano1999; Halbesleben, Reference Halbesleben2006). Similarly, we contend that employee participation in different types of physical activity (i.e., regular physical activity or exercise) could be framed as either a resource or a demand, associated with either perceived gains or losses (Bakker & Demerouti, Reference Bakker and Demerouti2007; Hobfoll, Reference Hobfoll1989). Calderwood et al.'s (Reference Calderwood, ten Brummelhuis, Patel, Watkins, Gabriel and Rosen2021) recent resource-based model discerns how physical activity could benefit employees' experiences, such as reducing the negative influences of stress (Clark et al., Reference Clark, Soyring, Jenkins, Daniels, Berkland, Werneburg and Olsen2014; Ten Brummelhuis & Bakker, Reference Ten Brummelhuis and Bakker2012; Toker & Biron, Reference Toker and Biron2012), improving positive affect (Oerlemans, Bakker, & Demerouti, Reference Oerlemans, Bakker and Demerouti2014), and building personal capabilities (Van Hooff, Geurts, Beckers, & Kompier, Reference Van Hooff, Geurts, Beckers and Kompier2011). However, employee gains from physical activity are not always a sure thing, and a sole focus on positive outcomes from one type of physical activity may fail to consider the potential for losses that may arise from another.
The opportunity for disparate resource outcomes from employee participation in different physical activity types is emerging. For instance, specific to the resource gains from exercise, research demonstrates how initial improvements arise in affective resources (Van Hooff et al., Reference Van Hooff, Geurts, Beckers and Kompier2011). Extended effort in exercise, however, leads to diminished gains in cognitive resources (Tomporowski, Reference Tomporowski2003). When considering the level of regular physical activity intensity, Calderwood et al. (Reference Calderwood, ten Brummelhuis, Patel, Watkins, Gabriel and Rosen2021) surmise that there may be a tipping point or a curvilinear relationship for the value of intensity. Further resource losses may be salient when considering how the physical activity type may hinder performance in multiple domains, such as workplace performance. Individuals' maladaptive physical activity engagement, such as an obsession with exercise training, may also lead to poorer functioning in life and work domains (Duda & Hall, Reference Duda, Hall, Singer, Janelle and Hausenblas2001; Luth, Flinchbaugh, & Ross, Reference Luth, Flinchbaugh and Ross2017). Moreover, studies often outline the positive role of employee participation in high physical activity levels but not lower levels (Ten Brummelhuis & Bakker, Reference Ten Brummelhuis and Bakker2012; Toker & Biron, Reference Toker and Biron2012). In sum, various nuances arise as to when and how employee participation in physical activity and different types of physical activity can be a resource or a loss. Thus, extending what we know about COR and to further distinguish the disparate findings in the physical activity domain, we examine the outcomes of different physical activity types (i.e., regular physical activity or exercise) and assess the role of grit, as a novel psychological resource.
Next, we examine employee career satisfaction and training stress perceptions to assess how different physical activity types may generate different outcomes in two studies (study 1 examines regular physical activity; study 2 examines exercise). Then, extending what we know about psychological resources in the physical activity domain, we examine the intervening role of grit in this relationship in both studies.
Physical activity type and career satisfaction
Career satisfaction describes employees' subjective perception of satisfaction in their workplace accomplishments (Greenhaus, Parasuraman, & Wormley, Reference Greenhaus, Parasuraman and Wormley1990), allowing employees to sustain their productivity, health, and happiness in their work and lives, more broadly (De Hauw & Greenhaus, Reference De Hauw, Greenhaus, De Vos and van der Heijden2015). Given the importance of career satisfaction to work and broader life domains (Spurk, Hirschi, & Dries, Reference Spurk, Hirschi and Dries2019), it is critical to understand more about the relationship between physical activity types and career satisfaction. The literature outlines precursors to career satisfaction positioned as either organizational (cf. compensation, job rank, Supangco, Reference Supangco2001) or personal (cf. proactive personality, Turban, Moake, Wu, and Cheung, Reference Turban, Moake, Wu and Cheung2017; life satisfaction, Sliter et al., Reference Sliter, Sinclair, Cheung and McFadden2014) factors. Nevertheless, no known research examines the relationship between physical activity and career satisfaction.
The resource-based theories reflect how individuals who engage in regular physical activity develop personal resources to successfully juggle work and non-work outcomes (Gabriel, Volpone, MacGowan, Butts, & Moran, Reference Gabriel, Volpone, MacGowan, Butts and Moran2019; Ten Brummelhuis & Bakker, Reference Ten Brummelhuis and Bakker2012). Research depicts how regular physical activity can improve work performance over the long term by generating improved mental resilience and memory (Smith et al., Reference Smith, Blumenthal, Hoffman, Cooper, Strauman, Welsh-Bohmer and Sherwood2010). Moreover, the improved physical health that comes from engagement in physical activity prevents illness, reduces employees' sick leave, and improves work gains (Calderwood et al., Reference Calderwood, ten Brummelhuis, Patel, Watkins, Gabriel and Rosen2021). To this point, Judge and Cable (Reference Judge and Cable2011) found an association between employee health and career gains, as measured by pay differentials. While no known research examines the association between regular physical activity and career satisfaction, research in the non-work domain outlines the beneficial role of leisure activities (e.g., music, theatre) on career success perceptions (Kelly, Strauss, Arnold, & Stride, Reference Kelly, Strauss, Arnold and Stride2020). Following this logic by drawing on research that considers regular physical activity as a leisure activity (e.g., Biernat, Tomaszewski, and Milde, Reference Biernat, Tomaszewski and Milde2010), we similarly surmise that improved physical health and mental functioning associated with regular physical activity may help employees reach career satisfaction. Thus:
Hypothesis 1a: The volume of regular physical activity is positively associated with perceived career satisfaction.
However, it may be premature to surmise that employees can maintain positive career perceptions as they balance their engagement in different types of physical activity and work responsibilities. Using a COR framework, Hall, Kossek, Briscoe, Pichler, & Lee, (Reference Hall, Kossek, Briscoe, Pichler and Lee2013) suggest that demands from numerous roles beyond family and work may be mutually incompatible. The authors call for an increased focus on the conflict between work and non-work domains, emphasizing how employees' increased involvement in non-work activities (i.e., physical activity) makes navigating work roles less tenable (Hall et al., Reference Hall, Kossek, Briscoe, Pichler and Lee2013). We surmise that employee participation in exercise may reduce their career satisfaction perceptions. It may be that individuals who exercise to pursue competitive interests to reach their goals may value and prioritize health and fitness values over their career. Alternatively, employees who feel less competent in their work roles may seek mastery in other life areas, such as success in competitive sport. In either case, as suggested by Hirschi, Herrmann, Nagy, and Spurk (Reference Hirschi, Herrmann, Nagy and Spurk2016), employees who engage in non-work roles, such as exercise for a valued goal, may create conflict between personal and work obligations and lead to negative reports of career satisfaction. Following this logic, we contend:
Hypothesis 1b: The volume of exercise is negatively associated with perceived career satisfaction.
Physical activity type and perceived training stress
Employee participation in different types of physical activity also could lead to divergent stress perceptions about their training. Perceived training stress can be positioned as a specific type of stress, anxiety, or unease that one may feel towards an upcoming training routine (Cohen, Kamarck, & Mermelstein, Reference Cohen, Kamarck and Mermelstein1983; Feldt & Koch, Reference Feldt and Koch2011). For instance, scheduled high-intensity intervals where one trains to physical exhaustion might lead to more anxiety than an upcoming 2-mile recovery run. A stream of research has considered the beneficial stress response associated with regular physical activity (e.g., Salmon, Reference Salmon2001). Routine physical activity helps lessen stress related to general life experiences (e.g., Scully, Reference Scully1998) and improves life satisfaction (Sliter et al., Reference Sliter, Sinclair, Cheung and McFadden2014). In the workplace, research examining physical activity and employee stress perceptions generally shows a negative relationship between physical activity and various types of stressors, such as supervisory-related stress and workload stress (Sawhney, Jennings, Britt, & Sliter, Reference Sawhney, Jennings, Britt and Sliter2018; Sliter et al., Reference Sliter, Sinclair, Cheung and McFadden2014). Intervention-based research developed to assess workplace physical activity outcomes shows how reduced job stress is associated with physical activity (Conn, Hafdahl, Cooper, Brown, & Lusk, Reference Conn, Hafdahl, Cooper, Brown and Lusk2009). The specific type of physical activity may also matter. Low-intensity physical activity is linked to improved positive affect post-workout (Ekkekakis, Parfitt, & Petruzzello, Reference Ekkekakis, Parfitt and Petruzzello2011). The increases in positive affect may serve as a coping mechanism that can mitigate maladaptive training stress responses (Silva, Reference Silva1990) to regular physical activity. Thus, we expect that employee participation in regular physical activity will have a negative association with training-related stress.
Hypothesis 2a: The volume of regular physical activity is negatively associated with perceived training stress.
The research, however, often only considers stress as it relates to regular physical activity and neglects to consider the role of employees' exercise directed towards competitive events and goals. Employees' desire to succeed in valued exercise goals could be incompatible with the gains that stem from regular physical activity. For example, it is well established that stress is part of athletic performance (Rano, Fridén, & Eek, Reference Rano, Fridén and Eek2019), and a litany of research has examined the role of stress in athletic performance (Li, Ivarsson, Lam, & Sun, Reference Li, Ivarsson, Lam and Sun2019). The higher intensity workouts and volume of exercise needed to reach goal success can increase negative affect post-workout (Ekkekakis, Parfitt, & Petruzzello, Reference Ekkekakis, Parfitt and Petruzzello2011). Various tensions in combination, such as attempts to meet performance goals in multiple domains, exacerbate stress perceptions (Anderson, Coffey, & Byerly, Reference Anderson, Coffey and Byerly2002). Based on this logic, we surmise that employee involvement in exercise to meet goal-directed outcomes could create tension for the employee, leading to increased stress perceptions about their exercise training. Thus:
Hypothesis 2b: The volume of exercise is positively associated with perceived training stress.
The value of grit as a psychological resource
Grit, a psychological resource, or state is represented as individual passion and perseverance that allows one to pursue and ultimately meet personal goals (Duckworth et al., Reference Duckworth, Peterson, Matthews and Kelly2007). Passion, what Duckworth labels ‘consistency of interest’ for a particular activity denotes one's desire to engage consistently in an interest they find enjoyable (henceforth, we use ‘consistency of interest’ for this sub-dimension of grit) (Duckworth et al., Reference Duckworth, Peterson, Matthews and Kelly2007; Duckworth & Quinn, Reference Duckworth and Quinn2009). The consistency of interest in grit has afforded employees to find meaning and value in their entrepreneurial (Mueller, Wolfe, & Syed, Reference Mueller, Wolfe and Syed2017) and self-employment endeavours (Wolfe & Patel, Reference Wolfe and Patel2016). Grit's other sub-dimension, perseverance, denotes continued attention to an endeavour even if this endeavour lacks personal meaning. Perseverance is a strength characteristic that promotes enduring capabilities despite workplace challenges and is correlated with task performance (Harzer & Ruch, Reference Harzer and Ruch2014). In combination, the grit subdimensions facilitate individual achievement and subjective well-being (Duckworth et al., Reference Duckworth, Peterson, Matthews and Kelly2007, Reference Duckworth, Kirby, Tsukayama, Berstein and Ericsson2011), and are suggested to be a novel resource to employees who engage in physical activity (e.g., Calderwood et al., Reference Calderwood, ten Brummelhuis, Patel, Watkins, Gabriel and Rosen2021). To our knowledge, no research has examined grit in the workplace physical activity domain.
We posit that grit may have beneficial associations with career satisfaction from increased participation in either type of physical activity. Often conceptualized as a form of hardiness in high-pressure environments, grit is negatively associated with burnout and enables one to maintain performance through intensive workplace demands (Halliday, Walker, Vig, Hines, & Brecknell, Reference Halliday, Walker, Vig, Hines and Brecknell2017). Grit is an essential source of workplace motivation (Jordan, Ferris, Hochwarter, & Wright, Reference Jordan, Ferris, Hochwarter and Wright2019) and is beneficial to employee performance (Dugan, Hochstein, Rouziou, & Britton, Reference Dugan, Hochstein, Rouziou and Britton2019). Grit enables employees heightened long-term performance and retention in highly competitive sales roles (Eskreis-Winkler, Shulman, Beal, & Duckworth, Reference Eskreis-Winkler, Shulman, Beal and Duckworth2014) and challenging hospital settings (Underdahl, Jones-Meineke, & Duthely, Reference Underdahl, Jones-Meineke and Duthely2017). Specific to the current study, in a mixed-method study, Clark and Clark (Reference Clark and Clark2019) found a positive relationship between grit and career success. Extending Clark and Clark's qualitative work, we contend that the consistency of interest and perseverance of grit is a resource that enables employees' ability to navigate workplace obstacles to find career satisfaction.
Hypothesis 3a: Grit is positively associated with perceived career satisfaction.
Scholars have also reported associations between grit and stress perceptions. Extending beyond the positive relationships between grit and various psychological orientations, including subjective well-being (Salles, Cohen, & Mueller, Reference Salles, Cohen and Mueller2014; Vainio & Daukantaitė, Reference Vainio and Daukantaitė2016), research shows the positive impact of grit on physical pursuits. When considering grit in the health domain, grit leads to increased effort in cardiovascular efforts (Silvia, Eddington, Beaty, Nusbaum, & Kwapil, Reference Silvia, Eddington, Beaty, Nusbaum and Kwapil2013) and improved self-efficacy (Netz, Wu, Becker, & Tenenbaum, Reference Netz, Wu, Becker and Tenenbaum2005). In these situations, grit facilitates perseverance towards goal attainment and enables sustained engagement in tasks that might otherwise sap one's physical and mental capacity. Scholars demonstrate that grit leads to reduced burnout rates (Salles, Cohen, & Mueller, Reference Salles, Cohen and Mueller2014) and stress perceptions (O'Neal et al., Reference O'Neal, Espino, Goldthrite, Morin, Weston, Hernandez and Fuhrmann2016) in educational settings. Thus, grit is negatively associated with individual stress perceptions in various challenges. Based on these findings, in our employee sample, we contend:
Hypothesis 3b: Grit is negatively associated with perceived training stress.
Research has begun to examine precursors to grit to discern its developable nature. Namely, there are steps employees could take to build their grit levels. Von Culin, Tsukayama, and Duckworth (Reference Von Culin, Tsukayama and Duckworth2014) demonstrate how individual motivation could enhance grit. The authors report that like experienced flow states where participation in an activity is deemed effortless and timeless (Csikszentmihalyi, Reference Csikszentmihalyi1997), the pursuit of engaging and absorbing activities exists as a precursor to grit (Von Culin, Tsukayama, & Duckworth, Reference Von Culin, Tsukayama and Duckworth2014). In an engaged state, individuals can persist in the ongoing practice of a particular activity (Duckworth, Kirby, Tsukayama, Berstein, & Ericsson, Reference Duckworth, Kirby, Tsukayama, Berstein and Ericsson2011), such as training for a fitness goal. Notably, Duckworth et al. (Reference Duckworth, Kirby, Tsukayama, Berstein and Ericsson2011) show how this desire endures despite challenges or even hardships. The individual is committed to a particular purpose, increasing reported grit in various contexts (Hill, Burrow, & Bronk, Reference Hill, Burrow and Bronk2016; Von Culin, Tsukayama, & Duckworth, Reference Von Culin, Tsukayama and Duckworth2014). Similarly, we expect that participation in both physical activity types will be positively associated with grit.
Hypothesis 4a: The volume of regular physical activity is positively associated with grit.
Hypothesis 4b: The volume of exercise is positively associated with grit.
The mediating role of grit
While a body of research in health and organizational psychology often positions physical activity as a moderating condition (Salmon, Reference Salmon2001; Ten Brummelhuis & Bakker, Reference Ten Brummelhuis and Bakker2012; Toker & Biron, Reference Toker and Biron2012), we believe that the psychobiological gains that result from physical activity participation are better positioned as a mediating effect. Our use of grit as a mediating mechanism follows a body of health psychology and physiology research that shows how physical activity alters brain functioning (i.e., endorphins, serotonin), which, in turn, positively enhances other psychological states, such as reduced stress and increased positive emotions (Salmon, Reference Salmon2001; Southwick, Vythilingam, & Charney, Reference Southwick, Vythilingam and Charney2005). The elevated affective states from physical activity are inherent to resource theories and help build individual capabilities of improved success perceptions in other areas (Fredrickson, Reference Fredrickson2001). We believe physiological outcomes resulting from employee engagement in physical activity can lead to grit's altered mindset. Scholars have examined grit as a mediator to successful personal attitudes and behaviour in a range of settings, such as influencing entrepreneurial performance in new ventures (Mueller, Wolfe, & Syed, Reference Mueller, Wolfe and Syed2017), connecting student motivation to academic success (Reraki, Celik, & Saricam, Reference Reraki, Celik and Saricam2015), and maintaining future goal orientations for long-distance runners (Fong, Gilchrist, & Sabiston, Reference Fong, Gilchrist and Sabiston2016). Following Fong and colleagues’ work (Reference Fong, Gilchrist and Sabiston2016), we expect that grit's benefit will be present in employees who participate in either physical activity type, stemming from the beneficial psychobiological effects present in multiple physical activity types (Salmon, Reference Salmon2001; Southwick, Vythilingam, & Charney, Reference Southwick, Vythilingam and Charney2005). Thus, we surmise:
Hypothesis 5a: Grit mediates the relationship between the volume of regular physical activity and perceived career satisfaction and perceived training stress.
Hypothesis 5b: Grit mediates the relationship between the volume of exercise and perceived career satisfaction and perceived training stress.
Study 1 methodology
Sample and procedure
Study 1 assessed the proposed relationships with a sample of employees who participated in regular physical activity. We collected data from an online self-reported survey from 241 employees in the USA. The University's Institutional Review Board approved all phases of the study. The first author worked with QualtricsXM to survey employees from different industries. We used Qualtrics' proprietary employee sample for the survey administration. Two hundred and forty-one people participated. Thirty-four participants were removed due to insufficient responses. We also asked them to provide demographic information (e.g., age, gender, education level, employment status). In total, 56% were female, the average age was 44.7 years old (sd = 13.19), and average organizational tenure of the participants was 11.60 years (sd = 9.28).
Measures
All scales used a 7-point Likert-type scale from 1 = ‘strongly disagree’ to 7 = ‘strongly agree’ unless otherwise noted.
Physical activity volume
We measured the volume of weekly physical activity by the following item: ‘On average, how many hours each week do you participate in physical activities (typesFootnote 2)?’ Volume reflects the total amount of physical activity during a specified time (Powell, Paluch, & Blair, Reference Powell, Paluch and Blair2011). Single-item instruments are commonly used to assess physical activity levels (Toker & Biron, Reference Toker and Biron2012). The average time spent on weekly physical activity was 7.4 h (sd = 7.26). To address the non-normality of the data, we applied a natural logarithm transformation to address the skewed data resulting in 1.65 (sd = .82) hours of weekly physical activity.
Grit
Participant grit was measured using Duckworth and Quinn's (Reference Duckworth and Quinn2009) 12-item grit scale. Six items assess perseverance of effort towards long-term goals (i.e., ‘I have achieved a goal that took years of work’), and six items assessed focus on consistency of interest in goals (i.e., ‘I am diligent’). Scholarly work has criticized the validity of the combined grit scale, creating an inability to predict performance (Credé, Tynan, & Harms, Reference Credé, Tynan and Harms2017). Thus, we tested our hypotheses with two subscales of grit: consistency of interest and perseverance of effort. The Cronbach's alpha is .75 for perseverance and .87 for consistency of interest.
Subjective career satisfaction
The career success scale was adapted from Greenhaus, Parasuraman, and Wormley's (Reference Greenhaus, Parasuraman and Wormley1990) validated career success measure. The measure includes 5-items gauging participants' perceptions of career satisfaction. A sample item is, ‘In my work, I am satisfied with the progress I have made towards meeting my overall career goals’. The Cronbach's alpha is .89.
Perceived training stress
The perceiving training stress scale was adapted from Cohen, Kamarck, and Mermelstein's (Reference Cohen, Kamarck and Mermelstein1983) perceived stress scale (PSS). The 10-item measure assesses perceptions of stress stemming from the comprehensive nature of physical activity training. Prior research has adapted and validated the PSS items to reflect stress in other contexts (e.g., Feldt and Koch, Reference Feldt and Koch2011). A sample item includes, ‘How often have you felt nervous and “stressed,” about (physical activity) training?’. The Cronbach's alpha is .79.
Controls
We control for variables known to influence the study relationships, including the weekly number of hours worked, age, and gender (Calderwood et al., Reference Calderwood, Gabriel, Rosen, Simon and Koopman2016).
Analysis
In both study 1 and study 2, we employed two statistical techniques to improve the power of our study. Adhering to common practice, the researchers incorporated full information maximum likelihood estimation, which is appropriate for the study's sample size (Wothke, Reference Wothke, Little, Schnabel and Baumert2000). The proportion of missing data for the entire sample was less than 15% and supported a pattern of missing completely at random. To maintain an appropriate ratio from indicators to sample size, the authors parcelled grit and the dependent variables to composite indicators for each respective construct (Little, Reference Little2013). We formed parcels by pairing the items with the highest loadings and lowest loadings. We repeated this pairing process until all items were assigned to one of the three indicators.
Study 1 results
Measurement model
First, to identify common method variance from our sample we performed Harman's single-factor test. Our results mitigate common method bias given no single factor explained more than the recommended threshold of 50% (highest factor variance = 24.79%) (Podsakoff & Organ, Reference Podsakoff and Organ1986). Second, we conducted a confirmatory factor analysis (CFA) of our study's scales. We conducted several model tests. The initial measurement model displayed poor fit (χ2(318) = 1295.18, p = .00; RMSEA = .13, 90% CI = [.12 to .14]; CFI = .73; TLI = .71). The four negatively worded items in the PSS did not have significant factor loadings. Following research that questions the validity of Cohen's PSS scale (Nielsen et al., Reference Nielsen, Ørnbøl, Vestergaard, Bech, Larsen, Lasgaard and Christensen2016), we removed these items from the model. After removing the four items, the model fit showed adequate fit (χ2(224) = 615.81, p = .00; RMSEA = .10, 90% CI = [.09 to .11]; CFI = .87; TLI = .86). We created parcels to reduce the parameter estimates and the CFA showed good fit indices (χ2(29) = 65.75, p = .00; RMSEA = .08, 90% CI = [.06 to .11]; CFI = .98; TLI = .96). Then, we conducted a series of construct validity tests. The results provide preliminary evidence that the study constructs are distinct from one another, and our proposed measurement model is a good fit for the data.
Hypothesized structural model
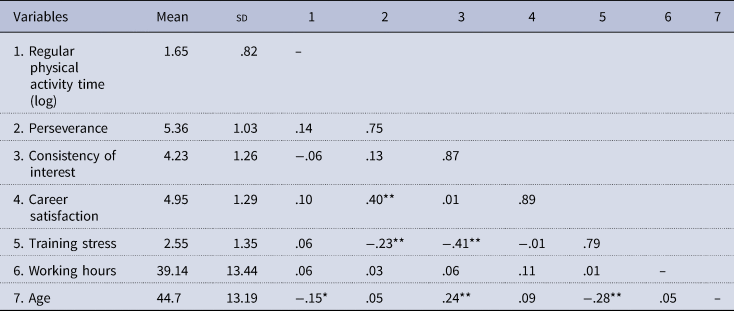
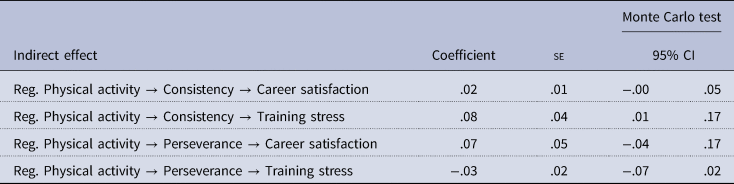
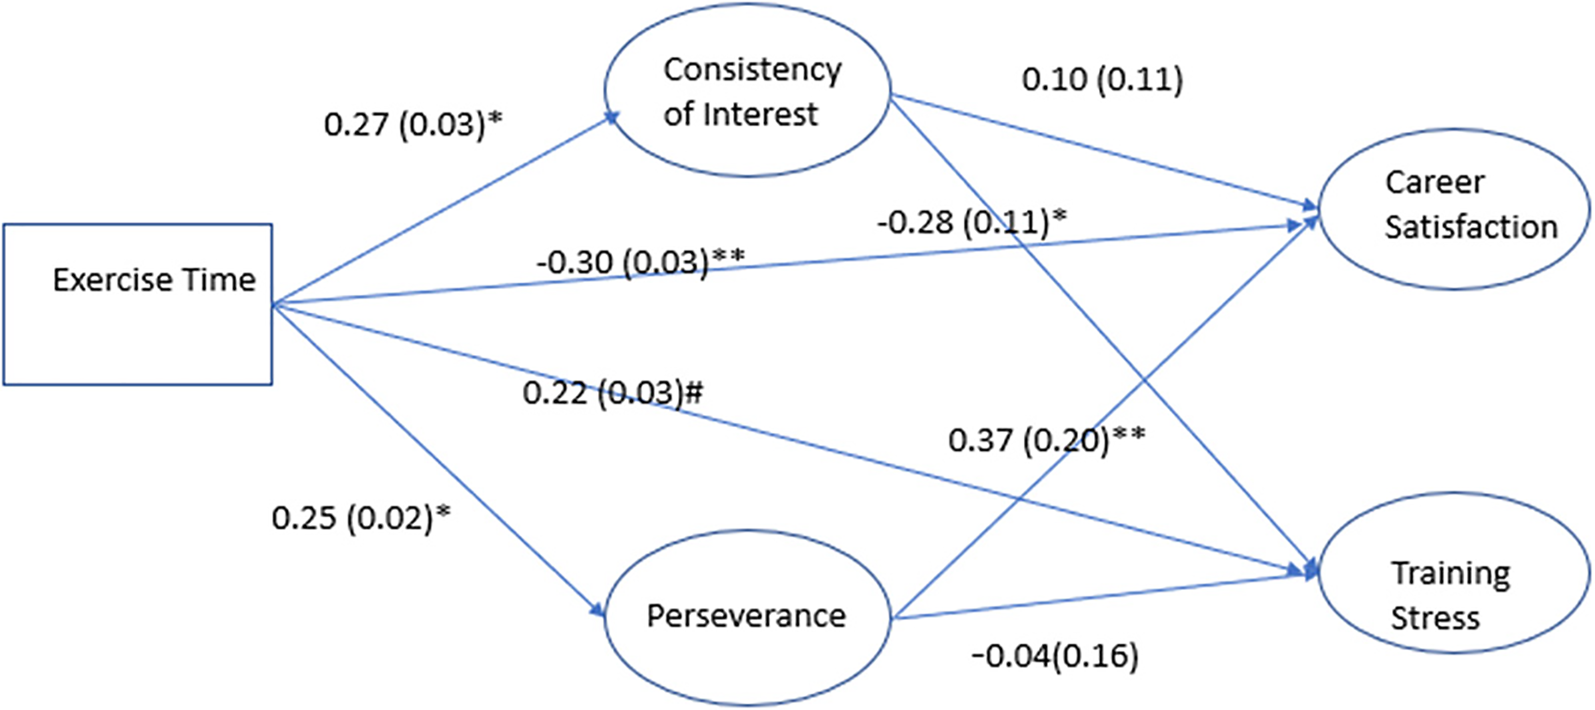
Study 1 descriptive statistics are reported in Table 1. We tested our hypotheses using structural equation modelling (SEM). The hypothesized model (Figure 1) shows good fit indices (χ2(46) = 89.77, p = .00; RMSEA = .07, 90% CI = [.05 to .09]; CFI = .97; TLI = .96). The results show regular physical activity has no significant effect on career satisfaction or perceived training stress, failing to support hypotheses 1a and 2a. The results showed mixed findings regarding the effect of grit on career satisfaction and perceived training stress. For career satisfaction (hypothesis 3a), no relationship was found between consistency of interest and career satisfaction. However, we found an unanticipated significant positive relationship between the perseverance and perceived career satisfaction (β = .48, p < .01). In support of hypothesis 3b, we found significant negative relationships between both subdimensions of grit and perceived training stress (β = −.18, p < .05 for perseverance and β = −.36, p < .01 for consistency of interest). We found partial support for hypothesis 4a, such that a significant negative relationship existed between regular physical activity and consistency of interest (β = −.14, p < .05), but no significant path existed between regular physical activity and perseverance. In the mediation test (hypothesis 5a), we found a significant indirect effect between physical activity volume and perceived training stress through consistency of interest (indirect effect = .08, p < .01), providing partial support for the mediating effects of consistency of interest. Notably, the direction of the mediating relationship counters our hypothesized direction. The Monte Carlo method supports the mediating relationship of consistency of interest (indirect effect = .08, 95% CI = [.01 to .17]) showing that consistency of interest increased training stress with increased physical activity levels (see Table 2).
Study 1 results. Note: *p < .05; **p < .01. Parentheses are standardized errors.
Study 1: means, standard deviations, and correlations
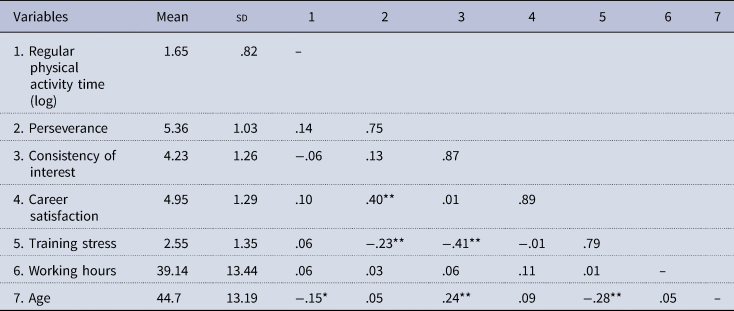
The numbers on the diagonal are Cronbach's alphas of the measurement scales.
*p < .05; **p < .01.
Monte Carlo results of study 1
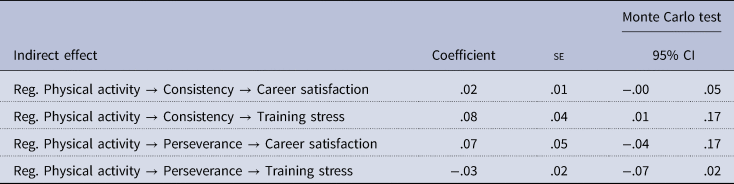
In summary, we failed to find support for any relationship between regular physical activity levels and career satisfaction or perceived training stress. However, grit appeared to play an interesting role in the study findings. It seems grit attenuated training stress perceptions as both subdimensions of grit had negative relationships with perceived training stress. However, the perseverance subdimension, alone, seemed to influence employees' career satisfaction positively. Countering the hypothesized direction, we found grit's consistency of interest mediates the relationship between regular physical activity and perceived training stress relationship, increasing stress perceptions for those who engage in regular physical activity. Thus, one's consistency or passion in the presence of regular physical activity participation appeared to increase training stress. Notably, the mixed findings of the subdimensions of grit support previous critiques about the unidimensional nature of grit (e.g., Credé, Tynan, and Harms, Reference Credé, Tynan and Harms2017), namely the grit subdimensions appear to operate differently in our study. Researchers should be cautious when interpreting data from models with unidimensional grit. Our findings suggest it is better to examine grit as two subdimensions.
Study 2 methodology
Sample and procedure
To discern the (dis)similarity of the model relationships with the different types of physical activity, study 2 tests the proposed relationships with an employee sample who exercise to meet competitive athletic goals. Data were collected via online self-report surveys from 119 competitive US cyclists. The decision to focus on competitive cyclists is based on the extensive hours of exercise that can require training for more than 15 h each week (Luth, Flinchbaugh, & Ross, Reference Luth, Flinchbaugh and Ross2017). We believe the extensive training hours for cycling pursuits best exemplifies Powell, Paluch, and Blair's (Reference Powell, Paluch and Blair2011) definition of exercise as a subtype of physical activity. The researchers incorporated a snowball sampling technique to solicit a wide range of cycling participants. With this sampling technique, the study's first author, a competitive cyclist, first used social media to message other cyclists. Survey administration occurred immediately following the cycling race season's end to assess the cyclists' experiences over the entire race season. One hundred and fifty-one participants reviewed the online survey. Thirty-two responses (21%) were omitted due to incomplete responses, leaving a final sample of 119 participants. The sample consisted of 49% females, average participant age was 43.22 years (sd = 10.81), average organizational tenure was 8.88 years (sd = 8.02), and the number of years of cycling was 9.77 (sd = 8.96).
Measures
Exercise volume. In addition to the measures used in study 1, we measured the volume of hours each participant exercised for competition by asking: ‘On average, during racing season, how many hours do you train for cycling each week?’ The average time exercising each week was 11.19 h (sd = 3.76).
Study 2 results
Measurement model
Like study 1, we conducted Harman's single-factor test and the results show that the total variance explained by the extracted single factor is 36.5%, which is below the recommended threshold (Podsakoff & Organ, Reference Podsakoff and Organ1986). Therefore, we can conclude that there is no common method bias in our data for study 2. We followed the same sequence of tests as reported in study 1. Our initial CFA test demonstrated poor fit: (χ2(318) = 1884.76, p = .00; RMSEA = .11, 90% CI = [.10 to .12]; CFI = .69; TLI = .66). Again, we removed four negatively scaled items and the measurement model showed adequate fit (χ2(146) = 334.46, p = .00; RMSEA = .10, 90% CI = [.09 to .12]; CFI = .83; TLI = .80). After parcelling the mediator and outcome variables, the model fit showed adequate fit indices: (χ2(71) = 146.61, p = .00; RMSEA = .10, 90% CI = [.07 to .11]; CFI = .91; TLI = .88). The series of construct validity tests confirmed construct distinctiveness and that our measurement model is an adequate fit for the data.
Hypothesized structural model
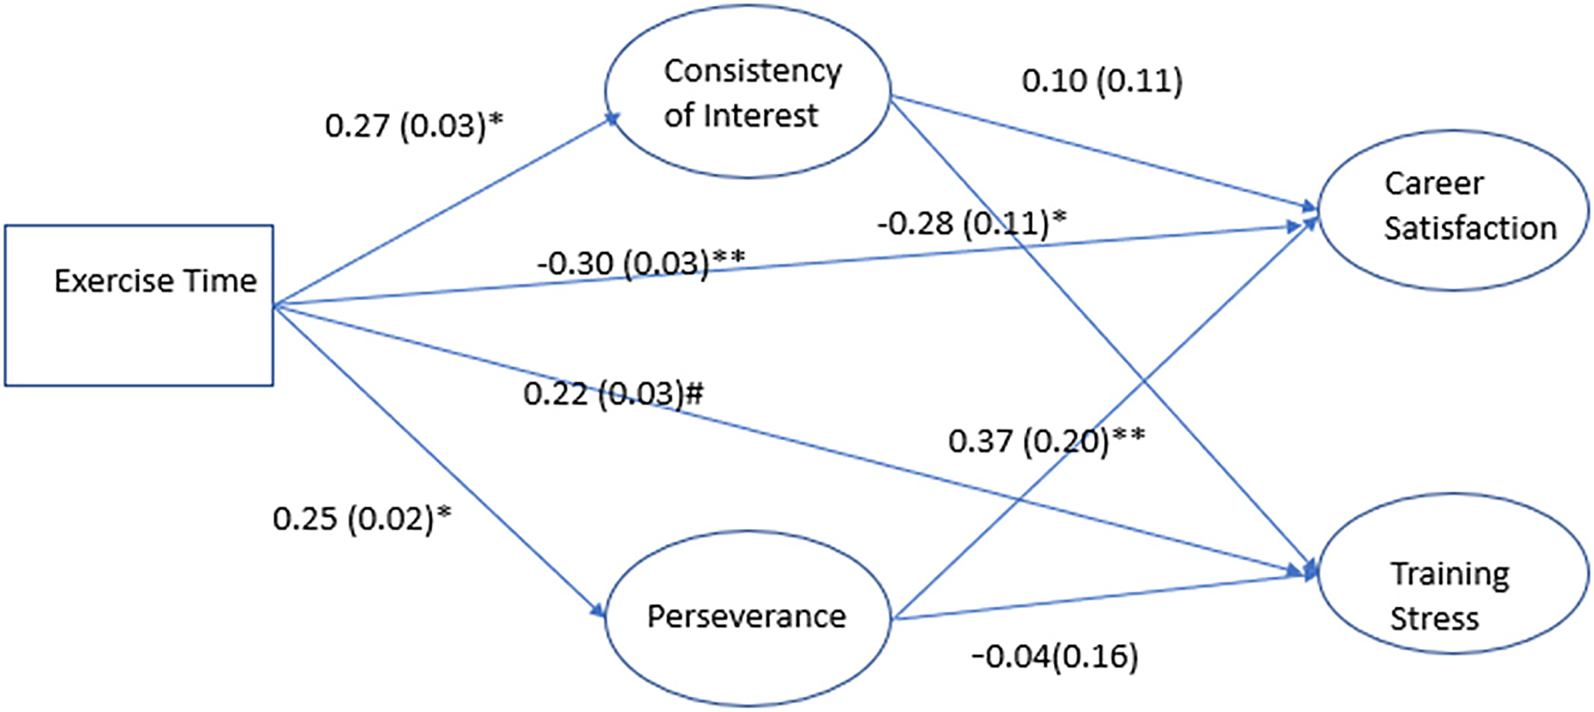
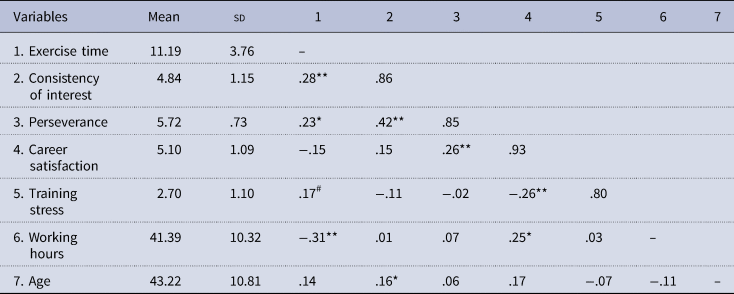
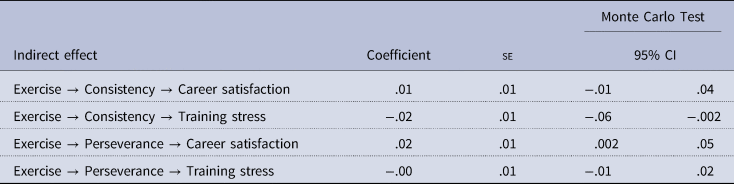
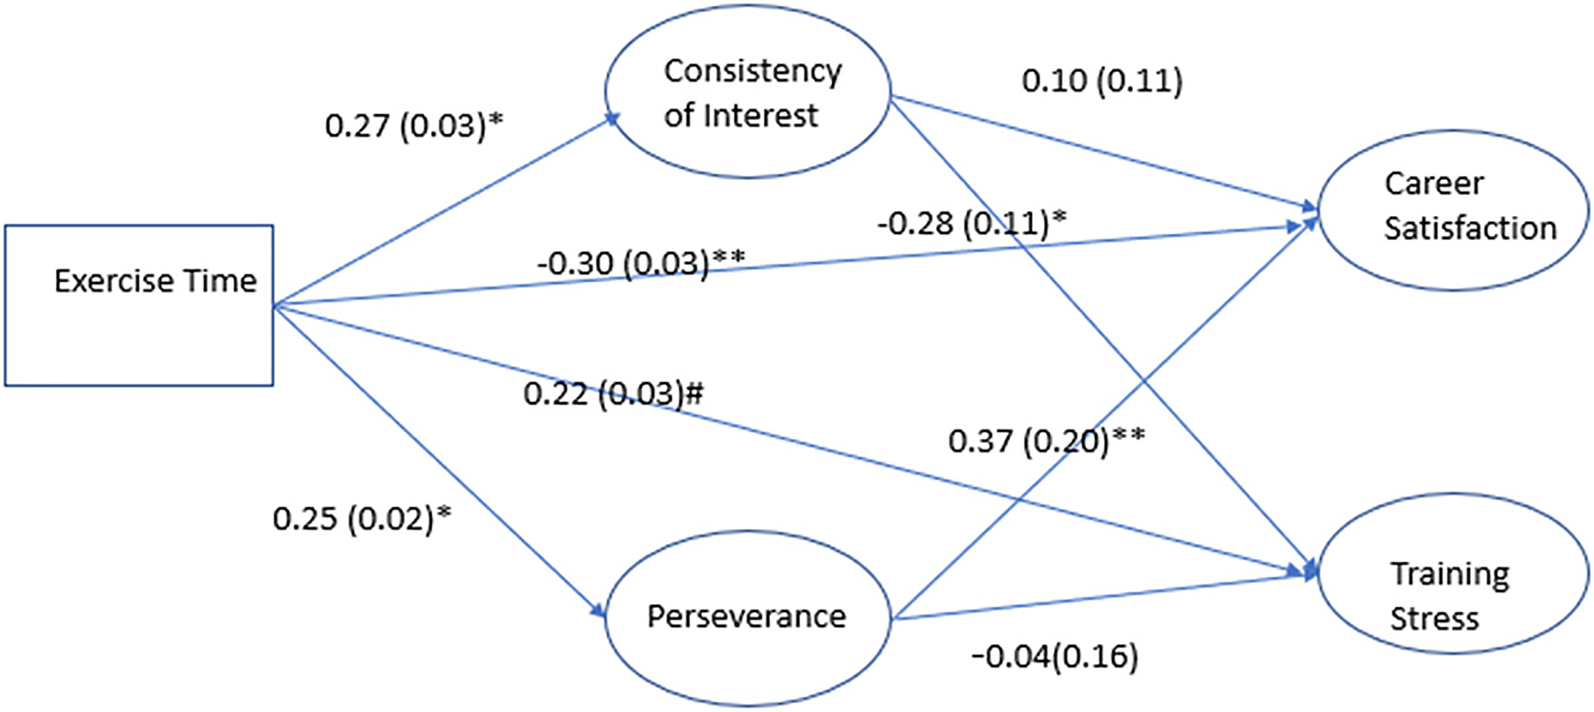
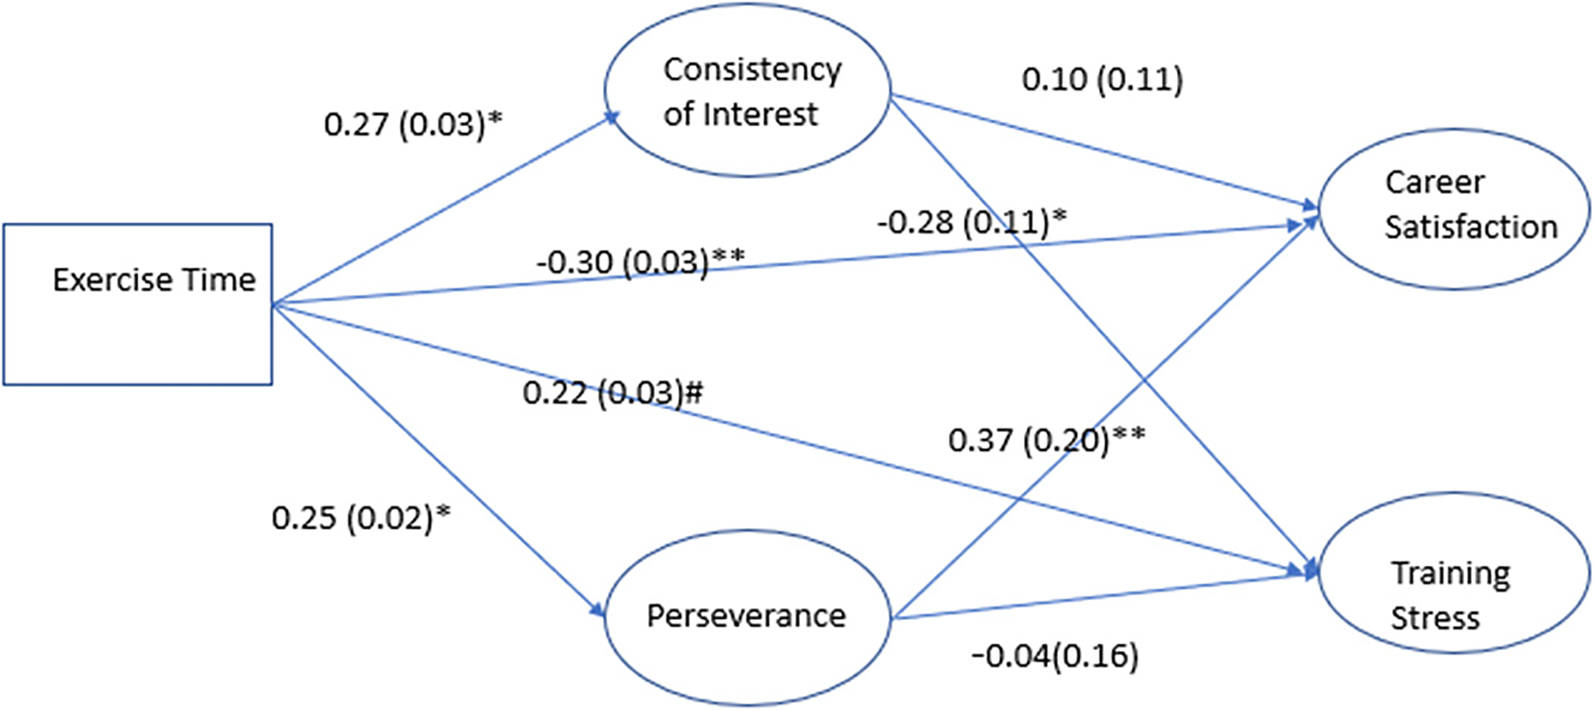
The descriptive statistics for study 2 are reported in Table 3. The hypothesized model (see Figure 2) shows adequate fit indices (χ2(96) = 148.52, p = .00; RMSEA = .08; 90% CI = [.05 to .10]; CFI = .91; TLI = .88). We first tested the direct effects from weekly exercise volume to the study's outcome variables and included the study controls. We found a negative association between the average number of hours worked weekly and weekly training hours (β = −.31, p < .01), warranting the need to keep this control in the study's hypotheses test. No other control was found to be significant. The SEM results indicated that exercise volume was negatively associated with perceived career satisfaction (β = −.30, p < .01), and positively associated – although marginally – with perceived training stress (β = .22, p < .10). Thus, hypotheses 1b and 2b are supported. Next, we found mixed findings regarding grit and the study outcomes. The results show a positive significance relationship between perseverance and career satisfaction (β = .37, p < .01), while consistency of interest has no significant effect on career satisfaction. Thus, hypothesis 3a is partially supported. On the other hand, no significance path was found between perseverance and training stress, but there is a significant negative association between consistency of interest and training stress (β = −.28, p < .05), showing partial support for hypothesis 3b. The results also show significant positive relationships between exercise volume and both perseverance (β = .25, p < .05) and consistency of interest (β = .27, p < .05), providing support for hypothesis 4b. The mediation test results (see Table 4) show that perseverance mediates the relationship between exercise volume and career satisfaction (indirect effect = .02, 95% CI = [.002 to .05]). The mediation test results also show that consistency of interest mediated the relationship between exercise volume and perceived training stress (indirect effect = −.02, 95% CI = [−.06 to −.002]).
Study 2 results. Note: *p < .05; **p < .01; #p < .10. Parentheses are standardized errors.
Study 2: means, standard deviations, and correlations
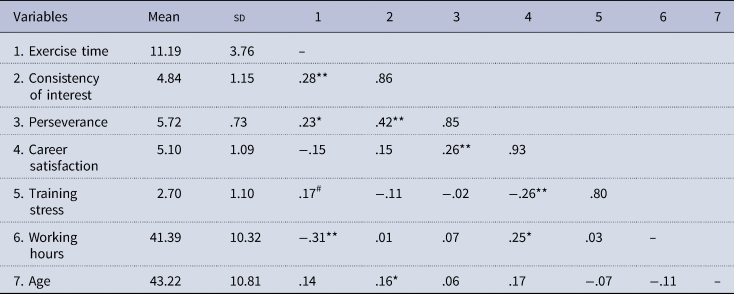
The numbers on the diagonal are Cronbach's alphas of the measurement scales.
*p < .05; **p < .01; #p < .10.
Monte Carlo test results of study 2
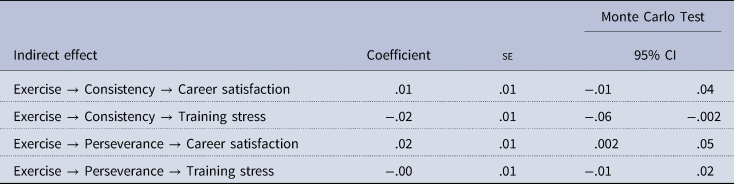
In summary, study 2 results generally hold for our hypothesized relationships, where grit appeared to operate as a valued psychological resource. First, as the exercise volume increased, we found diminishing career satisfaction and increased perceived training stress perceptions as expected. Second, exercise volume seemed to have a positive significant effect on grit. Third, grit appeared to serve as a critical psychological resource that changed the initial adverse outcomes into positive gains such that: (a) perseverance, positively associated with increasing exercise levels, enhanced employee career satisfaction, and (b) consistency of interest, positively associated with increasing exercise levels, reduced the negative impact of exercise on perceived training stress. Fourth, like the study 1 results, the grit subdimensions do not show the same unidimensional pattern with common outcomes, and thus, future researchers are encouraged to hypothesize grit as two subdimensions instead of an upper-level construct.
Discussion
By examining two types of physical activity in two distinct employee samples, this study offered novel findings of the divergent outcomes associated with employee involvement in different physical activity types. In study 1, where employees participated in regular physical fitness, we found no associations with regular physical activity and training stress or career satisfaction contrary to our expectations. In contrast, our study 2 findings suggested a different story in the sample of employees exercising to reach valued competitive goals. We found that exercise volume was associated with reduced career satisfaction and increased training stress, as expected. Thus, these findings suggested that physical activity type mattered to employee perceptions.
Importantly, the mediating role of the grit sub-dimensions appeared to operate differently between the different types of physical activity. In study 1, the results suggested that consistency of interest mediated the relationship between regular physical activity and training stress, increasing employees' training stress perceptions. In this case, it appeared that one's passion towards an interest exacerbated training stress. Grit operated differently as a mediator for those who exercised to meet their competitive goals in study 2. While exercise was associated with harmful direct outcomes (i.e., decreased career success and increase training stress), both grit dimensions influenced these initial adverse outcomes into positive gains, highlighting the critical role of grit as a resource. For employees who participated in exercise, grit appeared to serve as a necessary psychological state that enabled employees to focus on exercise-related training goals and maintain positive workplace outcomes.
Our findings extend the understanding of how different types of physical activity types in conjunction with psychological resources may be considered either a resource or a demand in the workplace domain. Extending what we know about trade-offs between the workplace resource gains or losses (Lesener, Gusy, & Wolter, Reference Lesener, Gusy and Wolter2019) in the relationship between physical activity and employee outcomes, we find that the distinct type of physical activity and grit, in combination, can either harm or help employees. Again, for employees engaged in regular physical activity, grit (i.e., consistency of interest) appears to cause increased stress perceptions. However, for employees engaged in exercise to meet a competitive training goal, we find that grit's perseverance led to improve career satisfaction and grit's consistency of interest reduced training stress perceptions. Our results add to the COR research to help untangle the nuanced outcomes of employee participation in different physical activity types.
Contrary to our expectations, we found no direct association with resource gains or losses for employees participating in regular physical activity. These findings counter research that described how involvement in fitness-related activities improves employee attitudes, perceptions, and affect (Bakker, Demerouti, Oerlemans, & Sonnentag, Reference Bakker, Demerouti, Oerlemans and Sonnentag2013; Calderwood et al., Reference Calderwood, ten Brummelhuis, Patel, Watkins, Gabriel and Rosen2021). It may be that the lower volume of physical activity failed to reach a requisite threshold associated with employee perceptions of short-term outcomes. This assumption is supported by earlier work that acknowledged how employees' performance in less strenuous physical activity led to non-significant associations (van Berkel, Proper, van Dam, Boot, Bongers, & van der Beek, Reference van Berkel, Proper, van Dam, Boot, Bongers and van der Beek2013), given that less vigorous physical activity does not lead to the same level of psychological detachment (Van Hooff et al., Reference Van Hooff, Geurts, Beckers and Kompier2011). Other research found that employee physical activity has less impact on work-related outcomes than health outcomes (Lennefer, Lopper, Wiedemann, Hess, & Hoppe, Reference Lennefer, Lopper, Wiedemann, Hess and Hoppe2020). Such findings may support the failed association with career satisfaction. Alternatively, it may be that the self-directed nature of the physical activity, without supports from formal organizational wellness programmes (e.g., Tannenbaum, Valasek, Knowles, and Ditto, Reference Tannenbaum, Valasek, Knowles and Ditto2013) or workplace physical activity interventions (i.e., personal trainer, reminders, training partner) could influence the failed associations (Finkelstein et al., Reference Finkelstein, Haaland, Bilger, Sahasranaman, Sloan, Nang and Evenson2016).
Importantly, we found initial associations with diminished work-related outcomes for employees who exercise to reach competitive athletic goals, namely reduced career satisfaction and increased training stress. These outcomes could be problematic for employees, given how research shows how both outcomes are correlated negatively with job performance (Bozionelos et al., Reference Bozionelos, Kostopoulos, Van der Heijden, Rousseau, Bozionelos, Hoyland and Van der Heijde2016). The increased training stress with increased exercise levels is consistent with findings reported in the competitive sport domain (Li et al., Reference Li, Ivarsson, Lam and Sun2019; Rano, Fridén, & Eek, Reference Rano, Fridén and Eek2019). The reduced career satisfaction from increasing exercise, as a longer-term outcome, suggested that exercise may be what scholars label as a volatile resource that is short-lived and transitory, failing to impact success in other contexts (Ten Brummelhuis & Bakker, Reference Ten Brummelhuis and Bakker2012). These outcomes seem to counter the argument that improved physical and cognitive health from regular exercise can improve job performance over the long term (Calderwood et al., Reference Calderwood, ten Brummelhuis, Patel, Watkins, Gabriel and Rosen2021). Perhaps the average number of weekly training hours from this employee sample (11.19 h) compared to the US Department of Health and Human Services (2019) recommended dose (1.25 to 2 weekly hours of vigorous aerobic intensity) led to the diminished outcomes. In sum, the results provided initial evidence of dissimilarities between employee participation in different physical activity types.
Grit as a psychological resource
We found how grit as a psychological state impacted the outcomes disparately for employees participating in both regular physical activity and exercise. For employees who are competitive cyclists, grit was reflective of a psychological resource that enabled employees to persevere towards career satisfaction and persist in training goals without reduced training stress. These results demonstrated how grit enriched employee outcomes across work-related and valued exercise goals, suggesting that employees could navigate interests in different domains successfully. The intervening nature of grit appeared to operate similarly to employee engagement (Kelly et al., Reference Kelly, Strauss, Arnold and Stride2020) or intrinsic motivation (Calderwood et al., Reference Calderwood, ten Brummelhuis, Patel, Watkins, Gabriel and Rosen2021), both of which allow employees to avoid deleterious outcomes in the relationship between leisure pursuits and work experiences. The importance of grit's consistency of interest as an intervening mechanism appears to function as a coping mechanism (e.g., Silva, Reference Silva1990) that allowed employees to increase their exercise volume without contributing to maladaptive training stress. As such, grit added to other psychological resources known to assist employees in workplace roles, such as conscientiousness (Demerouti, Reference Demerouti2006) or ambition (Maltby et al., Reference Maltby, Day, Giles, Gillett, Quick, Langcaster-James and Linley2008). Our results show how grit appeared to serve as a valuable psychological resource that lessened the negative spillover effect of exercise training and amplified career satisfaction perceptions.
Notably, our findings suggest that grit was not necessarily valuable to employees who participated in regular physical activity. For these employees, we found that grit's mediating role counteracted any indirect benefits on employee perceptions. In this case, an initial negative association was reported between consistency of interest and training stress. However, consistency of interest fully mediated the relationship between regular physical activity and training stress, increasing employees' perceptions of training stress. With this finding, our results suggest that grit is not always beneficial to employee outcomes, adding to other research that reports limits to grit's value and reflects its potential dark side in the physical activity in the workplace domain (Credé, Tynan, & Harms, Reference Credé, Tynan and Harms2017; Khan, Neveu, & Murtaza, Reference Khan, Neveu and Murtaza2020). Our findings also appeared to demonstrate how the grit subdimensions operated differently for employees engaged in regular physical activity, questioning the validity of the subdimensions (Credé, Tynan, & Harms, Reference Credé, Tynan and Harms2017).
Practical implications
Our findings have important practical implications. Managerial interest in employee health gains is predicated mainly on the expectation that a physically fit employee can perform better at work (e.g., Mitchell, Ozminkowski, and Serxner, Reference Mitchell, Ozminkowski and Serxner2013). However, we find nuances to this relationship, such that employee participation in exercise could limit employees' perceptions of career satisfaction and increase their training stress, without the requisite psychological resource of grit. The potential downside of employee engagement in the physical activity types without the necessary psychological resources counters the known benefits (e.g., Sliter et al., Reference Sliter, Sinclair, Cheung and McFadden2014; Wollseiffen et al., Reference Wollseiffen, Ghadiri, Scholz, Strüder, Herpers, Peters and Schneider2016). As such, employee differences in physical activity type and psychological resources may provide one avenue to help explain why organizations do not find consistent employee gains following employee participation in workplace fitness and wellness programmes (Pereira, Coombes, Comans, & Johnston, Reference Pereira, Coombes, Comans and Johnston2015). For employees who exercise, it appears that organizations should consider developing employees' grit as a psychological resource that allows for their success in exercise training. Managerial implementation of interventions to develop employee grit, such as done previously with workplace mindfulness or resilience training (Althammer, Reis, van der Beek, Beck, & Michel, Reference Althammer, Reis, van der Beek, Beck and Michel2021; Baker, Baker, & Burrell, Reference Baker, Baker and Burrell2021), could create beneficial synergies with employee exercise. For employees who engage in regular physical activity, there may be different underlying reasons for their heightened training stress perceptions. It may be that they found physical activity participation to be incongruent with work-related goals (Rockmann, Salou, & Gewald, Reference Rockmann, Salou and Gewald2018). Alternatively, employees may have failed to possess sufficient information about how to train for physical activity, leading to more distress than benefit (Lee & Hawkins, Reference Lee and Hawkins2016). Managers should be mindful of such needs across the different types of physical activity.
Limitations and future studies
This study has several limitations, which open avenues for future research. First, we did not investigate the intensity effects of different activities or the potential for different energy expenditures in employees' job roles (i.e., desk job, manual labour). The different intensities of the physical activity or job types, moderate or vigorous, may have different impacts on job-related outcomes. However, we address Calderwood et al.'s (Reference Calderwood, Gabriel, Rosen, Simon and Koopman2016) call and contribute to the literature by examining the different types of physical activity. Second, boundary conditions may impact our results, such as if the physical activity occurred during the workday or post-work. Workplace wellness programmes that provide employees with financial incentives for participation (Tannenbaum et al., Reference Tannenbaum, Valasek, Knowles and Ditto2013) may lead to differing attitudes and behaviours in the study's relationships. Similarly, as a growing number of jobs are completed in a remote, telework setting, employees may exercise during their workday breaks, serving as a novel type of ‘momentary work recovery’ as reported in earlier research (Trougakos, Hideg, Cheng, & Beal, Reference Trougakos, Hideg, Cheng and Beal2014). Future research should examine the value of such boundary conditions on employees' physical activity. Third, our research used self-reported, cross-sectional perceptions measures. Future research across multiple time points is necessary to determine the influential nature of grit in the relationship between physical activity types and objective measures of career success (i.e., behavioural-based performance indicators) and training stress (i.e., cortisol levels).