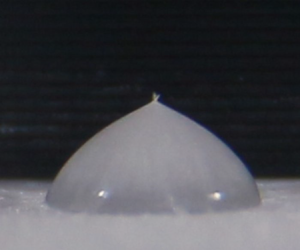

1. Introduction
Understanding how liquid droplets impact and spread onto a surface is crucial for several processes ranging from spray coating to printing (Mostaghimi, Pasandideh-Fard & Chandra Reference Mostaghimi, Pasandideh-Fard and Chandra2002; Tavakoli, Davis & Kavehpour Reference Tavakoli, Davis and Kavehpour2014). Droplet impact and spreading may depend on a plethora of parameters such as wettability, surface roughness, liquid bulk and interfacial properties as well as velocity of impact (Worthington & Clifton Reference Worthington and Clifton1877; Tanner Reference Tanner1979; Chandra & Avedisian Reference Chandra and Avedisian1991; Fukai et al. Reference Fukai, Zhao, Poulikakos, Megaridis and Miyatake1993; Roisman, Rioboo & Tropea Reference Roisman, Rioboo and Tropea2002; Biance, Clanet & Quéré Reference Biance, Clanet and Quéré2004; Bartolo, Josserand & Bonn Reference Bartolo, Josserand and Bonn2005; Eddi, Winkels & Snoeijer Reference Eddi, Winkels and Snoeijer2013; Josserand & Thoroddsen Reference Josserand and Thoroddsen2016; Gordillo, Riboux & Quintero Reference Gordillo, Riboux and Quintero2019). For drops that have a different temperature than the surface, much recent interest has focused on ‘Leidenfrost drops’, relatively cold droplets impacting a hot surface (Biance, Clanet & Quéré Reference Biance, Clanet and Quéré2003; Tran et al. Reference Tran, Staat, Susarrey-Arce, Foertsch, van Houselt, Gardeniers, Prosperetti, Lohse and Sun2013); the contact with the hot surface vaporises the drop near the surface which consequently rests on a vapour film. Another interesting case which has been investigated in a number of studies is the case of drops falling onto a surface that is kept at a temperature below the freezing temperature of the liquid (Madejski Reference Madejski1976; Schiaffino & Sonin Reference Schiaffino and Sonin1997; Tavakoli et al. Reference Tavakoli, Davis and Kavehpour2014; Schremb, Roisman & Tropea Reference Schremb, Roisman and Tropea2017; Thiévenaz, Séon & Josserand Reference Thiévenaz, Séon and Josserand2019; Kant et al. Reference Kant, Koldeweij, Harth, van Limbeek and Lohse2020).
Such liquid droplets impinging onto cold surfaces are not only of fundamental interest but also important for many engineering processes under extreme conditions (Symons & Perry Reference Symons and Perry1997). Pertinent examples of the latter are a rain of droplets impacting an airplane wing (Cebeci & Kafyeke Reference Cebeci and Kafyeke2003) or a cold car windshield, droplet freezing onto wind turbine wings, droplets of molten solder for electronic component printing and welding (Pasandideh-Fard, Chandra & Mostaghimi Reference Pasandideh-Fard, Chandra and Mostaghimi2002; Gielen et al. Reference Gielen, de Ruiter, Koldeweij, Lohse, Snoeijer and Gelderblom2020) and last but not least, three-dimensional printing using molten polymer droplets (Jalaal et al. Reference Jalaal, Seyfert, Stoeber and Balmforth2018). Even if the phenomenon is common, it is very complex: it encompasses different physical phenomena such as spreading dynamics and moving contact lines, the wettability of the surface, thermal transfer between the spreading droplet and the surface and freezing processes with the nucleation of the solid phase (Nauenberg Reference Nauenberg2016; Stiti et al. Reference Stiti, Castanet, Labergue and Lemoine2020). All of these phenomena are combined into one simple event and the interplay between capillarity, inertia and viscosity on the one hand and the surface wettability, heat transfer and freezing on the other hand, affect the droplet spreading dynamics and, hence, the final outcome of the impact process.
For simple liquids impacting an isothermal substrate at different velocities, the maximum spreading diameter reached by an impinging droplet has been the subject of many studies (Pasandideh-Fard et al. Reference Pasandideh-Fard, Qiao, Chandra and Mostaghimi1996; Clanet et al. Reference Clanet, Béguin, Richard and Quéré2004; Ukiwe & Kwok Reference Ukiwe and Kwok2005; Roisman Reference Roisman2009; Eggers et al. Reference Eggers, Fontelos, Josserand and Zaleski2010). Lately, a consensus was reached that, for most cases, inertia, capillarity and viscous dissipation are all important and that consequently a simple force balance between two effects is not sufficient to account for the observed maximum spreading radius. Instead, all three forces have to be taken into account, allowing us to formulate a crossover scaling between different regimes that agrees well with experiments (Laan et al. Reference Laan, de Bruin, Bartolo, Josserand and Bonn2014; Lee et al. Reference Lee, Derome, Guyer and Carmeliet2016). More recently, a theoretical model was developed that successfully predicts the full spreading dynamics of droplets impacting at different velocities and agrees also with the crossover scaling (Gordillo et al. Reference Gordillo, Riboux and Quintero2019).
When the substrate is undercooled, droplet solidification upon impact has been investigated in a number of studies, (Madejski Reference Madejski1976; Schiaffino & Sonin Reference Schiaffino and Sonin1997; Tavakoli et al. Reference Tavakoli, Davis and Kavehpour2014; Schremb et al. Reference Schremb, Roisman and Tropea2017; Herbaut et al. Reference Herbaut, Brunet, Limat and Royon2019; Thiévenaz et al. Reference Thiévenaz, Séon and Josserand2019; Herbaut et al. Reference Herbaut, Dervaux, Brunet, Royon and Limat2020; Kant et al. Reference Kant, Koldeweij, Harth, van Limbeek and Lohse2020; Koldeweij et al. Reference Koldeweij, Kant, Harth, de Ruiter, Gelderblom, Snoeijer, Lohse and van Limbeek2021). However, studies using different impact velocities to examine the interplay between spreading and freezing remain relatively scarce (Thiévenaz et al. Reference Thiévenaz, Séon and Josserand2019).
Different models already exist on freezing and arrest of the spreading drops on cold surfaces, however, these models have not been systematically tested for a wide range of impact velocities, substrate nature and liquid type. de Ruiter et al. (Reference de Ruiter, Colinet, Brunet, Snoeijer and Gelderblom2017) propose a mechanism for spreading arrest when the spreading velocity equals crystal growth velocity  $v_{front}=k \Delta T$, where
 $\Delta T=T_{liq}-T_{s}$ and
 $k$ is the kinetic cooling coefficient which is a property of the liquid used. In other terms, while the spreading velocity is higher than
 $v_{front}$, the freezing front lags behind the contact line and has little effect on the final diameter of the droplet. The contact line is arrested when its velocity is comparable or smaller than the crystal growth velocity leading to a reduction of the maximum spreading diameter. This model was used to explain the arrest of hexadecane drops on glass and copper surfaces cooled at different temperatures. The model describes well the arrest radius for hexadecane drops spreading on the two different substrates. The study concerned one liquid, hexadecane, and the impact velocity was not varied systematically as it was kept very small.
Another model was proposed by Herbaut et al. (Reference Herbaut, Dervaux, Brunet, Royon and Limat2020) where the arrest mechanism is based on a critical apparent contact angle  $\theta _L$. This model is applicable only for substrates with perfect/infinite conductivity. This model assumes that when droplets spread on a cold surface, an ice layer grows on the solid surface and forms an ice wedge close to the contact line. The apparent contact angle
 $\theta _L$ is the sum of the ice wedge angle
 $\theta _s$ and the liquid on ice contact angle
 $\theta _L-\theta _s$. The latter is obtained using Cox–Voinov theory and
 $\theta _s$ is found solving the ice front growth theoretically. Finally, an expression for
 $\theta _L(U,\Delta T)$ is given and reveals a minimum value for a certain contact line velocity
 $U*$ which corresponds to the arrest of the contact line. This arrest mechanism has similarities with the one proposed by Tavakoli et al. (Reference Tavakoli, Davis and Kavehpour2014) where the critical apparent contact angle is deduced from a critical volume of ice
 $V_c$ formed at the wedge. When the ice contact angle is similar to the apparent contact angle, water can no longer flow close to the contact line resulting in an arrest of the spreading.
These models do not consider impacts, i.e. drops falling onto the surface with non-zero velocities, but only spreading drops. Recently, Thiévenaz et al. (Reference Thiévenaz, Séon and Josserand2019) proposed another mechanism to understand how droplets impact, spread and freeze on a cold surface. In this work, an ice layer is assumed with a growth model using a one-dimensional ice front growth model based on the Stefan condition. They model the effect of freezing and the presence of the ice layer by using an effective viscosity combined with a scaling function (Laan et al. Reference Laan, de Bruin, Bartolo, Josserand and Bonn2014) to take into account the impact velocity, leading to a scaling function as  $Re_{\mathit {eff}}^{1/5}$, where
 $Re_{\mathit {eff}}$ is the Reynolds number using an effective viscosity. They compared this model with experimental data from water drop impacts on cold surfaces. The results collapse well on the scaling function and give a proper description of water drop impacts which has not been done before. While this model works well for high impact velocities, it does not apply to low impact velocities.
Recent work (Schremb et al. Reference Schremb, Roisman and Tropea2017; Kant et al. Reference Kant, Koldeweij, Harth, van Limbeek and Lohse2020) has pointed out the importance of growing ice nuclei at the surface of contact between the liquid and the substrate, and a rationalization of the interplay between ice growth and spreading was suggested to account for the maximum spreading diameter of drops on cold surfaces at very low impact velocities.
In general, when a liquid droplet hits a cold surface, it first cools and subsequently freezes. The central question is then how the characteristic time scales of freezing and spreading compare; if they are similar, ice growth inside the droplet may occur during the spreading phase leading to a significant change of the spreading behaviour. While different studies have shown this behaviour under different conditions, and different models have been proposed to account for the arrest of the drops, few studies consider the interplay between freezing and droplet inertia, i.e. the effect of droplet impact velocity systematically.
To investigate this question, we study the impact of three different liquids, water and hexadecane impacting different surfaces (glass and aluminium) set to different temperatures below the liquid freezing point. We systematically vary the impact velocity of the droplets, which accelerates the spreading dynamics, to examine the interplay between the spreading dynamics and the freezing dynamics in detail. We find that the final wetted radius is smaller for (very) cold surfaces but that this radius depends crucially on the impact velocity which plays an antagonistic role with respect to the surface temperature. We compare these observations and measurements to available models which explain some measurements reasonably well but fail for others. Confronted with these discrepancies, and based on systematic observations and measurements, we propose a simple, semi-empirical method to predict the maximum diameter of the liquid drops impacting a cold surface for different temperatures and for different impact velocities. The paper is organized as follows. We first describe our experimental set-up. We detail our observations and measurements on water droplets impacting a glass substrate at different velocities and temperatures. We discuss these results and compare them to available models. We then propose a simple model to predict the maximum spreading diameter. This model is then tested on other examples, water on aluminium, and hexadecane on glass and aluminium.
2. Materials and methods
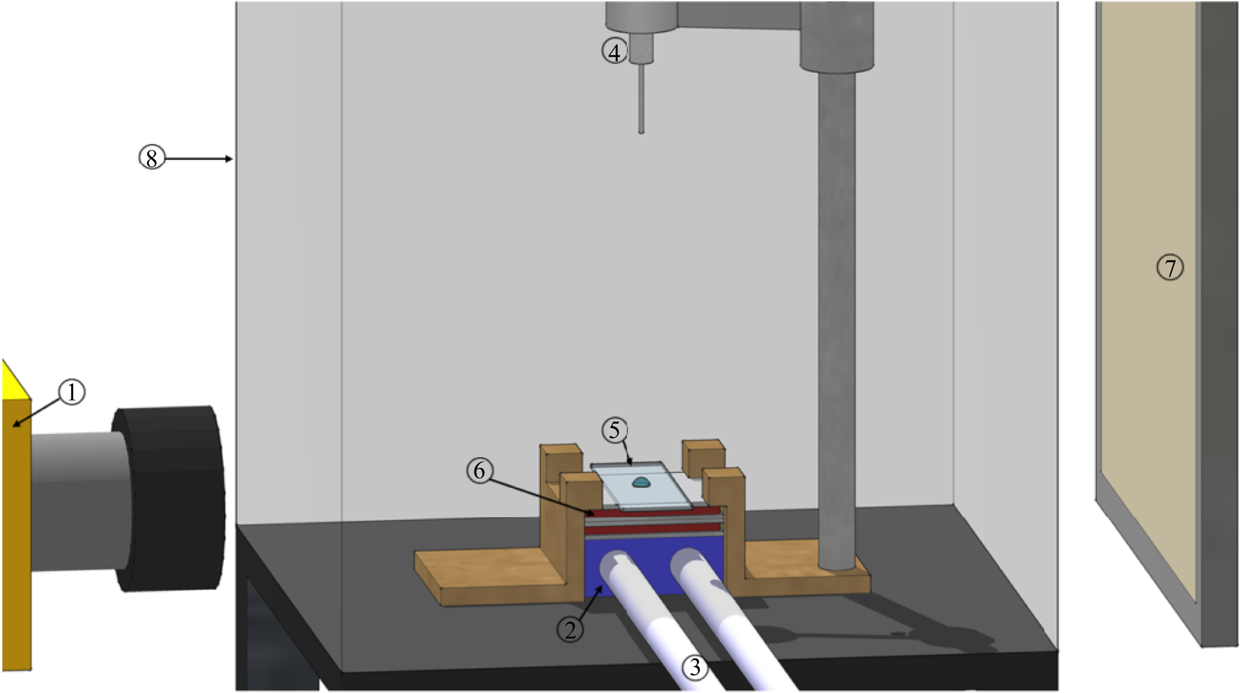
Figure 1 shows the experimental set-up. The substrate, aluminium or glass, is cooled using two peltier elements (GM 200-127-14-10 and GM 200-127-14-16) stacked on top of each other. The two stacked blocks are fixed onto a metal cooling block connected to a cooler (HUBER ministat 125) with liquid circulation fixed at  $-25\,^\circ {\rm C}$. The set-up is such that different substrates can be used; as we will see below (see Appendix A), the thermal properties of the substrate can play a major role. The temperature of the substrate can be varied down to
 $-40\,^\circ {\rm C}$. A thermocouple probe is used to measure the substrate temperature. We used two different liquids, ultra pure water (from a Milli Q system) and pure hexadecane (from Sigma). A syringe pump connected to a needle is used to generate droplets with a size in the range of millimetres in diameter. The temperature of the injected liquid is set to 22
 $^\circ$C. The needle tip was set at a fixed height
 $H$ which can be varied from a few millimetres up to several centimetres. The height
 $H$ fixes the impact velocity of the droplet which can be varied from 0.1 up to 1.20 m s
 $^{-1}$. The impact velocity controls droplet inertia and, thus, the spreading dynamics and gives additional control to study the interplay between the dynamics of freezing and that of spreading.
Experimental set-up for droplet impacts: (1) phantom fast camera, (2) aluminium block, (3) cooling tubing system, (4) needle, (5) glass substrate, (6) peltier modulus, (7) light panel, (8) transparent plastic box.

The droplets are sufficiently small compared with the capillary length  $l_c=(\gamma / \rho g)^{1/2}$ so that gravity does not affect the droplet shape which is spherical before impact. The whole set-up is housed inside a Plexiglas box where filtered dry air is blown to maintain a constant relative humidity of less than 5 %. Keeping a low humidity is essential to avoid frost formation onto the substrate. We used three different types of glass surfaces characterized by three different wettabilities. The hydrophilic surface used is a glass slide (thickness 1 mm from Thermo Scientific Superfrost) cleaned using soapy water and rinsed several times with distilled water. The contact angle of water on this surface is
 ${\approx }35^\circ$. A superhydrophilic glass slide is obtained after a thorough cleaning using soapy water, pure water and ethanol followed by an air plasma cleaning for 20 min to remove all impurities. The contact angle of water on this surface is indistinguishable from zero. We also used hydrophobic surfaces obtained by applying a silanization of the glass slides (using octadecyltrichlorosilane in toluene and then washed with chloroform). The contact angle of water on this surface is near
 $95^\circ$. We record all droplet impacts, spreading and freezing with a fast camera (Phantom V640 with frame rates up to 20 000 f.p.s.) and an infrared camera (FLIR SC7000 with frame rates up to 400 f.p.s.). The analysis of the spreading dynamics of the droplets is carried out using Matlab.
3. Experimental measurements
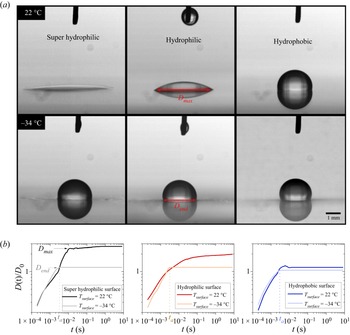
We first examined the effect of surface wettability on the spreading dynamics of a water droplet at room temperature and at a temperature well below the freezing temperature of water. Figure 2 shows the final shape of droplets after impacting the three different types of surfaces at two different temperatures: the isothermal case at  $22\,^\circ {\rm C}$ and the undercooled case at
 $-34\,^\circ {\rm C}$.
Droplet impacts ( $V_0=0.25$ m s
 $^{-1}$) on different glass surfaces at 22
 $^\circ$C and
 $-34\,^\circ$C with the associated spreading dynamics. Snapshots taken at 0.2 s after impact. Here
 $D_{max}$ is the maximum spreading diameter for isothermal case while
 $D_{end}$ is the one after impact on a cold surface.

The impact velocity is kept relatively small at around 0.25 m s $^{-1}$; as we will see below, the impact velocity plays an important role. At room temperature, the droplet spreads to a large radius for the superhydrophilic surface and to a small radius for the hydrophobic one. Below freezing, the distinction between the three different surfaces almost disappears. The droplet spreads very little and the three different surfaces give rise to roughly the same final state of the droplet. The pictures of the drops are taken 0.2 s after impact, when all hydrodynamic motion has ceased. The cold drops are observed to freeze in the bulk just afterwards.
In the impact experiments, the diameter of the droplet  $D(t)$ increases rapidly vs time
 $t$ for all cases, typically most of the spreading occurs in the first few milliseconds as shown in the plots of figure 2. This diameter then reaches a final value
 $D_{max}$. The maximum spreading diameter
 $D_{max}$ is defined as the diameter for which the spreading velocity vanished
 ${{\rm d}D}/{{\rm d}t} \sim 0$. For the low temperature case, all the dynamics is similar with the drop reaching a small final radius
 $D_{end}$ rather similar to the case of the hydrophobic surface. Note also that this final radius is reached at about the same time, which we note
 $t_a$. The cold temperature of the surface leads to freezing of the liquid. This freezing arrests the contact line during its spreading and, thus, highly reduces the final spreading diameter. There is no difference between the three different surfaces as the spreading dynamics vs time is similar for low temperatures.
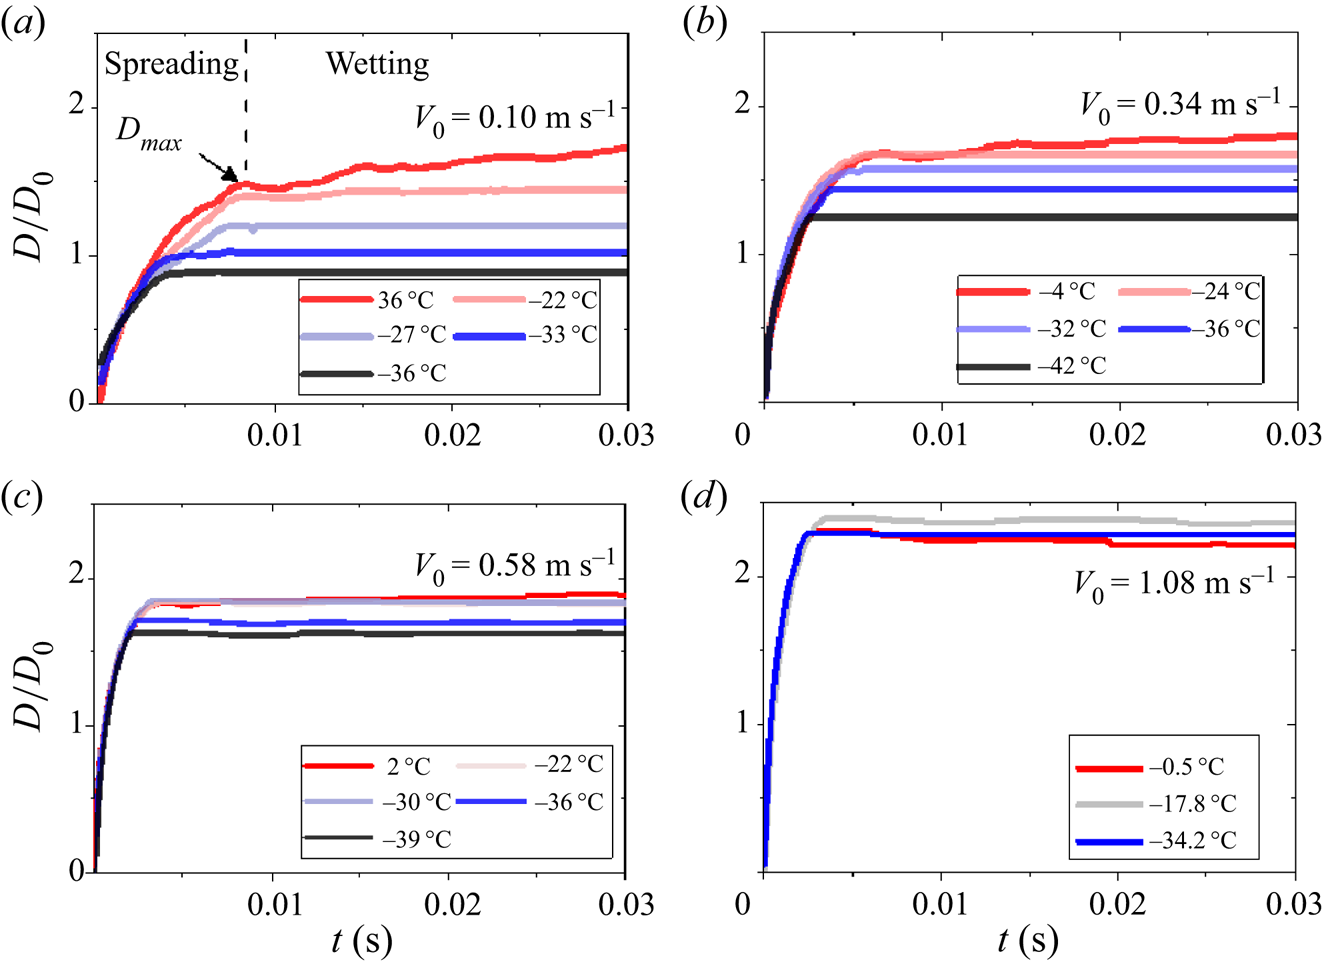
Besides the role of surface temperature, the spreading dynamics of droplets is known to be affected by the impact velocity of the droplets. To examine the combined role of substrate temperature and drop impact velocity, we present in figure 3 spreading dynamics of water droplets impinging a hydrophilic surface maintained at different temperatures and for four different impact velocities.
Spreading factor  ${D(t)}/{D_{0}}$ for water droplets (
 $D_0 = 2.00$ mm) impinging hydrophilic glass surfaces at different temperatures for different impact velocities.

For the isothermal case, it is known that droplet spreading has several distinct spreading regimes: fast spreading at short times, due to inertia and capillarity, and a slower spreading at long times controlled by the surface wettability.
After the initial fast spreading, the drop expansion stops at late times. We observe that the maximum radius attained depends both on the substrate temperature and the velocity of impact: the lower the temperature the smaller the maximum spreading diameter; also the higher the impact velocity the larger is the maximum spreading diameter.
The observation that for very cold surfaces the expansion stops very rapidly suggests that there is a direct competition between substrate temperature and impact velocity which play antagonistic roles in the spreading. When the substrate temperature decreases, the cooling and freezing dynamics of the drop is the most important factor for the outcome (de Ruiter et al. Reference de Ruiter, Colinet, Brunet, Snoeijer and Gelderblom2017; Kant et al. Reference Kant, Koldeweij, Harth, van Limbeek and Lohse2020). On the other hand, when the impact velocity increases, the spreading dynamics is so fast that the thermal effects become unimportant.
4. Results and discussion
In principle if the freezing dynamics is faster than the spreading dynamics then the droplet will freeze before it fully spreads, the final spreading diameter  $D_{end}$ will be smaller than the diameter
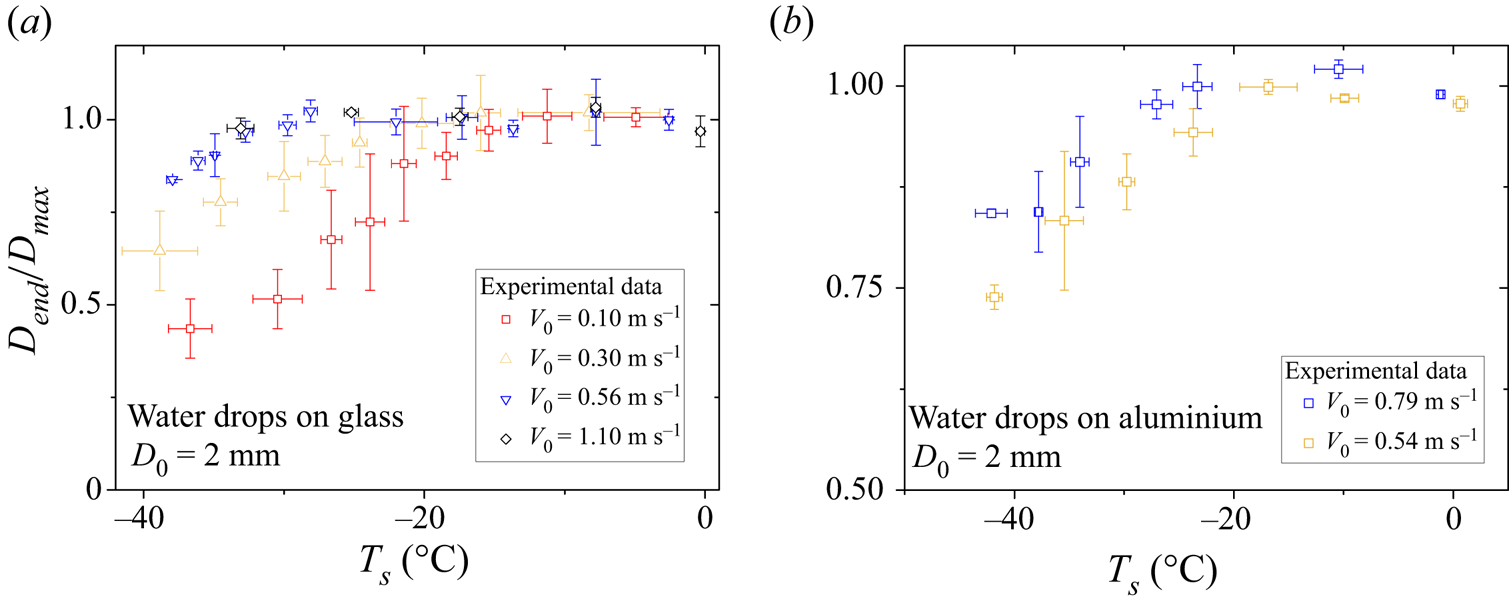
 $D_{max}$ of a droplet impacting a surface at ambient temperature. If on the other hand, the spreading dynamics, which is directly influenced by the impact velocity of the droplet (inertial effects), is faster than the freezing dynamics, then the maximum diameter reached can be hardly influenced by the freezing dynamics. In order to quantify the combined effect of substrate temperature and impact velocity, we plot the maximum normalized spreading diameter
 $D_{end}/D_{max} = {D_{max}(T_s)}/{D_{max}(T_s=23\,^\circ {\rm C})}$ vs substrate temperature
 $T_s$ for droplets impinging at different impact velocities and for two different substrates in figure 4.
Maximum normalized spreading diameter of water drops impacting a (a) glass surface and (b) aluminium surface. Drop impacts are done at different velocities  $V_0$ and for a different substrate temperature
 $T_s$. Drop diameter
 $D_0=2$ mm.

This figure shows that the maximum diameter decreases with decreasing surface temperature for low impact velocities, contrary to the higher impact velocities where the maximum diameter becomes almost independent of substrate temperature as anticipated. The effect of substrate temperature becomes weaker and weaker as the velocity increases up to where the surface temperature has no effect on the maximum spreading diameter as is the case for the highest impact velocity shown. Our results are in line with previous experiments carried out using hexadecane on glass and copper substrates (de Ruiter et al. Reference de Ruiter, Colinet, Brunet, Snoeijer and Gelderblom2017) which show similar trends, but this study did not examine the effects of impact velocity on the maximum spreading diameter of the drops.
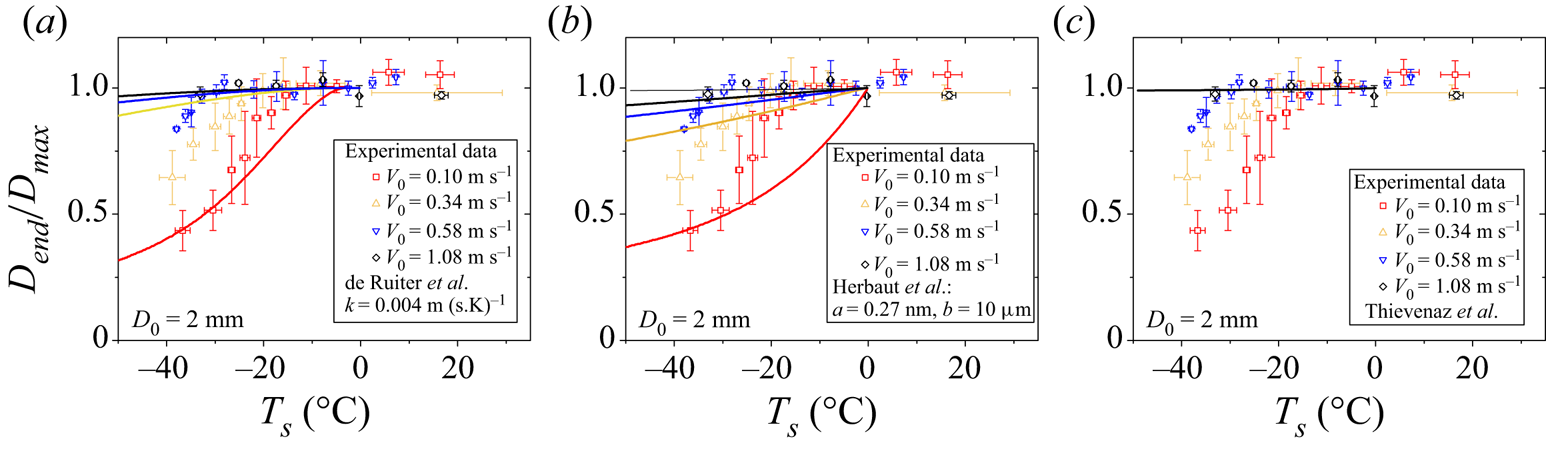
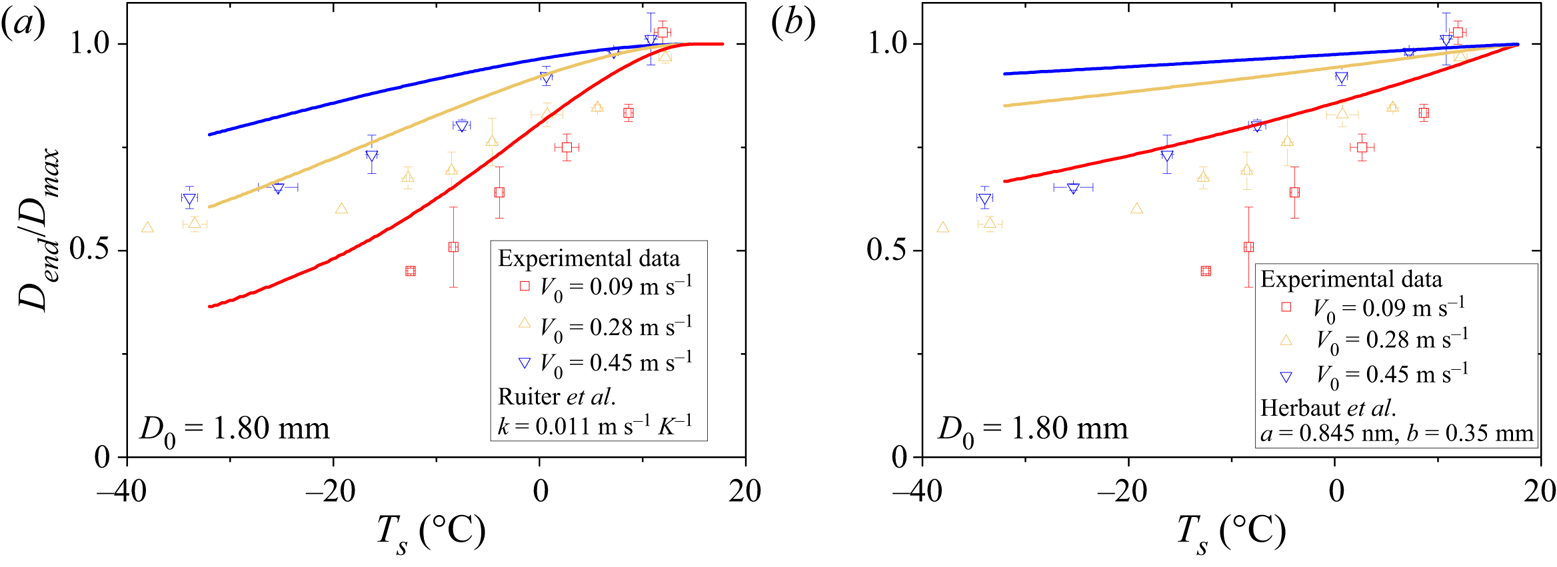
In figure 5 we show our data for water drops impacting a glass surface at different temperatures and for different velocities. Along with our data, we superimpose the theoretical predictions from three models proposed in different studies (de Ruiter et al. Reference de Ruiter, Colinet, Brunet, Snoeijer and Gelderblom2017; Thiévenaz et al. Reference Thiévenaz, Séon and Josserand2019; Herbaut et al. Reference Herbaut, Dervaux, Brunet, Royon and Limat2020). The models from de Ruiter et al. (Reference de Ruiter, Colinet, Brunet, Snoeijer and Gelderblom2017) and Herbaut et al. (Reference Herbaut, Dervaux, Brunet, Royon and Limat2020) both use an arrest criterion based on a critical velocity. To fit our data to the predictions of these models, we compare this critical velocity with the spreading velocity of the drops which is deduced from a recent model for the spreading of drops impacting solid substrates at different velocities and introduced by Gordillo et al. (Reference Gordillo, Riboux and Quintero2019). This model, see Appendix B and Gorin et al. (Reference Gorin, Di Mauro, Bonn and Kellay2022), explains the spreading dynamics of drops impacting different substrates remarkably well. Further, the fitting parameters such as the kinetic cooling coefficient  $k$ (de Ruiter et al. Reference de Ruiter, Colinet, Brunet, Snoeijer and Gelderblom2017) and the mesoscopic length
 $b$ (Herbaut et al. Reference Herbaut, Dervaux, Brunet, Royon and Limat2020) for each model is chosen to give the most relevant fit at low impact velocity. While the comparison to these two models is reasonable for the low velocity case, both models do less well at higher velocities. The comparison to the model of (Thiévenaz et al. Reference Thiévenaz, Séon and Josserand2019) also overestimates the data for all temperatures and especially the lower velocities for which it is not applicable in principle.
Maximum normalized spreading diameter  $D_{end}/D_{max}$ of water drop impacts on glass surface: solid lines are models from (a) de Ruiter et al. (Reference de Ruiter, Colinet, Brunet, Snoeijer and Gelderblom2017), (b) Herbaut et al. (Reference Herbaut, Dervaux, Brunet, Royon and Limat2020) and (c) Thiévenaz et al. (Reference Thiévenaz, Séon and Josserand2019).

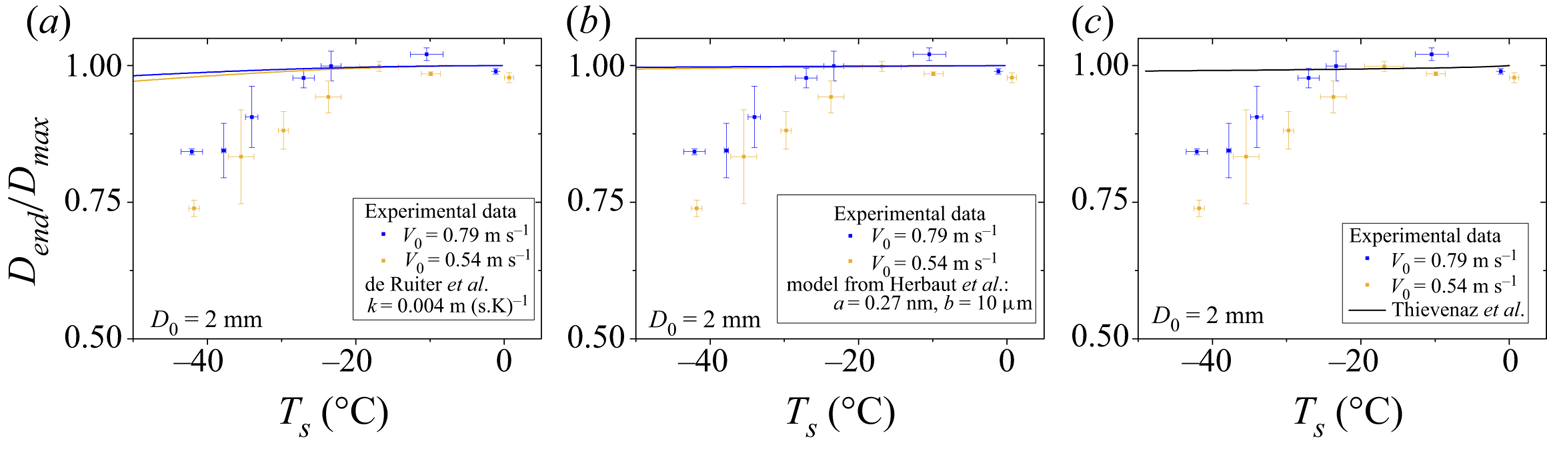
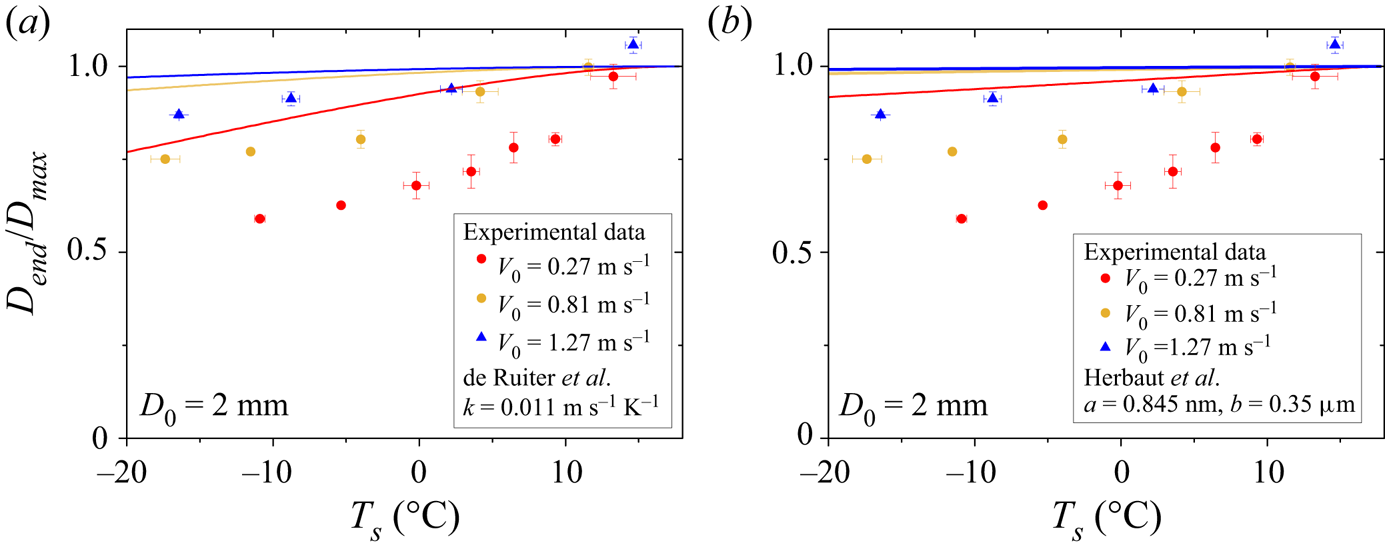
Understanding the interplay between droplet inertia and freezing for the case of water on glass is thus not fully accounted for with available models. To examine whether this is also the case for other combinations of fluid and substrate, we have carried out additional experiments using water on aluminium (see figure 4b). Changing the substrate allows us to change the conductivity of the solid surface and, thus, the contact temperature at the liquid solid surface. Our results along with the three different models are shown in figure 6. We kept the same parameters for the models as for the glass substrate. These parameters are a property of the liquid and should not depend on the impact velocity or the thermal conductivity of the substrate. Again a comparison to available models turns out to be deficient.
Maximum normalized spreading diameter  $D_{end}/D_{max}$ of water drop impacts on aluminium surface: solid lines are models from (a) de Ruiter et al. (Reference de Ruiter, Colinet, Brunet, Snoeijer and Gelderblom2017), (b) Herbaut et al. (Reference Herbaut, Dervaux, Brunet, Royon and Limat2020) and (c) Thiévenaz et al. (Reference Thiévenaz, Séon and Josserand2019).

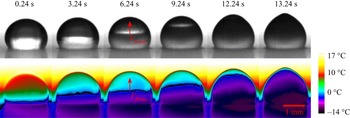
In most models of drop arrest due to phase change, an ice layer which can be homogeneous or inhomogeneous (an ensemble of ice nuclei on the surface) is invoked. In figure 7 photographs taken at different times of a drop freezing on a cold surface using a camera and an infrared camera are shown. These images show that the freezing front, visible as a line in the photographs and as a sharp temperature step in the infrared images, starts at the lower end of the droplet in contact with the substrate and advances up to the top of the droplet. The whole droplet then freezes as illustrated by the presence of a cusp at its pole (Enríquez et al. Reference Enríquez, Brunet, Colinet, Snoeijer and Marín2014; Jambon-Puillet, Shahidzadeh & Bonn Reference Jambon-Puillet, Shahidzadeh and Bonn2018). Regardless of the mechanism of contact line arrest, it is plausible that spreading will stop only when a sufficiently thick ice layer is present at the solid liquid interface during the spreading of the liquid. It is difficult to make quantitative measurements of the ice layer thickness from images such as those of figure 7 due to the curvature of the drop. However, complementary experiments, see Appendix A, allow us to measure the ice front growth vs time more accurately.
Freezing dynamics of a sessile droplet on a glass substrate at  $-34\,^\circ {\rm C}$. Note the moving ice front both in the visible images as a line and in the infrared images as a sharp temperature step. The temperature scale is shown to the right.

To estimate the average thickness of an ice layer on the solid substrate, we use the spreading dynamics and a one-dimensional model for ice front growth.
We first determine the drop arrest time  $t_{a}$ from the spreading dynamics of different drops at different temperatures and impact velocities. We then solve for the ice layer thickness vs time (see Appendix A) using the Stefan problem which has been solved with different levels of detail included (Nauenberg Reference Nauenberg2016; Thiévenaz et al. Reference Thiévenaz, Séon and Josserand2019; Kant et al. Reference Kant, Koldeweij, Harth, van Limbeek and Lohse2020; Stiti et al. Reference Stiti, Castanet, Labergue and Lemoine2020). This model is tested here in dedicated experiments using a small pipette with similar dimensions as the drops. The data are shown in Appendix A for the case of water freezing on glass and aluminium. From the obtained temporal evolution of the ice layer height
 $h(t)$ we obtain the height of the ice layer
 $h(t{_a})=h_{crit}$ corresponding to the arrest time
 $t_{a}$.
We have determined  $t_{a}$ from all of our experiments using water and different substrates. Using the freezing model, we determined the value of
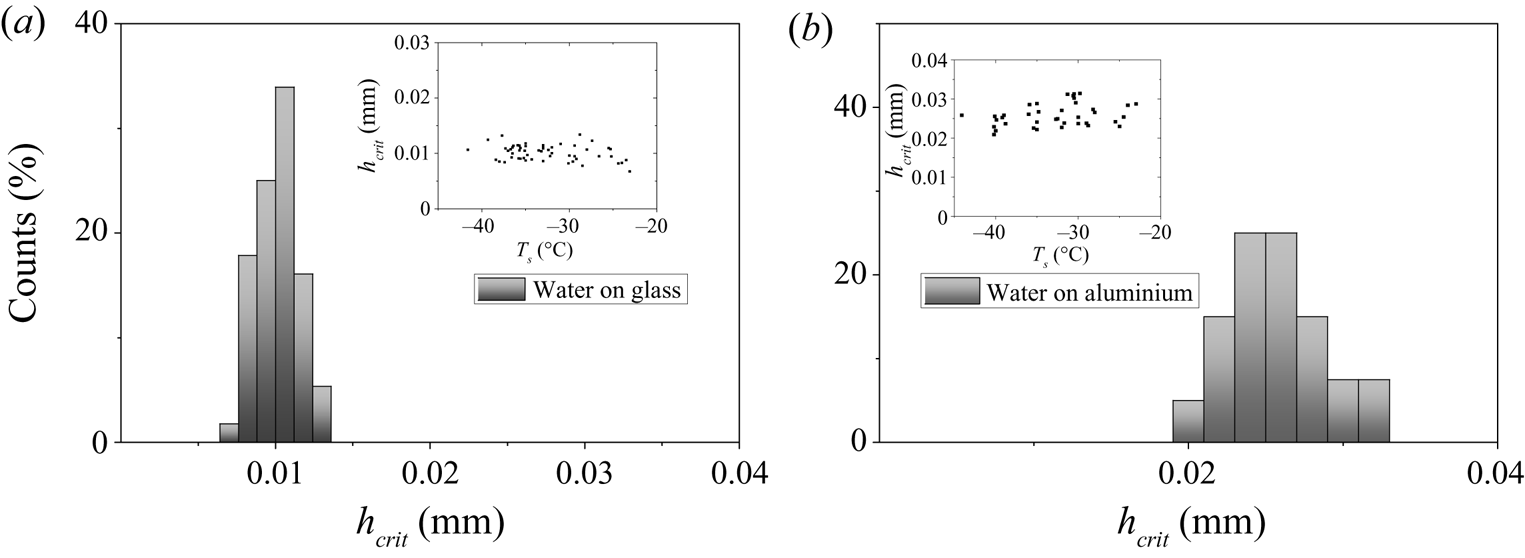
 $h(t_a)$. These thickness values obtained for different impact velocities and different substrate temperatures turn out to have a well-defined mean value and a roughly symmetrical histogram as figure 8 shows. The mean value obtained from the histograms is near 10
 $\mathrm {\mu }$m for water on glass and 26
 $\mathrm {\mu }$m for water on aluminium. This thickness turns out to be roughly constant with the temperature of the substrate and independent of impact velocity, as shown in the insets of figure 8, within the precision of our measurements.
Histograms of critical solidified layer thickness  $h_{crit}$ for water drop impacts on (a) glass and (b) aluminium. Inset shows values of
 $h_{crit}$ vs substrate temperature. Data from different velocities are used without distinction.

This observation, even if the thickness is not measured directly but estimated using a validated model for the ice layer growth (Appendix A), of roughly constant thickness of the ice layer on the substrate can actually be used to predict the observed diameters of the drops. In fact, we can model all of our results using this assumption of constant thickness. Suppose that the arrest of the spreading occurs when a critical thickness of the solid or ice layer is reached. Using the one-dimensional model for ice growth (see Appendix A), this thickness is reached at a time  $t_a$ corresponding to the time of arrest. Once this time of arrest is determined, we use a model proposed recently (Gordillo et al. Reference Gordillo, Riboux and Quintero2019) to describe the spreading diameter dynamics for isothermal drops impacting at different velocities and drop dimensions (see Appendix A). Gordillo et al. proposed a set of ordinary differential equations to describe the spreading diameter dynamics following an impact; the droplet spreads as a thin film of liquid with a rim at its edge. Using mass and momentum conservation between the rim, the thin film and the droplet, they found an expression for
 $D(t)$.
Here we use the solutions of this model for the droplet spreading dynamics at room temperature and depending on droplet properties (impact velocity, droplet size, density, viscosity and surface tension). Using this model, we can obtain the value of  $D(t_{a})$ which we identify as the sought for diameter of the drop when it is arrested
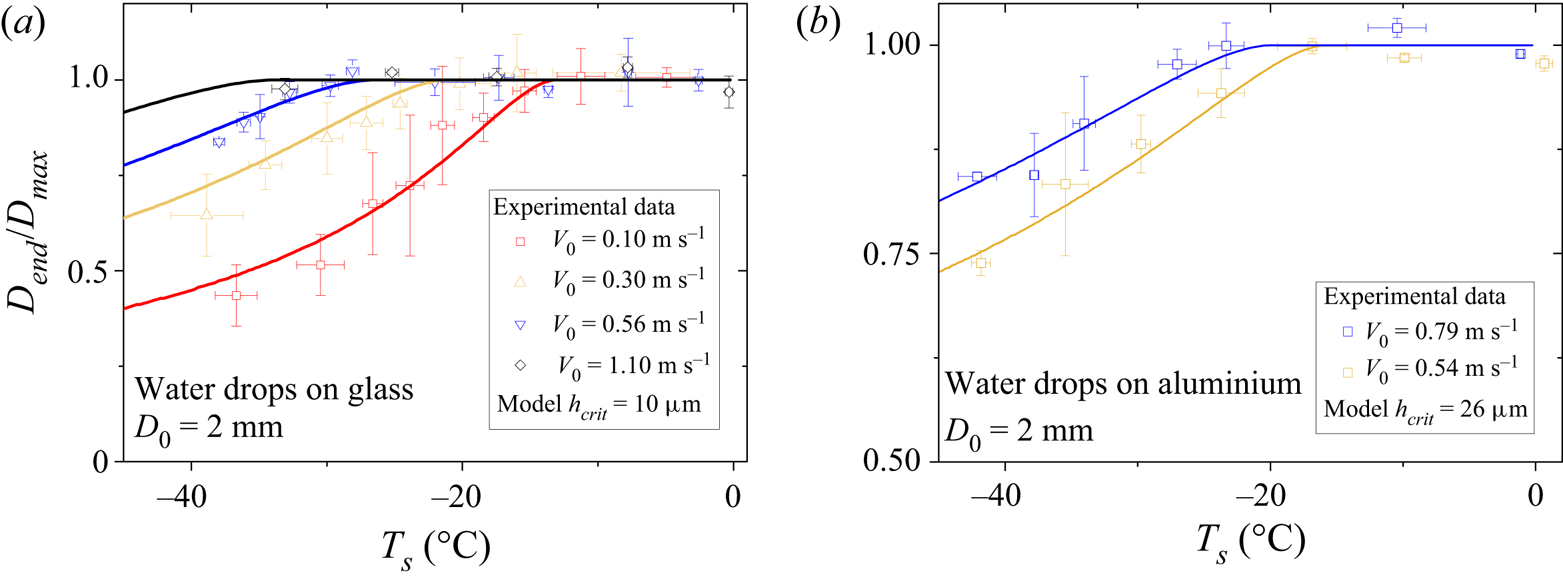
 $D$ for different impact velocities and different substrate temperatures. The results of this approach using a model for the ice layer height vs time and the spreading model are shown as solid lines in figure 9.
Maximum normalized spreading diameter  $D_{end}/D_{max}$ of water drop impacts on (a) glass and (b) aluminium surface: solid lines are predictions from constant critical layer thickness
 $h_{crit}$.

The agreement between our experimental values of the maximum spreading diameter, figure 9, for different impact velocities vs the substrate temperature is excellent both for impacts on glass and aluminium. The value of  $h_{crit}$ used to describe the data is of 10
 $\mathrm {\mu }$m for the glass substrate and 26
 $\mathrm {\mu }$m for aluminium and independent of either velocity or substrate temperature and in accord with our estimates of figure 8. This is the main finding of our paper: spreading stops when a constant and microscopic thickness of the ice layer is reached regardless of the mechanism for this arrest.
To further explore whether a constant mean thickness of the solid phase on the substrate is associated with drop arrest, we have examined two other cases using a different fluid, hexadecane, impacting two different substrates, glass and aluminium. We proceed similarly to the case of water drop impacts.
In figures 10 and 11 we show the results for  $D_{end}/D_{max}$ of hexadecane drops on glass and aluminium, respectively, vs temperature for different impact velocities. A similar phenomenology is observed: the maximum spreading diameter decreases with decreasing temperature with an antagonistic effect due to drop inertia. Again the two substrates give consistent results. The comparison of our experimental results to different models is superimposed on the experimental data. The models of Herbault et al. and that of de Ruiter et al. reproduce the observed trends, however, a clear deviation is observed especially for aluminium, when the velocity of impact increases. Again and while these models capture the essential behaviour, a quantitative agreement with their predictions is not achieved when droplet inertia becomes important.
Maximum normalized spreading diameter  $D_{end}/D_{max}$ of hexadecane drop impacts on glass surface: solid lines are models from (a) de Ruiter et al. (Reference de Ruiter, Colinet, Brunet, Snoeijer and Gelderblom2017), (b) Herbaut et al. (Reference Herbaut, Dervaux, Brunet, Royon and Limat2020).

Maximum normalized spreading diameter  $D_{end}/D_{max}$ of hexadecane drop impacts on aluminium surface: solid lines are models from (a) de Ruiter et al. (Reference de Ruiter, Colinet, Brunet, Snoeijer and Gelderblom2017), (b) Herbaut et al. (Reference Herbaut, Dervaux, Brunet, Royon and Limat2020).

As for the case of water, we proceed to estimate an average solid layer height from our experimental measurements of the arrest time  $t_a$ using the one-dimensional solid front growth dynamics model. The results of our estimates are shown in figure 12. The histogram of the mean thickness shows the presence of a well-defined mean thickness for both cases. Further, for hexadecane on glass, the thickness seems to be independent of velocity and substrate temperature. For aluminium however, we observe a mild variation with temperature of this mean thickness.
Histograms of critical solidified layer thickness  $h_{crit}$ of hexadecane drop impacts on (a) glass and (b) aluminium. Inset shows values of
 $h_{crit}$ with substrate temperature.

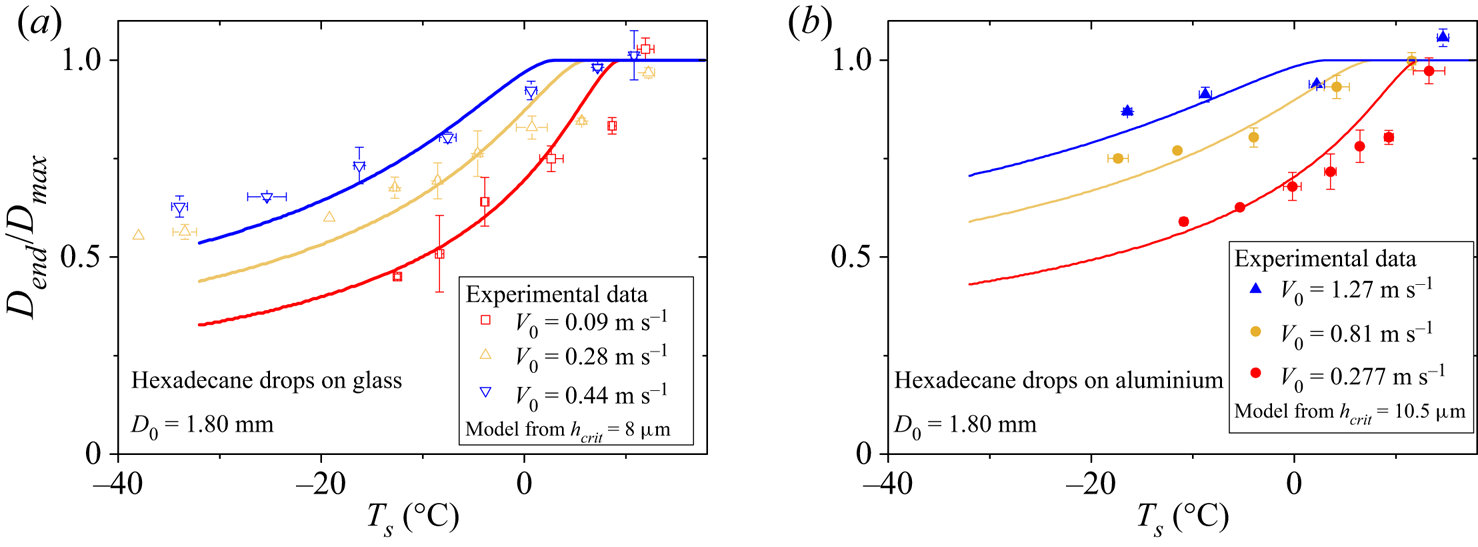
For the four cases considered, the results seem to show that a roughly constant mean thickness of the ice or solid layer can be assumed. That this hypothesis is robust comes from additional comparisons using hexadecane. The results are shown in figure 13 and are very well described using the same assumption of a critical height for the solid layer near the surface. The critical heights used for the fits are in good agreement with the expected heights extracted using the true arrest time.
Maximum normalized spreading diameter  $D_{end}/D_{max}$ of hexadecane drop impacts on (a) glass and (b) aluminium surface: solid lines are predictions from constant critical layer thickness
 $h_{crit}$.

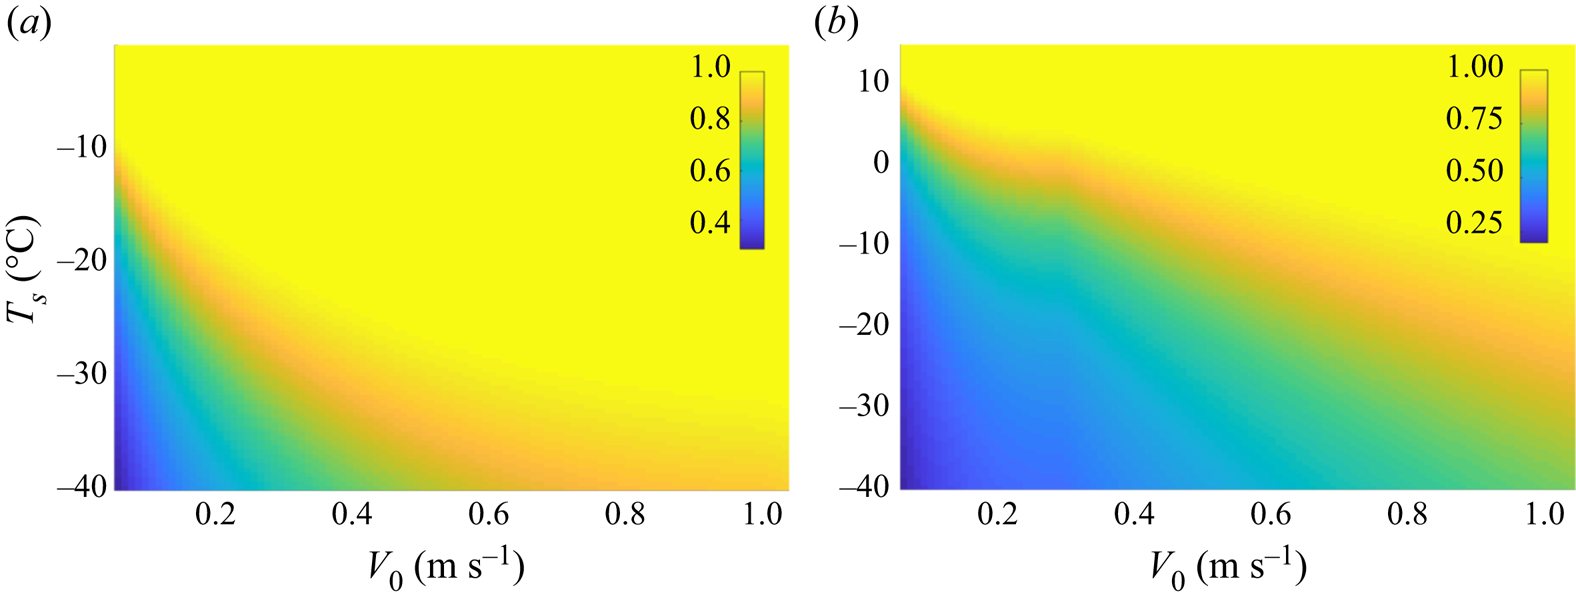
Despite its simplicity, this method based on the assumption that spreading stops when a critical ice layer thickness is reached, explains our measurements and results adequately for two different liquids and two different substrates. A summary of our findings as well as the results of our simple model can be represented using the colour map in figure 14 where the value of the maximum spreading diameter can be found for any pair of impact velocity and temperature for two different liquids. This diagram is constructed using one parameter, the critical thickness of the solid layer. This diagram thus summarizes droplet arrest vs the two main parameters of the problem: the substrate temperature and the velocity of impact. Such a diagram can actually be constructed for different substrates and for other liquids once the critical thickness is determined from a few cases.
Colour maps of  $D_{end}/D_{max}$ dependence on impact velocity
 $V_0$ and substrate temperature
 $T_s$ for (a) water droplets (
 $D_0=2$ mm) and (b) hexadecane droplets (
 $D_0=1.74$ mm) impacting a smooth hydrophilic glass surface.

As mentioned above, other theories for the arrest of the motion of the spreading droplets have been proposed. In the model of reference de Ruiter et al. (Reference de Ruiter, Colinet, Brunet, Snoeijer and Gelderblom2017), it is rather the competition between the growth of ice nuclei and the spreading dynamics speed which determines the arrest of the droplets. Nevertheless, the area occupied by the ice nuclei on the solid surface has to be close to the full surface of the drop for the contact line to be arrested as found in (Koldeweij et al. Reference Koldeweij, Kant, Harth, de Ruiter, Gelderblom, Snoeijer, Lohse and van Limbeek2021). It is possible that the contact area would need to be covered by some threshold density of ice nuclei for arresting the contact line. Whether our hypothesis of a constant mean ice layer thickness and a sufficient coverage of the surface by ice crystals are similar is a possibility. Most models (Thiévenaz et al. Reference Thiévenaz, Séon and Josserand2019; Herbaut et al. Reference Herbaut, Dervaux, Brunet, Royon and Limat2020) assume some homogeneous or heterogeneous ice layer. Our experiments show that this ice layer has a well-defined mean thickness which depends on the combination of liquid and substrate but independent of the temperature and the impact velocity. While our measurements of the arrest dynamics and, in particular, the time of arrest of the drops coupled to a simple model of ice front growth show that the thickness of the ice layer is independent of substrate temperature and impact velocity, it would be desirable to measure this thickness directly, but this is technically very difficult. Further, it should be kept in mind that the ice front model was validated under hydrostatic conditions while the spreading is a dynamic process. Nevertheless, we show that such a constant thickness scenario allows us to predict droplet arrest under a variety of conditions.
To conclude, we report an experimental work of droplets impinging, at different velocities, a cold surface and freezing during the spreading phase. We found that the maximum spreading diameter of the droplets after impact can be expressed through simple arguments invoking an ice layer growing from the solid liquid interface and arresting the contact line when the ice layer reaches a critical thickness  $h_{crit}$. From a knowledge of the ice front velocity, the value of
 $h_{crit}$, and the droplet spreading dynamics, the maximum spreading diameter can be obtained for any impact velocity and temperature. This method can be used for different liquids as we show for water and hexadecane and different substrates.
Acknowledgements
We thank K. Xie, S. Cassagnere, A. Tempel, L. Haelman and N. Kellay for help with experiments. We also thank M. Jalaal for discussions. We thank N. Quillent-Elinguel for help with the graphical abstract.
Funding
This research received no specific grant from any funding agency, commercial or not-for-profit sectors.
Declaration of interests
The authors report no conflict of interest.
Appendix A. Freezing model
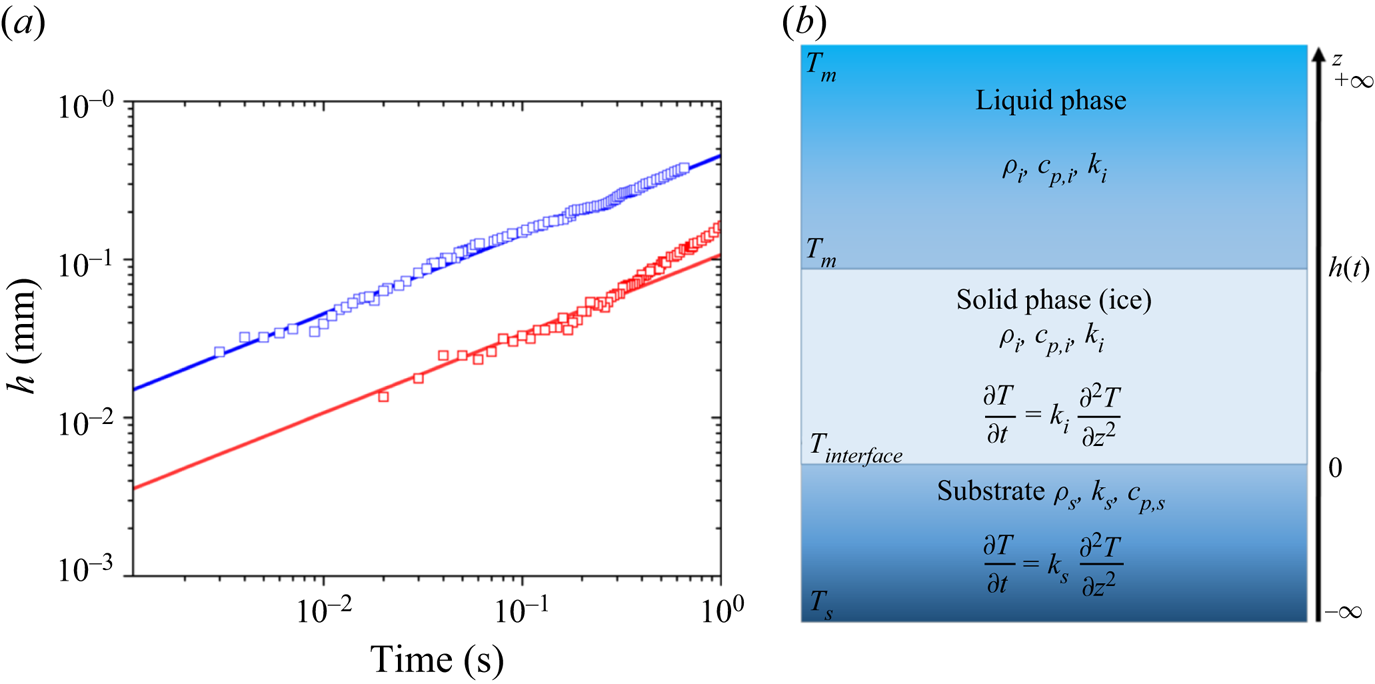
To describe how the freezing front grows inside the droplet, we assume that the system can be simplified as a semi-infinite liquid in contact with a semi-infinite solid maintained at temperature  $T_s$ lower than the melting point
 $T_m$ with a solid phase nucleating at the interface (see figure 15). This is known as the Stefan problem and has been solved with different boundary conditions (Nauenberg Reference Nauenberg2016; Thiévenaz et al. Reference Thiévenaz, Séon and Josserand2019; Kant et al. Reference Kant, Koldeweij, Harth, van Limbeek and Lohse2020; Stiti et al. Reference Stiti, Castanet, Labergue and Lemoine2020). As can be seen in figure 15, we choose the same model as that used by Thiévenaz et al. (Reference Thiévenaz, Séon and Josserand2019) by assuming our liquid at
 $T_m$ right after impact.
(a) Freezing front growing inside a pipette which is placed on the cold microscope glass slide or an aluminium block maintained at  $T_s=-20\,^\circ {\rm C}$. Water is at
 $T_l=+23\,^\circ {\rm C}$ before entering in contact with the substrate. Numerical solutions of the freezing model coming from (A5) are reported for both substrates as solid lines (aluminium in blue and glass in red). (b) A schematic of the freezing model used.

We denote  $k_n$,
 $\rho _n$,
 $c_{p,n}$ as the thermal conductivity, density and heat capacity of the phase of index
 $n$ which is
 $s$ for substrate,
 $i$ for ice and
 $l$ for liquid. The thermal diffusion coefficient and the effusivity are given by
 $D_n={k_n}/{\rho _{n} c_{p,n}}$ and
 $e_n=\sqrt {k_n\rho _{n} c_{p,n}}$, respectively. The problem is governed by the heat diffusion equations (see figure 15b) inside the three media and the Stefan condition (see (A1)) which states that from conservation of energy, the latent heat
 $L$ released at the interface is dissipated through the solid and liquid phase. As we fix the liquid temperature to
 $T_l=T_m$, heat is only dissipated through the solid phase,
 \begin{equation} \rho_iL\frac{{\rm d}T}{{\rm d}t}=k_i\frac{{\rm d}T}{{\rm d}z}. \end{equation}
The heat diffusion equations inside the two media (solid phase and substrate) are written as
 \begin{gather} \frac{\partial T}{\partial t}=k_{s}\frac{\partial^{2} T }{\partial z^{2}}, \quad t>0 \ \text{and}\ z(t)<0 \quad \text{substrate}, \end{gather}
 \begin{gather}\frac{\partial T}{\partial t}=k_{i}\frac{\partial^{2} T }{\partial z^{2}}, \quad t>0 \ \text{and}\ 0< z(t)< h(t) \quad \text{solid phase}. \end{gather}
The initial and boundary conditions for  $h(z,t)$,
 $T_s(z,t)$ and
 $T_l(z,t)$ are
 \begin{equation} h(0,0)=0, \quad T_{s}(0,0)=T_{s},\quad T_{l}(0,t)=T_{m},\quad \lim_{z \to +\infty} T_{l}(z,t)=T_{m}. \end{equation}
An analytical solution of these equations can be written using a similarity variable  $\eta$,
 \begin{equation} h(t)=2 \eta \sqrt{D_{i}t}, \end{equation}
with  $\eta$ a parameter obtained solving the transcendental equation resulting from the Stefan condition (A1),
 \begin{equation} St=\sqrt{\rm \pi}\eta \,{\rm e}^{\eta^2}\left(\frac{e_i}{e_s}+erf(\eta)\right), \end{equation}
with  $St={c_{p,i}(T_m-T_s)}/{L}$ the Stefan number. Solving (A6) and replacing the solution for
 $\eta$ in (A5) gives the freezing front dynamics
 $h(t)$.
From this freezing front dynamics we deduce the moment the drop is arrested, i.e. at  $t_{a}$. This model has already been used and validated in different studies (Thiévenaz et al. Reference Thiévenaz, Séon and Josserand2019; Kant et al. Reference Kant, Koldeweij, Harth, van Limbeek and Lohse2020). Our own experimental measurements show that it is relevant in our context as we report in figure 15: the freezing front dynamics is well described at early times. In these experiments, we use a pipette with a radius comparable to our drops, which we partially fill with water and place onto the cold substrate. The water temperature is
 $23\,^\circ {\rm C}$ before entering in contact with the cold substrate. We neglect thermal transfer between the pipette walls and water and we measure the ice front propagation growing inside the pipette. We use two different substrates: glass and aluminium with two different thermal conductivities
 $k_{glass}=1.1$ and
 $k_{alu}=239$ W m
 $^{-1}$ K
 $^{-1}$. This figure shows that the ice front height increases with time and that this increase depends on the nature of the substrate. For aluminum, which has a high effusivity
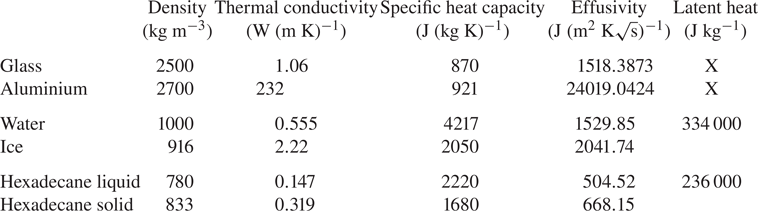
 ${e_s}$, the ice front dynamics follows the prediction of the model very well. The freezing front dynamics on glass (see figure 15) is also well described by the model at early times up to at least 0.2 s. At later times the height deviates from expected behaviour most probably because the glass substrate has a small thickness and cannot be considered as a semi-infinite medium: heat transfer is enhanced by the contact with the peltier. Since the arrest times are all in the 10 ms range, the model is sufficient. The parameters used in the model are given in table 1.
Thermal properties of water, hexadecane (Vélez, Khayet & Ortiz de Zárate Reference Vélez, Khayet and Ortiz de Zárate2015), glass and aluminium.

Appendix B. Spreading model
To predict  ${D_{end}}/{D_{max}}$, one needs to know the spreading dynamics of the impacting drop and, thus, the variation of
 $D(t)$ to determine
 $D(t_{a})$ which we identify as the maximum diameter of the drop. Recently, Gordillo et al. (Reference Gordillo, Riboux and Quintero2019) proposed a model based on a set of ordinary differential equations to describe the spreading dynamics and, thus,
 $D(t)$ of a drop impacting a solid surface at any velocity
 $V$. The droplet starts out as a sphere and spreads as a thin film of liquid preceded by a rim at its edge. Using arguments of mass and momentum conservation between the rim, the thin film and the droplet, they can solve for
 $D(t)$.
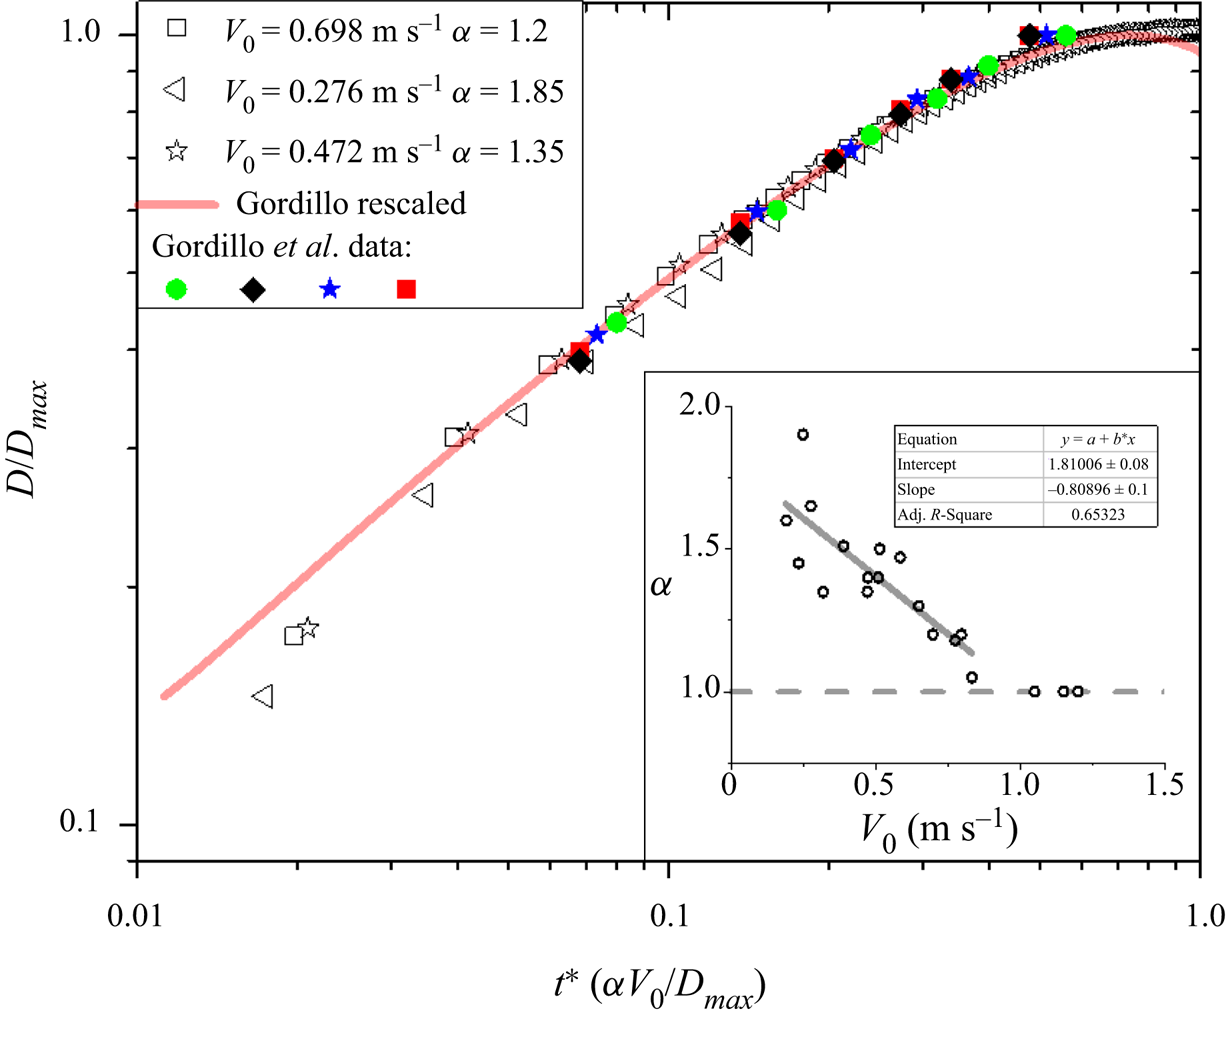
Results from this model are displayed in figure 16 both as data extracted from their results (Gordillo et al. Reference Gordillo, Riboux and Quintero2019) and as a solid line obtained by solving their model numerically using Matlab. By normalizing these results using (B1a,b) we obtain a good agreement between our experiments and the model:
 \begin{equation} t \rightarrow t'=\frac{\alpha V_{0}}{D_{max}}t,\quad D \rightarrow D'=\dfrac{D}{D_{max}}. \end{equation}
Dimensionless spreading dynamics of water droplets ( $D_0=2$ mm) impacting with different impact velocities
 $V_0$ on a glass surface at ambient temperature (empty symbols). The filled symbols show data extracted from Gordillo et al. (Reference Gordillo, Riboux and Quintero2019) for impacts at different velocities (green
 $V_0=1.59$ m s
 $^{-1}$, black
 $V_0=1.94$ m s
 $^{-1}$, blue
 $V_0=2.37$ m s
 $^{-1}$ and red
 $V_0=3.57$ m s
 $^{-1}$). The full line is a solution obtained by solving the model of Gordillo et al. (Reference Gordillo, Riboux and Quintero2019) numerically. Inset shows the correction
 $\alpha$ needed for low drop impact velocities.

The results from the model and our experimental results can be collapsed onto the same universal curve (Gorin et al. Reference Gorin, Di Mauro, Bonn and Kellay2022). As our experiments span a range of velocities going from small to high velocities, an empirical factor  $\alpha$ has been introduced (see figure 16 inset). This empirical factor turns out to depend on the impact velocity: it is near 1 for all velocities greater than roughly 1 m s
 $^{-1}$ (for water) but increases as the velocity decreases for smaller velocities. By using this empirical factor, shown in the inset of figure 16, our data can be modelled reliably. Note here that these experiments are carried out at room temperature (22
 $^\circ$C) and that it is this data and model which we use to find
 $D(t_{a})$ and, thus,
 $D_{max}$. The empirical factor
 $\alpha$, for which we do not have a simple explanation, most probably takes into account additional capillary effects at low impact velocities. This factor has been determined empirically for each liquid and substrate.