I. INTRODUCTION
The past decades have witnessed an alarming trend of decreasing fossil fuel supplies and an increase in greenhouse emissions, which imposes a pressing need for sustainable and eco-friendly energy conversion technology such as the thermoelectric (TE) energy conversion for waste heat harvesting. TEs study is a materials-oriented endeavor in which the central theme is to develop higher performance material so as to achieve higher energy-conversion efficiency. The performance of TE materials is gauged by the dimensionless figure of merit ZT = α 2σT/κ, where α is the Seebeck coefficient, σ the electrical conductivity, κ the thermal conductivity, and T the absolute temperature.Reference Tritt1, Reference Slack and Rowe2 As such a good TE material should possess large Seebeck coefficient, high electrical conductivity, and low thermal conductivity.
Half-Heusler (HH) alloys have been identified as promising TE materials for high temperature power generation. HH alloys adopt a MgAgAs-type crystal structure formed by four interpenetrating face-centered cubic sublattices, and each occupied sublattice can be substituted or doped individually to optimize certain aspects of TE properties. Therefore, HH alloys have a wide range of tunability in crystal chemistry by isoelectron, acceptor, or donor doping. In general, HH alloys with valence electron count of 18 exhibit a small bandgap and a fairly large effective mass, giving rise to large Seebeck coefficients and moderate electrical conductivities.Reference Aliev, Brandt, Moshchalkov, Kozyrkov, Skolozdra and Belogorokhov3, Reference Aliev4 It is also noteworthy that the constituent elements of these HH alloys are eco-friendly.
The improvement in TE properties of HH alloys is tied primarily to reducing the thermal conductivity that is relatively high compared with other state-of-the-art TE materials. It has been demonstrated that nanostructuring and site substitution are two effective ways to reduce the lattice thermal conductivity. The thermal conductivity reduction by nanostructuring is mainly due to the enhanced phonon scattering at the grain boundaries,Reference Chen, Huang, Zhou, Shi and Zhang5 whereas the site substitution introduces the mass fluctuation or stress field fluctuation between the impurity and host elements to increase the phonon scattering.Reference Yu, Zhu, Shi, Zhang, Zhao and He6, Reference Culp, Poon, Hickman, Tritt and Blumm7 In the past decade, MNiSn (M = Hf, Zr, Ti)-based HH alloys have been widely investigated as n-type TE materials. The state-of-the-art ZT values of these alloys are around 1.Reference Yu, Zhu, Shi, Zhang, Zhao and He6, Reference Culp, Poon, Hickman, Tritt and Blumm7 Low thermal conductivity of about 3.0 and 3.1 W m−1 K−1 have been attained at room temperature through substituting Ti for Zr or Hf sites in (Zr, Hf)NiSnReference Sakurada and Shutoh8 and Pd for Ni site in ZrNiSn-based alloys,Reference Shen, Chen, Goto, Hirai, Yang, Meisner and Uher9 respectively. Through the simultaneous substitution of Co by Ni and Sb by Sn in TiCoSb alloy, the low thermal conductivity of about 2 W m−1 K−1 was obtained at 400 K.Reference Barth, Schoop, Gloskovskii, Shkabko, Weidenkaff and Felser10 However, the best ZT values of MCoSb-based alloys are around 0.5 after the optimization of thermal and electrical transport properties by nanostructuring and site substitution methods.Reference Qiu, Huang, Chen and Chen11–Reference Xie, He, Zhu, Su, Wang, Holgate, Graff, Ponnambalam, Poon, Tang, Zhang and Tritt13
From the viewpoint of TE applications, not only good n-type materials but also comparable p-type materials with similar compositions and properties are required for the fabrication of high-performance TE modules. Kawano et al. have showed that the lanthanide-based HH compounds of LnXPn (Ln = lanthanide, X = Ni, Pd, Pn = Sb, Bi) exhibit p-type conduction characteristics.Reference Sekimoto, Kurosaki, Muta and Yamanaka14–Reference Sekimoto, Kurosaki, Muta and Yamanaka16 Through the alloying of ErNiSb and ErPdSb, the best ZT value is about 0.29 at 650 K in ErNi0.5Pd0.5Sb.Reference Kawano, Kurosaki, Muta and Yamanaka17 Kimura et al. found that the HfPtSn was intrinsically p-type conductive and the best ZT value reached about 0.3 at 1073 K after the doping of Ir and Co on Pt site.Reference Kimura and Zama18 More attempts have been done on MCoSb-based materials by p-type doping.Reference Sekimoto, Kurosaki, Muta and Yamanaka19–Reference Ponnambalam, Alboni, Edwards, Tritt, Culp and Poon21 Slade et al. obtained the best ZT value of about 0.5 at 1000 K by changing the proportion of Hf and Zr on M site and using the Sn doping on Sb site.Reference Culp, Simonson, Poon, Ponnambalam, Edwards and Tritt22 However, the value is still much lower than that of n-type HH materials. So it is significant to further improve the TE properties or develop new p-type HH alloys. Katsuyama et al.Reference Katsuyama, Matsuo and Ito23 and Hlil et al.Reference Hlil, Stadnyk, Gorelenko, Romaka, Horyn and Fruchart24 have obtained p-type ZrNiSn alloys by Y doping on Zr site. In our previous study on Y–Sb codoping in n-type Hf0.6Zr0.4NiSn based alloys, we also found that Y doping resulted in reduced carrier concentration and electrical conductivity.Reference Zhu, Xiao, Yu, Shen, Yang, Zhou, Zhao and He25 As Hf0.6Zr0.4NiSn alloy has relatively low thermal conductivity,Reference Yu, Zhu, Shi, Zhang, Zhao and He6 in this article we investigate the effect of Y single doping on the TE properties of this alloy, and the n-type to p-type conversion is observed in this alloy.
II. EXPERIMENTAL
Levitation melting (LM) was adopted at the first stage of preparation to accommodate the very different melting points and vapor pressures of the starting materials and realize the rapid fabrication of these HH alloys.Reference Yu, Zhu, Shi, Zhang, Zhao and He6, Reference Yu, Zhang, Zhu, Jiang, Xu, Zhao and Zhao26 Appropriate amounts of Hf(4N), Zr(4N), Y(3N), Ni(5N), and Sn(5N) were weighted and mixed to the compositions of (Hf0.6Zr0.4)1-xYxNiSn (x = 0, 0.01, 0.02, 0.04,0.06,0.1, and 0.2). The admixtures were melted twice to ensure homogeneity and then ball milled in the solvent of hexane for 4 h at 200 rpm. The obtained powders were dried and then densified by spark plasma sintering (SPS) (SPS-1050; Sumitomo Coal Mining Co., Tokyo, Japan) at 1173 K for 10 min under 65 MPa in vacuum. The relative densities of all the sintered pellets are about 98% of the theoretical densities.
The crystal structure of the samples after ball milling (BM) and SPS was characterized by x-ray diffraction (XRD) on a Rigaku D/MAX-2550PC diffractometer (Rigaku, Tokyo, Japan) using Cu Kα radiation (λ = 1.5406Å). The microstructure of the samples was observed on a Hitachi S-4800 field emission scanning electron microscope (Hitachi, Tokyo, Japan). The thermal conductivity of the pellets was measured using an indirect way by the equation: κ = ρ DDC p, where ρD is the density of the sample, D the thermal diffusivity, and Cp the specific heat capacity. The parameter D and C p were measured on a Netzsch LFA457 (Netzch, Selb, Germany) with a Pyroceram standard by a laser flash method.Reference Yu, Zhu, Shi, Zhang, Zhao and He6 The rectangular bars cut from the sintered pellets were used to measure the electrical conductivity and the Seebeck coefficient simultaneously by a computer-assisted device.Reference Yang, Zhu, Sun, He, Zhang and Zhao27 The measurement errors are within 5%. The Hall coefficient R H was measured on Quantum Design PPMS-9T (San Diego, CA) using a four-probe configuration with the magnetic field sweeping between ±4.0 T at 300 K. Then the carrier concentration n and Hall mobility μ H were calculated by the relations n = −(1/eR H) and μ H= σR H, respectively.
III. RESULTS AND DISCUSSION
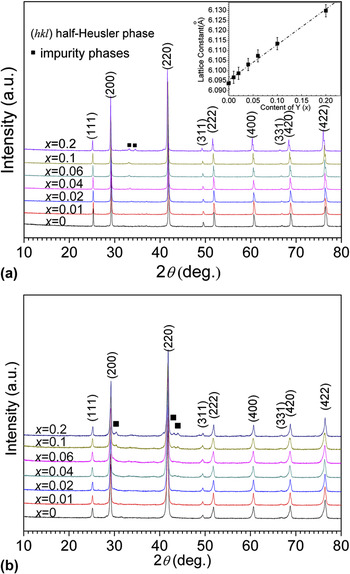
The XRD patterns of all the samples after BM and SPS are shown in Figs. 1(a) and 1(b), respectively. Almost all the diffraction peaks can be indexed to the HH structure. A trace of impurity phases (YSn3, HfO2) could be observed in Fig. 1(a). After SPS, these impurity phases almost disappeared and weak impurity phases of YSn2 and YNiSn occurred for x = 0.1 and 0.2. The calculated lattice constant shown in the inset follows a linear relation and increases with the Y ratio, consistent with the fact that ionic radius of Y is larger than that of Hf and Zr and implying that the Y dopant enters the lattice and the actual doping ratio is proportional to the nominal doping ratio in the starting materials.
X-ray diffraction patterns of the (Hf0.6Zr0.4)1-xYxNiSn (x = 0, 0.01, 0.02, 0.04, 0.06, 0.1, and 0.2) samples after (a) ball milling and (b) SPS. Almost all the diffraction peaks can be indexed to a half-Heusler structure except small amounts of impurity phases. The calculated lattice constants are showed in the inset of (a) as a function of nominal Y-doping ratio.

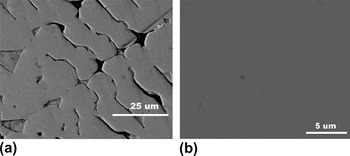
Figures 2(a) and 2(b) are the typical microstructures of the levitation melted ingot and the SPSed sample for (Hf0.6Zr0.4)0.9Y0.1NiSn, respectively. Other samples have similar microstructures. The secondary electron image in Fig. 2(a) shows the presence of solidification defects, which will influence the reliability and reproducibility of TE property measurements. The backscattering electron image of Fig. 2(b) indicates that after SPS the sample was compact and had a homogeneous composition distribution, although a small amount of impurity phases could be occasionally observed.
(a) Secondary electron image of levitation melted sample and (b) backscattering electron image of spark plasma sintered sample with x = 0.1.

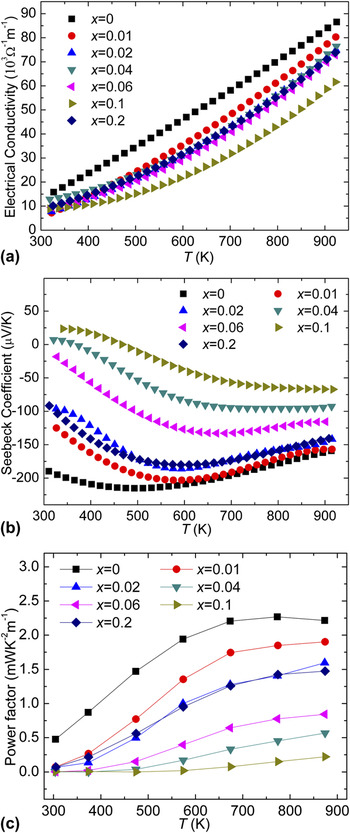
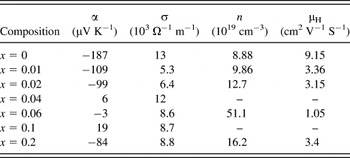
The electrical properties for (Hf0.6Zr0.4)1-xYxNiSn with various Y-doping ratios are shown as a function of temperature in Figs. 3(a)–3(c). The electrical conductivity increased with increasing temperature, showing a typical semiconductor conduction behavior. Hopping conduction is also a possible mechanism for the increase in electrical conductivity. However, the mechanism was ruled out because it cannot explain why the Y-doped samples had lower electrical conductivity compared with the parent compound without Y doping, as shown in Fig. 3(a). The room temperature values of electrical conductivity of all the samples are below 2 × 10⁴ Ω−1 m−1, which is much smaller than that of the Sb-doped n-type samples.Reference Yu, Zhu, Shi, Zhang, Zhao and He6, Reference Culp, Poon, Hickman, Tritt and Blumm7 Hall measurement shows that the carrier concentration of the samples basically increases with the Y-doping ratio except x = 0.2 (Table I). Figure 3(b) reveals that the samples have negative Seebeck coefficient and the room temperature absolute values decrease with increasing Y content, when x < 0.04. The sample without Y doping is n-type conductive. Y doping introduces hole carriers to the matrix since the Y is p-type dopant, and hence reduces the Seebeck coefficient. For x = 0.04 and 0.1, the room temperature Seebeck coefficient of the samples turned to be positive, which were 6 and 19 μV K−1 respectively, implying that hole carriers are dominant for more Y doping in these alloys. For x = 0.06, the room temperature Seebeck coefficient was only −3 μV K−1, close to the n-type to p-type transition considering the measurement error and composition fluctuation. However, as temperature increases, the Seebeck coefficient turns to be negative again for x = 0.04 and 0.1. The sample with x = 0.2 had negative room-temperature Seebeck coefficient, possibly due to the presence of more impurity phases (both YSn2 and YNiSn are the metallic phases). The temperature dependence of Seebeck coefficient exhibits a downward curvature in all samples. The temperature that the maximum Seebeck coefficient occurs increases with increasing Y content. Concerning the power factor, Fig. 3(c) shows all the doped samples have lower power factor values compared with the parent compound without Y doping.
Temperature dependence of (a) electrical conductivity, (b) and Seebeck coefficient, and (c) power factor of (Hf0.6Zr0.4)1-xYxNiSn (x = 0, 0.01, 0.02, 0.04, 0.06, 0.1, and 0.2) compounds.

Room-temperature electrical properties of some samples.

α, Seebeck coefficient; σ, electrical conductivity; n, carrier concentration; μ H, Hall mobility.
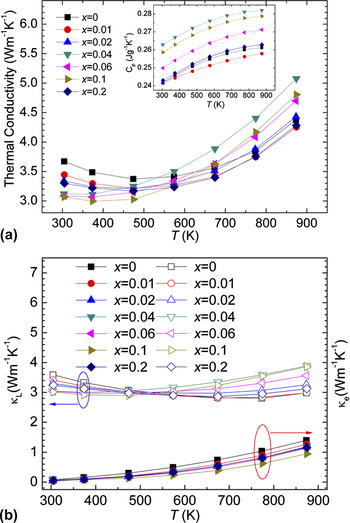
Figure 4 shows the temperature dependence of thermal conductivity, including carrier thermal conductivity κ e and lattice thermal conductivity κ L. The temperature dependence of specific heat, C p, is also shown in the inset of Fig. 4(a). The values are in good agreement with our previous results.Reference Zhu, Xiao, Yu, Shen, Yang, Zhou, Zhao and He25 The carrier thermal conductivity is calculated using the Wiedemann–Franz relationship, κ e = LσT with the Lorentz number L = 2.0 × 10⁻⁸ V2 K−2. The lattice thermal conductivity is obtained by subtracting the carrier thermal conductivity from the total thermal conductivity. Figure 4(b) shows that the carrier thermal conductivity is quite small because of the low electrical conductivity of these samples and the lattice thermal conductivity is dominant in the total thermal conductivity. The room temperature lattice thermal conductivity slightly decreases with increasing Y content, suggesting weak alloying effect on thermal conductivity due to a small amount of Y dopant.
Temperature dependences of (a) the thermal conductivity and (b) the electrical thermal conductivity and lattice thermal conductivity of (Hf0.6Zr0.4)1-xYxNiSn (x = 0, 0.01, 0.02, 0.04, 0.06, 0.1, and 0.2) compounds.

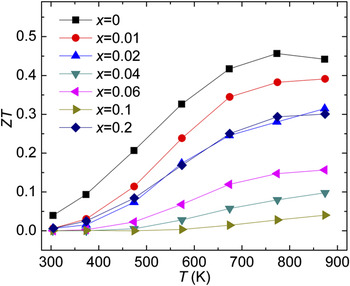
The temperature dependence of ZT is shown in Fig. 5. The ZT increases with increasing temperature and all the Y-doped samples have lower ZT values compared with the parent compound without Y doping. The maximum ZT value is about 0.45 at 780 K for the undoped sample. More attempts should be taken on (Hf,Zr)NiSn alloys to obtain p-type conduction over the measured temperature range.
Temperature dependence of figure of merit value of (Hf0.6Zr0.4)1-xYxNiSn (x = 0, 0.01, 0.02, 0.04, 0.06, 0.1, and 0.2) compounds.

IV. CONCLUSIONS
In this work, we performed Y doping in (Hf0.6Zr0.4)1-xYxNiSn (x = 0, 0.01, 0.02, 0.04, 0.06, 0.1, and 0.2) alloys using LM followed by spark plasma sintering. The sign of room-temperature Seebeck coefficient of the alloys turned from n-type to p-type for x = 0.04 and 0.1. Although the Y doping introduced hole carriers to the n-type matrix, the measured carrier concentration increased with Y content. The Y-doping decreased the electrical conductivity and the absolute Seebeck coefficient and had weak effect on the thermal conductivity. P-type conduction in Hf0.6Zr0.4NiSn alloys is possible by Y doping if the impurity phases could be effectively avoided.
ACKNOWLEDGMENTS
This work is financially supported by the Natural Science Foundation of China (50731006, 51061120455, and 50971115) and the National Basic Research Program of China (2007CB607502).