I. INTRODUCTION
The demand for new thermoelectric materials for energy conversion applications has been growing over recent years. Compounds with low-dimensional layered structures have attracted increasing interest in thermoelectric research because of their high-power factor, P, where P = S 2 σ (S = Seebeck coefficient and σ = electrical conductivity). The efficiency of thermoelectric energy conversion is related to the dimensionless figure of merit (ZT) of a thermoelectric material, given by ZT = S 2 σT/k, where T is the absolute temperature, and k is thermal conductivity (Tritt and Subramanian, Reference Tritt and Subramanian2006). The search for high-efficiency materials (high ZT) for waste heat conversion and refrigeration applications continues to be a high-priority activity in the energy R&D community.
To improve thermoelectric properties, various strategies have been pursued, including lowering of thermal conductivity. “Natural superlattice” materials, in which layers with excellent electronic transport properties are combined with a second type of layer, which serves as a phonon scatterer, in general exhibit low thermal conductivities (Luu and Vaquelro, Reference Luu and Vaquelro2013). “Natural superlattice” oxides that have been studied extensively include NaCo2O4 (Terasaki et al., Reference Terasaki, Sasago and Uchinokura1997), Ca3Co4O9 (Masset et al., Reference Masset, Michel, Maignan, Hervieu, Toulemonde, Studer and Raveau2000; Mikami et al., Reference Mikami, Itaka, Kawaji, Wang, Koinuma and Lippmaa2002; Grebille et al., Reference Grebille, Lambert, Bourée and Petricek2004; Wong-Ng et al., Reference Wong-Ng, Hu, Vaudin, He, Otani, Lowhorn and Li2007, Reference Wong-Ng, Liu, Martin, Thomas, Lowhorn and Otani2010; Otani et al., Reference Otani, Lowhorn, Schenck, Wong-Ng and Green2007), and Bi2Sr2Co2O x (Wang et al., Reference Wang, Venimadhav, Guo, Chen, Li, Soukiassian, Schlom, Pan, Wong-Ng, Vaudin, Cahill and Xi2009).
Quaternary oxychalcogenides MBOCh [M = lanthanide (La) and Bi; B = Cu and Ag; Ch = S, Se, and Te (Palazzi, Reference Palazzi1981; Kusainova et al., Reference Kusainova, Berdonosov, Akselrud, Kholodkovskaya, Dolgikh and Popovkin1994; Zhu et al., Reference Zhu, Huang, Dong and Zhao1994; Popovkin et al., Reference Popovkin, Kusainova, Dolgikh and Aksel'rud1998; Charkin et al., Reference Charkin, Akopyan and Dolgikh1999; Takase et al., Reference Takase, Sato, Shoji, Takahashi, Takano, Sekizawa, Kuroiwa and Goto2007; Hiramatsu et al., Reference Hiramatsu, Yanagi, Kamiya, Ueda, Hirano and Hosono2008; Richard et al., Reference Richard, Russell, Zaktuayev, Zakharov, Keszler and Tate2012)] are known to adopt the layered type crystal structure of the LaOCuS and LaOAgS types (Palazzi et al., Reference Palazzi, Carcaly and Flahaut1980; Palazzi, Reference Palazzi1981; Palazzi and Jaulmes, Reference Palazzi and Jaulmes1981), and can also be considered as “natural superlattice” materials. The interest in the Bi analogs of the LaCuOCh system is partly because of the electronic configuration of Bi (Richard et al., Reference Richard, Russell, Zaktuayev, Zakharov, Keszler and Tate2012). On the basis of the electronic structures obtained by photoelectron spectroscopy and density functional theory calculations, the BiCuOCh phases have been found by Hiramatsu et al. (Reference Hiramatsu, Yanagi, Kamiya, Ueda, Hirano and Hosono2008) to have small band gaps, because of the contribution of the Bi 6p orbitals to the conduction band minima. Richard et al. (Reference Richard, Russell, Zaktuayev, Zakharov, Keszler and Tate2012) obtained the band gap value of BiCuOSe single crystals (0.82 eV) from infrared transmission measurements. Many of the La oxychalcogenides are, however, wide band gap (≥3 eV) transparent semiconductors (Ueda et al., Reference Ueda, Inoue, Hirose, Kawazoe and Hosono2000, Reference Ueda, Takafuji, Hiramatsu, Ohta, Kamiya, Hirano and Hosono2003; Ueda and Hosono, Reference Ueda and Hosono2002), which possess interesting optical properties (Hiramatsu et al., Reference Hiramatsu, Yanagi, Kamiya, Ueda, Hirano and Hosono2008).
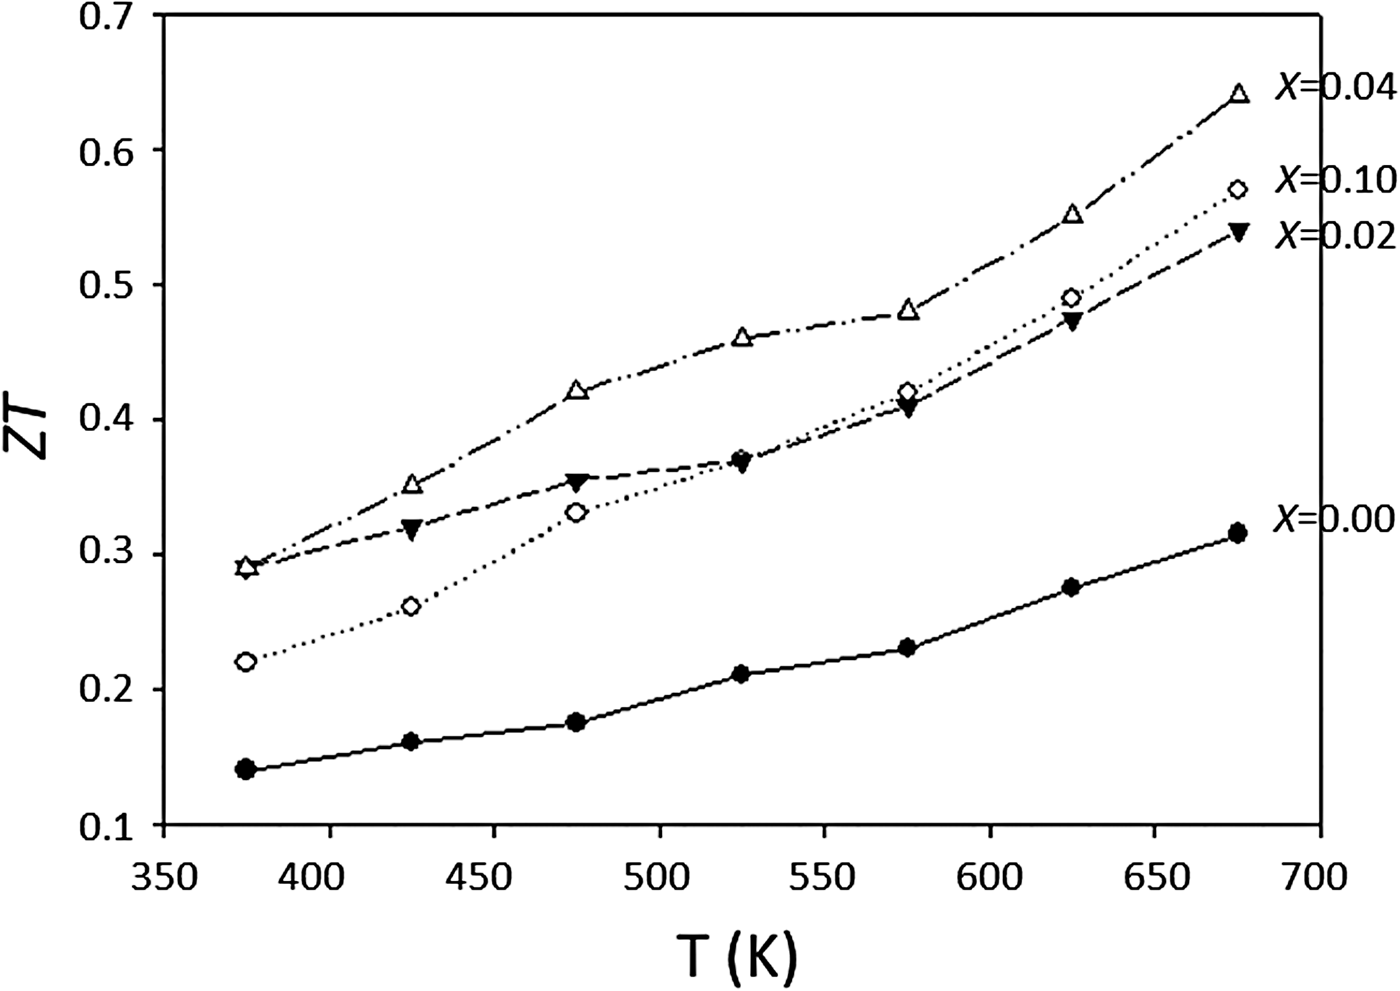
According to Luu and Vaqueiro (Reference Luu and Vaquelro2013), the effect of increasing dopant of Pb2+ on the Bi site of the Pb-doped Bi1−x Pb x OCuSe series is the reduction of the band gap size, leading to a systematic decrease of electrical resistivity. For this family of oxychalcogenides, p-type conduction is often observed, and is attributed to the formation of a covalent hybridized band between Cu and Se atoms at the top of the valence band. Another source of the p-type behavior could be related to copper deficiency, which can generate mobile holes. Figure 1 shows the ZT as a function of x in Bi1−x Pb x OCuSe. It is observed that ZT at 673 K is enhanced by ≈50% (Luu and Vaqueiro, Reference Luu and Vaquelro2013).
Figure of merit, ZT of Bi1−x Pb x OCuSe as a function of temperature (Luu and Vaquelro, Reference Luu and Vaquelro2013).

There are two goals for this study. First, Bi1−x Pb x OCuSe (x = 0, 0.02, 0.04, 0.06, 0.08, and 0.1) compounds are investigated for the effect of Pb substitution in the Bi site on the resulting structure. Since X-ray diffraction (XRD) is a non-destructive technique for phase identification, XRD patterns are especially important for phase characterization; therefore, the second goal of this investigation was to determine the experimental patterns for Bi1−x Pb x OCuSe (x = 0, 0.02, 0.04, 0.06, 0.08, and 0.1), and to make them widely available through submission to the Powder Diffraction File (PDF) (2016). The pattern of BiOCuSe has been reported in PDF 46–296 by Antipov and D'yachenko (Reference Antipov and D'yachenko1993).
II. EXPERIMENTAL
A. Sample preparation
Samples were prepared by the self-propagating high-temperature synthesis (SHS) technique (Su et al., Reference Su, Fu, Yan, Zheng, Liang, Cheng, Yang, Chi, Tang, Zhang and Uher2014). High-purity powders of elemental Bi, Cu, and Se were blended in a mortar and pestle, and pelletized under ≈100 MPa. The pellets were ignited using an electric heater, and the product was obtained in under 1 min. The powder was obtained by grinding the reacted pellets.
B. X-ray Rietveld refinements and powder reference patterns
(The purpose of identifying the equipment in this paper is to specify the experimental procedure. Such identification does not imply recommendation or endorsement by the National Institute of Standards and Technology.)
The Bi1−x Pb x OCuSe (x = 0, 0.02, 0.04, 0.06, 0.08, and 0.10) compounds were mounted on a zero-background cell. The X-ray powder patterns were measured on a Bruker D2 Phaser diffractometer (30 kV, 10 mA, 5°–130° 2θ in 0.020 2144° steps, 0.5 s step−1) equipped with a LynxEye position-sensitive detector. For all samples, the lower window of the detector electronics was increased from its default value of 0.11–0.19 V to minimize the effects of fluorescence.
The Rietveld refinement technique (Rietveld, Reference Rietveld1969) with software suite GSAS (Larson and von Dreele, Reference Larson and von Dreele2004) was used to determine the structure of Bi1−x Pb x OCuSe. The structure of BiOCuSe (Richard et al., Reference Richard, Russell, Zaktuayev, Zakharov, Keszler and Tate2012) reported previously was used as the starting model for the refinements. The site occupancies of Bi/Pb as prepared were used in Bi1−x Pb x OCuSe. The pseudo-Voigt function (profile function #2) was used for the refinements (Howard, Reference Howard1982; Thompson et al., Reference Thompson, Cox and Hastings1987). Background function #1 (shifted Chebyshev function with six terms) in combination with the CW X-ray profile (functions #2) were used for the refinements. Profile coefficients LX, ptec, and shft were refined. Peak tails are ignored where the intensity is below 0.005 times the peak.
Reference patterns were obtained with a Rietveld pattern decomposition technique. Using this technique, the reported peak positions were derived from the extracted integrated intensities, and positions calculated from the lattice parameters. When peaks are not resolved at the resolution function, the intensities are summed, and an intensity-weighted d-spacing is reported.
III. RESULTS AND DISCUSSION
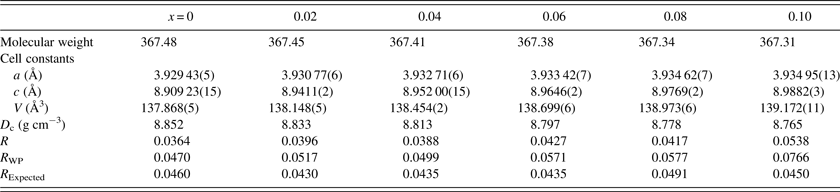
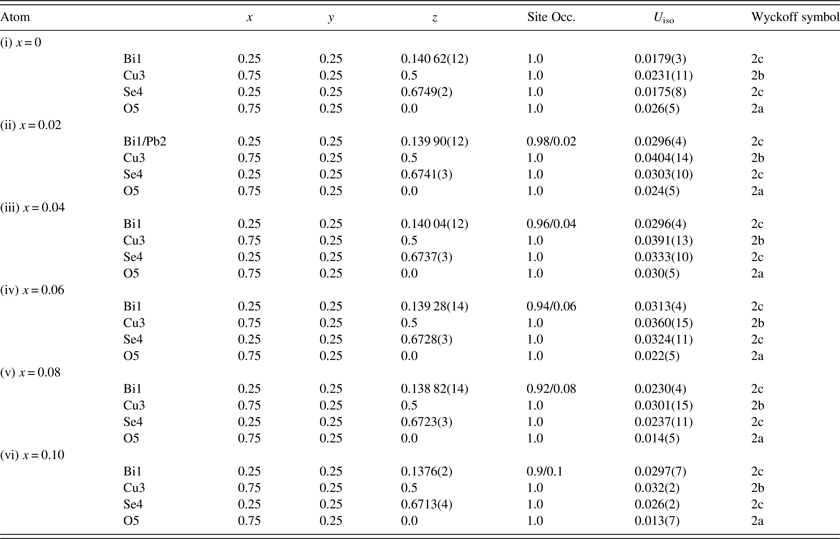
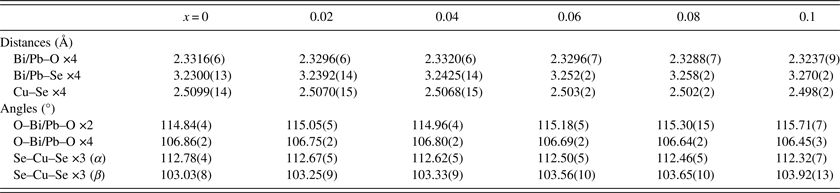
Table I provides the crystallographic data for Bi1−x Pb x OCuSe (x = 0, 0.02, 0.04, 0.06, 0.08, and 0.1) which include cell parameters, Z values, and calculated density, and refinement results, respectively. Table II gives the pertinent atomic coordinates and displacement parameters. Table III summarizes the bond distances and angles. The Bi1−x Pb x OCuSe compounds are tetragonal with space group P4/nmm (129), Z = 2. Our data agreed with that given by Luu and Vaqueiro (Reference Luu and Vaquelro2013).
Crystal data for Bi1−x Pb x OCuSe (x = 0, 0.02, 0.04, 0.06, 0.08, and 0.1).

Crystal system tetragonal P4/nmm (no. 129), Z = 2, T = 298 K, radiation CuKα. Values inside the brackets represent standard deviations (SD).
Positional (x, y, z) and displacement parameters for Bi1−x Pb x OCuSe (x = 0, 0.02, 0.04, 0.06, 0.08, and 0.1).

Crystal system tetragonal P4/nmm (no. 129), Z = 2, T = 298 K, radiation CuKα. The values inside the brackets refer to SD.
Selected bond distances and angles for Bi1−x Pb x OCuSe (x = 0, 0.02, 0.04, 0.06, 0.08, and 0.10).

The values inside the brackets refer to SD.
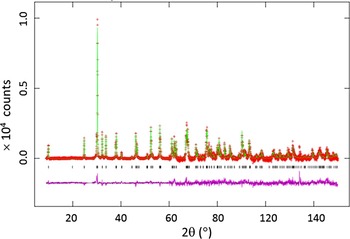
Figure 2 shows the XRD pattern of the Bi1−x Pb x OCuSe (x = 0.6) powder and the results of the Rietveld analysis. The observed (crosses), calculated (solid line), and difference XRD patterns (bottom), are shown. The difference pattern is plotted at the same scale as the other patterns up to 60°2θ. At higher angles, the scale has been magnified five times. The results indicate that the sample is a single phase.
(Colour online) Rietveld pattern for Bi1−x Pb x OCuSe (x = 0.06). The observed (crosses), calculated (solid line), and difference XRD patterns (bottom), are shown. The difference pattern is plotted at the same scale as the other patterns up to 60°2θ. At higher angles, the scale has been magnified five times.

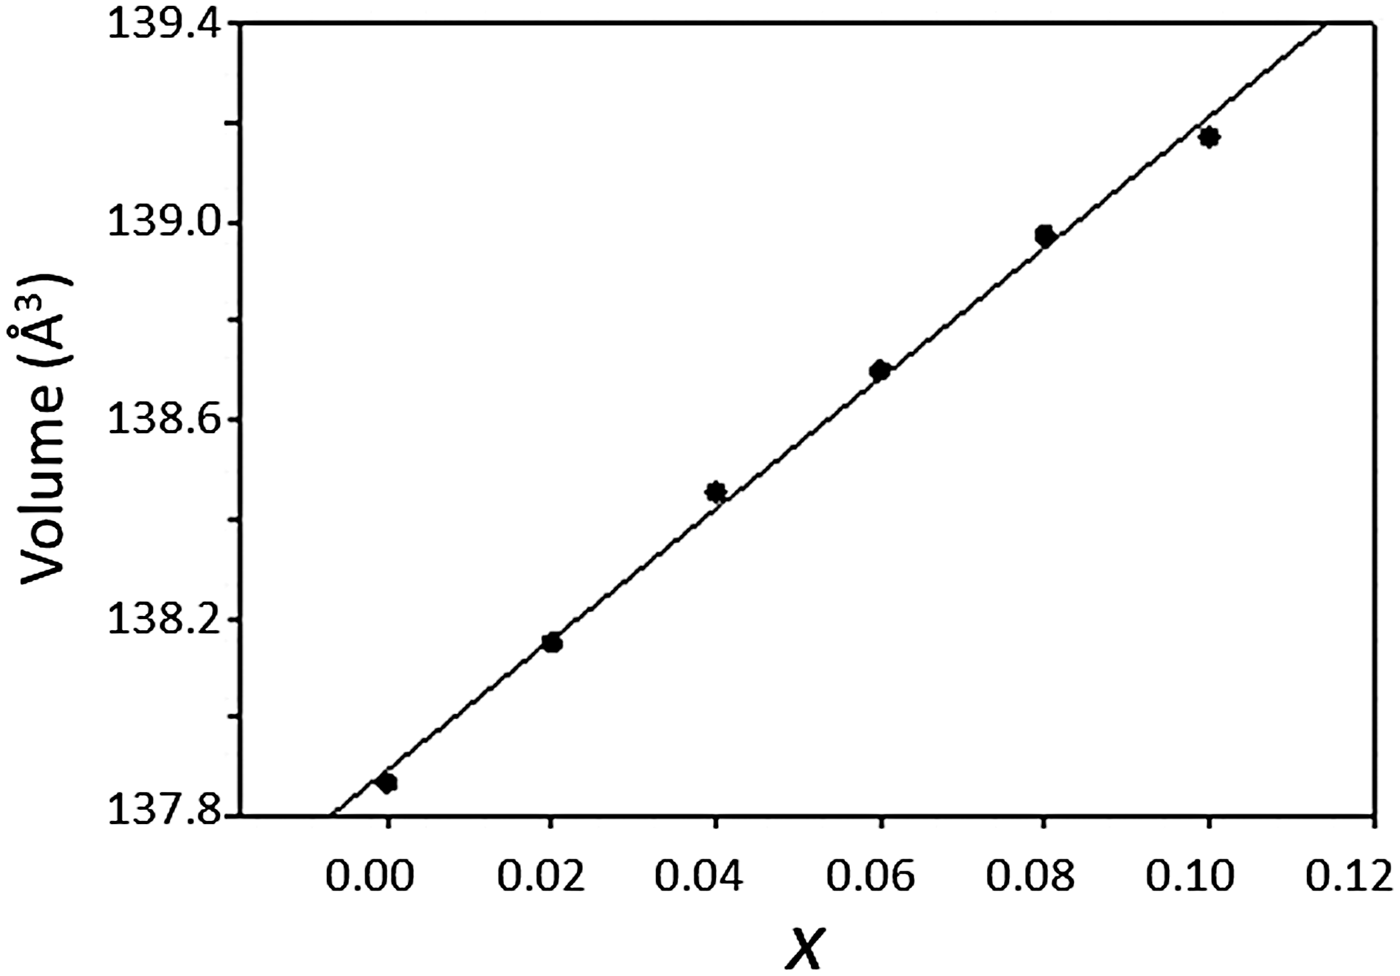
As the ionic radius of Pb2+ (1.29 Å) is greater than that of Bi3+ (1.17 Å) (Shannon, Reference Shannon1976), a monotonically increasing trend of unit-cell volume as a function of x of Bi1−x Pb x OCuSe is evidenced in Figure 3 [from 137.868(3) to 139.772(11) Å3 for x = 0 to 0.1, respectively]. This increase is more noticeable along the c-axis (Table I).
Plot of unit-cell volume, V, of Bi1−x Pb x OCuSe as a function of x. A monotonic trend of increase of V as a function of x is observed.

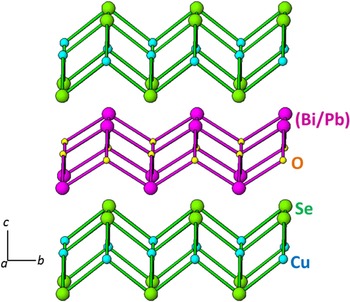
Figure 4 gives the crystal structure of Bi1−x Pb x OCuSe along the [010] direction. The structure of Bi1−x Pb x OCuSe is built from [Bi2(1−x)Pb2x O2]2(1−x)+ layers normal to the c-axis alternating with [Cu2Se2]2(1−x)− fluorite-like layers. The [(Bi/Pb)2O2] layers are built of slightly distorted (Bi/Pb)4O tetrahedra that share (Bi/Pb)–(Bi/Pb) edges. The two different (Bi/Pb)–O–(Bi/Pb) bond angles (three of each type) are shown in Table III. The effect of Pb doping on the Bi site of the BiOCuCh structure is the increasing separation of the [Bi2(1−x)Pb2x O2]2(1−x)+ and the [Cu2Se2]2(1−x)− layers, therefore weakening the bonding between them, as evidenced from the progressively increasing of the c-parameter. Therefore the electrical resistivity and Seebeck coefficient of Bi1−x Pb x OCuSe decrease systematically with increasing Pb2+ levels (Luu and Vaqueiro, Reference Luu and Vaquelro2013).
(Colour online) View of the crystal structure of Bi1−x Pb x OCuSe along the [010] direction. The structure of Bi1−x Pb x OCuSe consists of alternating [Bi2(1−x)Pb2x O2]2(1−x)+ and [Cu2Se2]2(1−x) − layers.

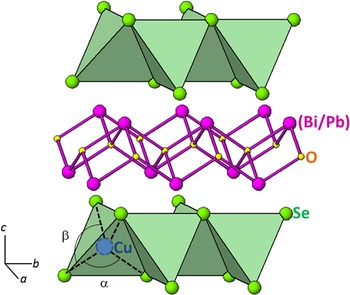
The Cu1+ cation site has a D 2d symmetry, with Cu coordinated by Se2− anions forming distorted CuSe4 tetrahedra. The two tetrahedral angles α and β are shown in Figure 5. Comparing to an ideal tetrahedron, the tetrahedra are compressed in the ab-plane and elongated along the c-axis (increase of the β angle and decrease of the α angle). In the [Cu2Se2] layers, the distorted CuSe4 tetrahedra share Se–Se edges forming [Cu2Se2] layers. The Se–Cu–Se angles are given in Table III. With increasing Pb content, there is a reduction of the distortion of the CuSe4 tetrahedra.
(Colour online) The CuSe4 polyhedra in Bi1−x Pb x OCuSe are shown. Selected bond angles α and β in Bi1−x Pb x OCuSe are indicated.

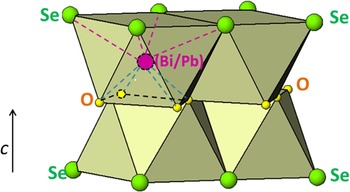
The coordination of (Bi/Pb) is a distorted square antiprism with four O in one base and four Se in the other, typical of Sillen phases (Dolgikh and Kholodkovskaya, Reference Dolgikh and Kholodkovskaya1992) (Figure 6). The (Bi/Pb)–O distances ranging from 2.3316(6) to 2.3237(9) Å in Bi1−x Pb x OCuSe (from x = 0 to 0.1, respectively). These bond distances are not significantly different from the Bi–O distance found in Bi2O2Se (2.32 Å) (Boller, Reference Boller1973).
(Colour online) A distorted square antiprism around the central (Bi/Pb) in Bi1−x Pb x OCuSe is shown.

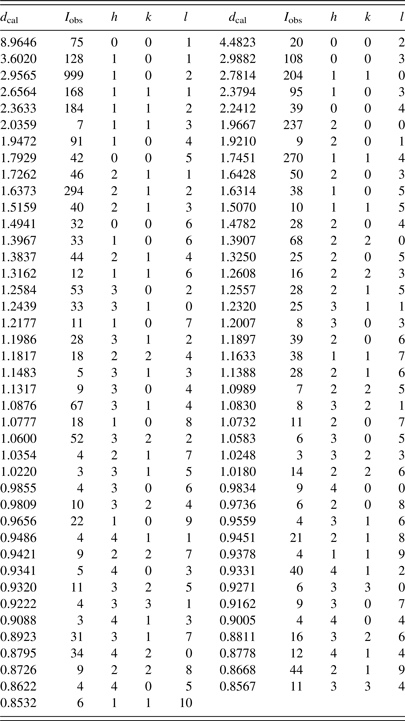
An example of the reference patterns, Bi1−x Pb x OCuSe (x = 0.6), is given in Table IV. In this pattern, the strongest peak in the pattern is assigned an intensity of 999 and other lines are scaled relative to this value. The d-spacing values are calculated values from refined lattice parameters. The intensity values reported are integrated intensities (rather than peak heights) calculated from corresponding profile parameters. For peaks containing more than one reflection that can still be resolved, intensity-weighted calculated d-spacing, along with the observed integrated intensity and the hkl indices of both peaks (for “M”), or the hkl indices of the strongest peak (for “+”) are used. For peaks that are not resolved within the instrumental resolution, the intensity-weighted average d-spacing and the summed integrated intensity value are used. In the case of a cluster, unconstrained profile fits often reveal the presence of multiple peaks, even when they are closer than the instrumental resolution. In this situation, both d-spacing and intensity values are reported independently. All patterns have been submitted for inclusion in the Powder Diffraction File (PDF).
X-ray powder pattern for Bi1−x Pb x OCuSe (x = 0.06).

Crystal system tetragonal P4/nmm (no. 129), Z = 2, T = 298 K, radiation CuKα. a = 3.933 42(7), c = 8.9646(2), and V = 138.699(6) Å3. The particular peak that has the strongest intensity in the entire pattern is assigned an intensity of 999 and other lines are scaled relative to this value. The d-spacing values are calculated values from refined lattice parameters, and “I” represents integrated intensity values.
IV. SUMMARY
The crystal structure of the Bi1−x Pb x OCuSe series of compounds (x = 0, 0.02, 0.04, 0.06, 0.08, and 0.1) have been determined. The effect of Pb substitution in the Bi site has been found to lengthen the c-axis, causing a greater separation of the [Bi2(1−x)Pb2x O2]2(1−x)+ and the [Cu2Se2]2(1−x) − layers, and the CuSe4 tetrahedra to be elongated along the c-axis, therefore systematically decreasing the electrical resistivity and Seebeck coefficient. Powder XRD patterns for these compounds have been submitted for inclusion in the PDF.
ACKNOWLEDGEMENTS
Partial financial support from ICDD is acknowledged.