


I. INTRODUCTION
Since the discovery of carbon nanotubes (CNTs) [Reference Iijima1], the material has been investigated in many applications (e.g. [Reference Dresselhaus, Dresselhaus and Avouris2–Reference Zhu7]). There are efforts to characterize all the properties of CNTs, which is a necessary step for exploring new potential applications. For example, chemical properties are investigated in [Reference Niyogi8–Reference Itkis10]. The variation of dc conductivity of thin films of CNTs is presented in [Reference Bekyarova11] as a function of film thickness and temperature. Kilbride et al. [Reference Kilbride12] measured the frequency-dependent conductivity of polymer-multi-walled-carbon nanotubes (MWCNTs) (MWCNT is a structure that consists of several sheets of graphite that have been rolled up into concentric tubes nested inside each one other.) composite thin films in the frequency range 10 Hz–1 MHz using impedance analyzer, and the dc conductivity using a source meter. In [Reference Xu, Anlage, Hu and Gruner13, Reference Xu, Zhang and Anlage14], the frequency-dependent conductivity of single-walled carbon nanotubes (SWCNTs) thin films is measured up to 30 GHz. The frequency-dependent conductivity is extracted from the measurements of reflection coefficient. There are also theoretical studies about the modeling and prediction of CNTs properties. For example, in [Reference Burke15], Burke developed a radio-frequency (RF) circuit model for a single CNT transmission line placed parallel to a ground plane. Hanson [Reference Hanson16] developed a model for a single CNT working as a dipole transmitting antenna. However, the theoretical models were developed for a SWCNT. It is to be noted that the CNTs as initially produced are a mixture of both metallic and semiconducting nanotubes.
From literature overview about nanotechnology, the properties of CNTs may be categorized into physical and electrical. First, the physical properties are obtained through measurements and testing. Then, the electrical properties follow the physical properties. This paper studies the physical and the electrical characterizations of CNT networks in the RF/microwave frequency range.
The first step toward understanding and developing new CNT-based RF/microwave devices is the characterization of complex permittivity and electrical properties for the material under test (MUT). To achieve that goal, different lengths of the same planar transmission line structures are fabricated. In each transmission line, the metallic traces are replaced by CNT networks. For proof of concept, the CNT networks used in this work are in dry-powder form. The objectives of this paper are as follows: (1) developing a systematic microwave-based measurement procedure for the extraction of the equivalent circuit elements and the complex permittivity of CNTs when they are used to build a transmission line; (2) computing the fundamental parameters of the constructed transmission lines such as inductance, capacitance, resistance, phase velocity, and complex dielectric constant; and (3) demonstrating the possibility of implementing CNTs in microwave circuits. To fulfill these objectives, the measurements are repeated N times for every fabricated transmission line. Each measurement corresponds to a different bulk density of CNTs. The results are averaged and smoothed leading to minimized measurements errors and giving the most accurate values. It is noted here that preliminary results of this work are reported in [Reference EL Sabbagh, El-Ghazaly and Naseem17]. However, this work is a major expansion where it studies the repeatability of measurements and the effects of varying the density of CNT networks as well as the effect of their randomly oriented nature on measured scattering parameters and extracted electrical properties. Physical interpretations and discussions are included to enhance the understanding about the electrical properties of CNT networks and their potential usage in the design of RF circuits. The theoretical model of transmission line and extraction of its electrical parameters is included. Also, characterization of CNT networks using scanning electron microscopy and transmission electron microscopy (TEM) are presented for more insight and visualization of CNTs nanotubes used in this experiment. Based on the results reported in this paper, an independent work to design a miniaturized-RF resonator is developed to validate the high values of relative complex permittivity obtained at low frequencies as presented in this paper. The results and performance of the prototype of a miniaturized-RF resonator fabricated using the same CNT networks utilized in this research work are presented in [Reference EL Sabbagh and El-Ghazaly18] and validates results reported herein.
The paper organization is as follows. The theoretical modeling, equivalent circuit-based, of a transmission line is introduced in Section II. Experimental setup and realization are presented in Section III. Experimentally measured results are discussed in Section IV. The effect of bulk density of CNTs on measured and extracted parameters is explained in Section V. Section VI summarizes the potential of CNTs in planar transmission lines. Finally, conclusions are drawn in Section VII.
II. THEORETICAL MODELING
As described in the introduction, several transmission lines are fabricated where the regular metallic traces are replaced by a continuum of CNT networks. Before introducing experimental setup, measurements, and extracted parameters, basic equations required to extract the parameters of the equivalent circuit per unit length shown in Fig. 1 are presented in this section. In that model, L, C, R, and G are the total inductance, capacitance, resistance, and conductance per unitlength of the transmission line, respectively. The extraction of these parameters requires four equations. The measured complex propagation constant and characteristic impedance of the transmission line are related to these parameters as [Reference Harrington19]:


Equivalent circuit model per unit length of a transmission line.

Equating the real and the imaginary parts of (1) and (2) gives four equations. However, the obtained equations are not linear functions of the transmission line parameters. Thus, it is difficult to obtain explicit expressions in terms of γ and Z c. There are several scenarios as indicated in [Reference Harrington19, Reference Cheng20] where it is possible to obtain simplified and explicit relations between attenuation and phase constant and those equivalent circuit parameters shown in Fig. 1. In this work, the conductance per unit length G is neglected. This is justified since G represents the losses in dielectric substrate. The microwave substrates used in this research have very small loss tangent. This simplification results in the explicit expressions of equivalent circuit elements in terms of measurable parameters. With that approximation, the expression for complex propagation constant becomes

and the complex characteristic impedance is given by

where α, β, Z cr, and Z ci are the attenuation constant in Neper/m, phase constant in rad/m, real, and imaginary parts of the characteristic impedance in Ω, respectively. Based on the formula of scattering matrix given in [Reference EL Sabbagh, Kermani and Ramahi21], the complex characteristic impedance and propagation constant are obtained from measured scattering parameters using the following relations:

where Z sys is the measuring system impedance, normally equal to 50Ω:

Simple algebraic manipulations of (5) and (6) gives expressions for attenuation and phase constants per unit length in terms of measured scattering parameters as follows:


Inductance, capacitance, and resistance per unit length are obtained from complex propagation constant and characteristic impedance as:


The phase velocity and real part of the effective complex permittivity are computed from the inductance and capacitance per unit length using the relations:

The imaginary part of the effective complex permittivity is related to the attenuation and phase constants as follows:

In the above equations, μ0 and ɛ 0 are the permeability and the permittivity of free space, respectively.
III. EXPERIMENTAL SETUP AND REALIZATION
A sketch of the proposed transmission line structure used to test the CNTs is shown in Fig. 2. It consists of two substrates cut with identical length l, width S, and height h. The bottom substrate shown in Fig. 2(b) has a longitudinal groove machined using a dicing saw. The depth g and width W of groove are designed such that g < < W, g < < h, and W < < S. Hence, the volume of the groove is very small compared to that of its hosting substrate. The top substrate, shown in Fig. 2(a), is not subject to any machining and does not have any groove. It is used as the top cover. In this scenario, the groove is located only in the bottom substrate and it is asymmetric with respect to the whole structure of top and bottom substrate. Figure 2(c) shows the CNTs filling the groove and covering the inner conductors of SMA connectors to assure good contact between CNTs and connectors at the input and output ports.
Configuration of the proposed transmission line structure: (a) top substrate, (b) bottom substrate, and (c) top view of bottom substrate showing CNTs inserted in the groove between SMA connectors at input and output. Dimensions are not to scale. Figure 3 gives picture of actual fabricated transmission lines.

The dielectric substrate used to hold the CNTs is alumina 96% with thickness 1.016 mm(40 mil). Several samples of transmission lines are fabricated. Their common features are as follows: the substrate width S = 31.25 mm, groove depth g = 0.2 mm, and groove width W = 1.45 mm. It is noted that the width and depth of groove are chosen initially to give a 50-Ω characteristic impedance to reduce the reflections at input and output of the test structure when connected to a 50-Ω measurement system. Also, they are chosen wide enough to allow CNT networks to be easily inserted inside the groove. The samples have different length, l ∈ {2 cm, 3 cm, 4 cm, 5 cm}. All outer surfaces, except the location of input and output of the transmission line, are shielded and continuously grounded with copper tape as shown in Fig. 3. The outer body of SMA connector is soldered to the ground plane on theother side of structure which is not shown in Fig. 3. As will be explained later, this structure operates as asymmetric stripline waveguide or in another words it is considered as coaxial structure with rectangular cross section where the inner core is not vertically centered.
Configuration of the actual manufactured transmission line structure. The units of the background ruler are in inch.

The CNTs under test are in dry-powder form as obtained from BuckyUSA (Nanotex Corporation). The product number is BU-203. According to the supplier's data sheet, it is described as cleaned single-wall nanotubes with purity >90 wt%, ash <1.5 wt%, diameter 1–2 nm, and length 5–30 µm. The CNTs are used as provided from the supplier. A transmission electron microscopy is done in-house to enhance the understanding about the CNTs. The transmission electron microscopy experiments are conducted on a Titan-S/transmission electron microscopy equipped with a field emission gun operating at 300 kV and an image corrector. Figure 4 is a low-magnification image taken withoutany objective aperture showing the general aspect of the as-provided material (clustered networks of CNTs). The material mainly consists of bundles of SWCNT, MWCNT, and graphite sheets as shown in Fig. 5. By taking several images at other locations within the sample, it is found that the diameter of the innermost tube for many of the MWCNTs varies from 2 to 8 nm. It is to be noted that the diameter of MWCNTs could range from 6 to 100 nm [Reference O'Connell22]. The CNTs are mechanically packed inside the groove. The mechanism of filling the groove consists of picking the CNTs from their container then inserting them gently inside the groove using tweezers. No further process is necessary. The CNTs adhere efficiently to the surfaces of the groove due to Van Der Waal forces. To ensure the existence of a continuum of CNT networks in the groove, the dc resistance between the input and output SMA connectors is always measured. The average measured dc resistances are 1.77, 2.78, 4.64, and 5.81 kΩ corresponding to l = 2, 3, 4 and 5 cm, respectively.
Phase-contrast image of the as-provided sample of CNTs used in this study. The figure shows the bundled networks of CNTs.

Multi-wall (a) CNTs as well as graphite layer stacking (b) are identified in this high-resolution electron microscopy image.

The configuration of the experimental setup used for testing is shown in Fig. 6. The measurements are carried using the S-parameters performance network analyzer (PNA): Agilent E8361A. The PNA is calibrated in the frequency range 10–400 MHz with a 0.975 MHz frequency step. The intermediate frequency bandwidth is set to 20 Hz to reduce the effect of random noise and reach the PNA maximum dynamic range.
Configuration of the experimental setup used to test the constructed transmission line. Dimensions are not to scale.

IV. RESULTS AND DISCUSSION
As mentioned in the introduction, the measurements are repeated five times (N = 5) for each length, l, of fabricated transmission lines. For each measurement, the previous mass of CNTs, if any, is removed; the substrate is thoroughly cleaned; and a fresh sample of CNTs is packed into the groove. The mass is measured using analytical balance of sensitivity 0.1mg. In Figs 7–18, all the results reported for each individual length correspond to the average obtained from five independent measurements.
Magnitude of reflection coefficient in dB versus frequency in MHz for transmission lines with length l = 2, 3, 4, and 5 cm.

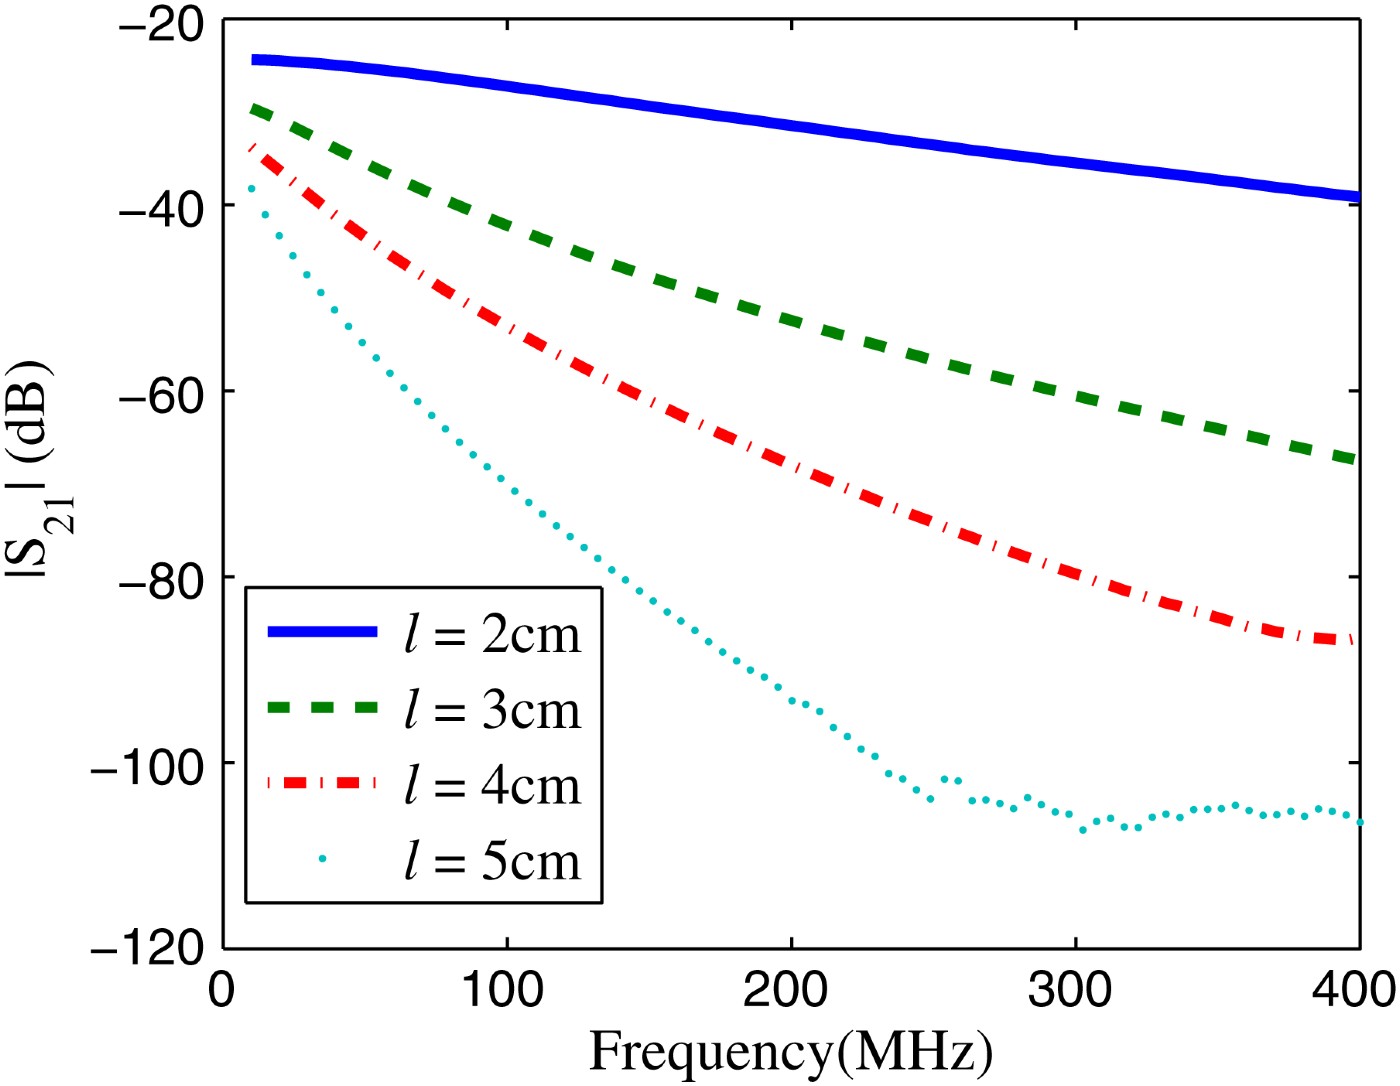
Magnitude of transmission coefficient in dB versus frequency in MHz for transmission lines with length l = 2, 3, 4, and 5 cm.
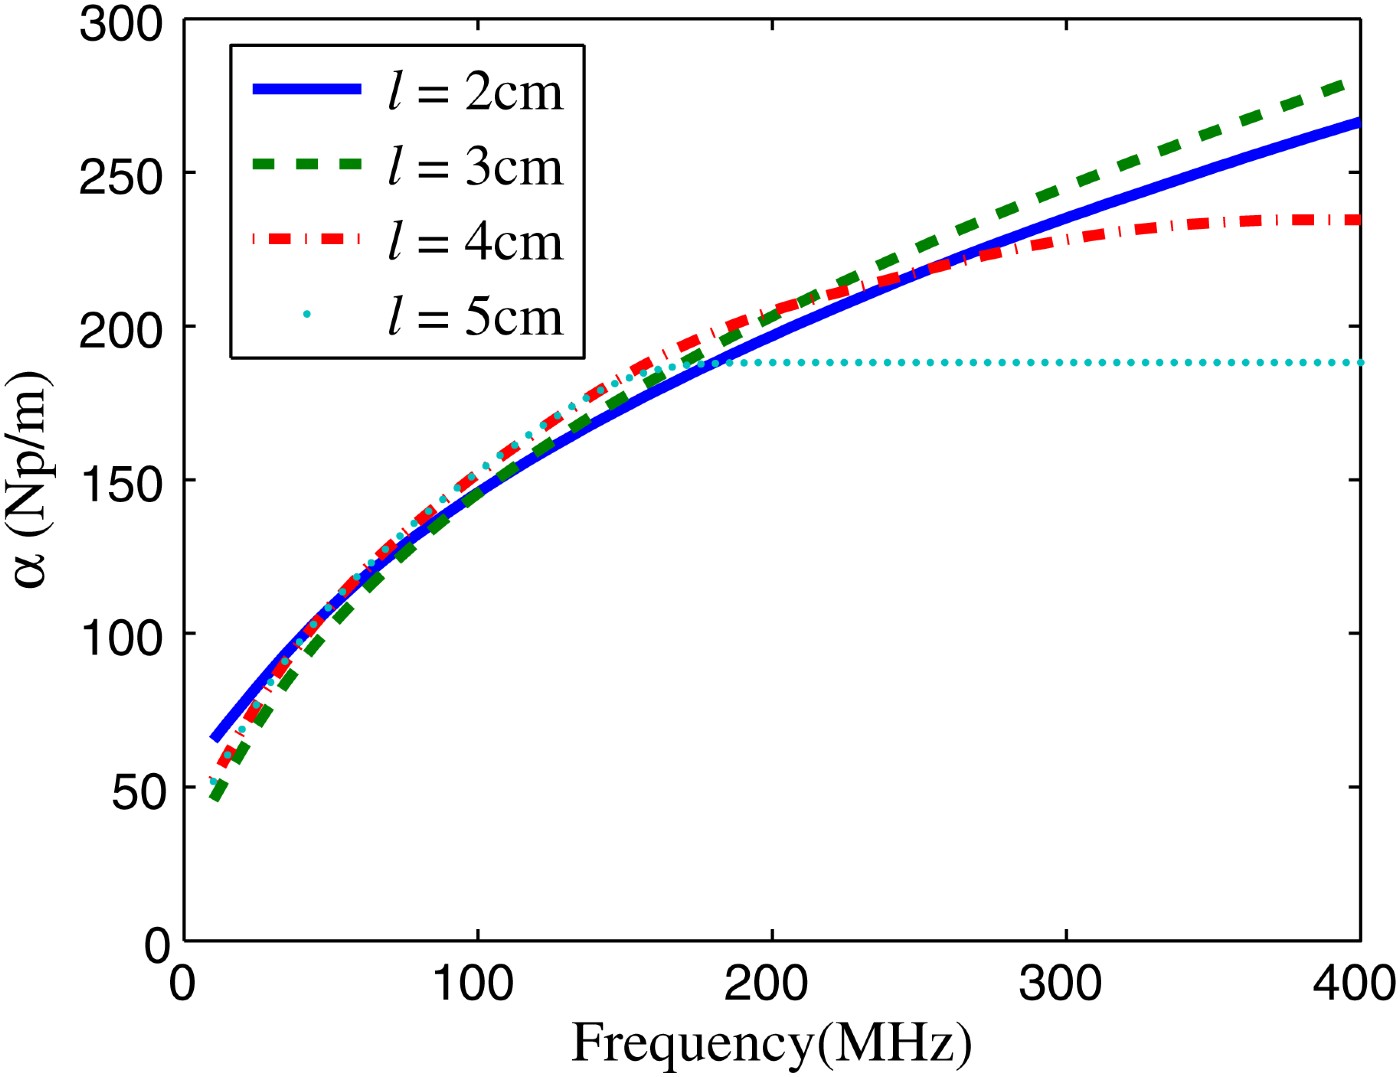
Attenuation constant in Np/m versus frequency in MHz for transmission lines with length l = 2, 3, 4, and 5 cm.
Propagation constant in rad/m versus frequency in MHz for transmission lines with length l = 2, 3, 4, and 5 cm.

Inductance per unit length in mH/m versus frequency in MHz as extracted for the manufactured transmission lines with length l = 2, 3, 4, and 5 cm.

Capacitance per unit length in nF/m versus frequency in MHz as extracted for the manufactured transmission lines with length l = 2, 3, 4, and 5 cm.

Resistance per unit length in kΩ/m versus frequency in MHz as extracted for the manufactured transmission lines with length l = 2, 3, 4, and 5 cm.

Normalized phase velocity versus frequency in MHz as extracted for the manufactured transmission lines with length l = 2, 3, 4, and 5 cm.

Real part of the relative dielectric constant of CNT networks versus frequency in MHz as extracted from the manufactured transmission lines with length l = 2, 3, 4, and 5 cm. Y-axis is in log scale.

Imaginary part of the relative dielectric constant of CNT networks versus frequency in MHz as extracted from the manufactured transmission lines with length l = 2, 3, 4, and 5 cm. Y-axis is in log scale.

Loss tangent of CNT networks versus frequency in MHz as extracted from the manufactured transmission lines with length l = 2, 3, 4, and 5 cm.

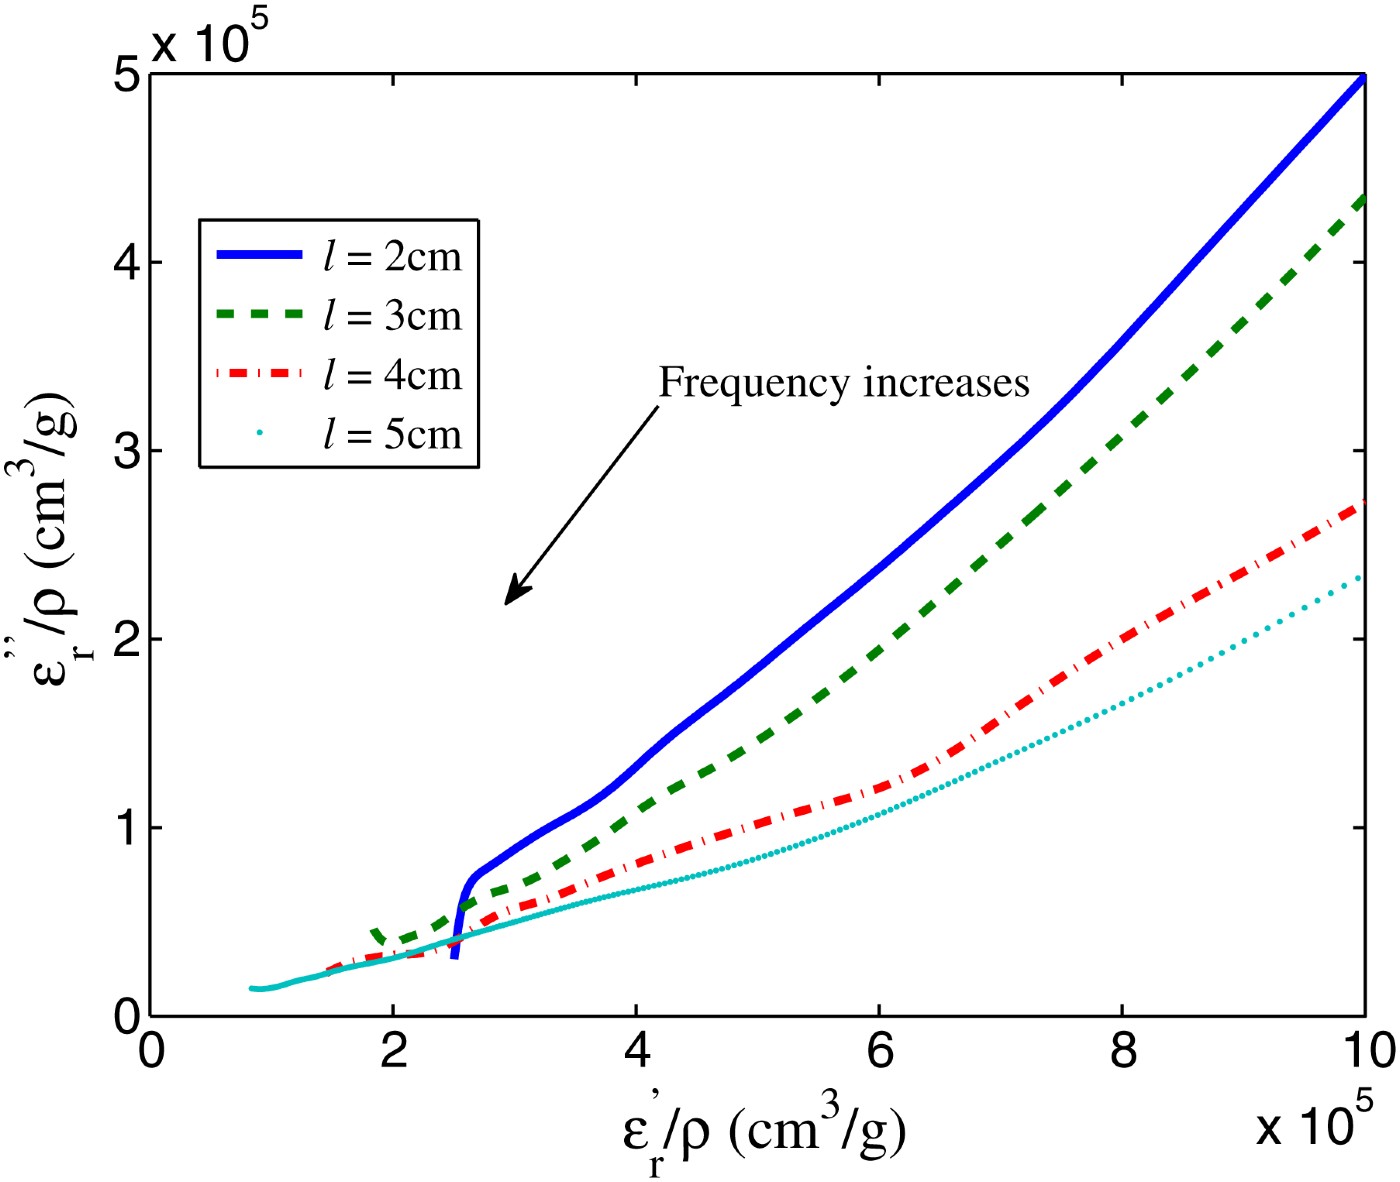
Locus in the complex plane of the relative complex permittivities divided by the bulk density. The averaged data correspond to those extracted from the manufactured transmission lines with length l = 2, 3, 4, and 5 cm.
Before discussing the results reported here, it is necessary to clarify the operating mode of the fabricated transmission line. According to established literature (e.g. [Reference Dresselhaus, Dresselhaus and Avouris2, Reference O'Connell22, Reference Loiseau, Launois, Petit, Roche and Salvetat23]), the CNTs are produced as the mixture of metallic and semiconducting tubes in the approximate ratio of 1:3. Thus a continuous conductive path between the terminals of the transmission line always exists through the mixture of CNTs. The proposed transmission line is considered as atwo conductor system. The first conductor is the outer grounding copper and the second is the connected stream of conducting CNTs between input and output. So, the transmission line is performing as asymmetric stripline waveguide in the frequency range under consideration and propagating mode is transverse electromagnetic (TEM). This is confirmed by measured transmission starting from the beginning of the frequency range of interest. Thus, the theoretical equations developed in Section II can be used to extract the equivalent circuit parameters of the transmission line.
It should be noted that the groove dimensions are initially designed to result-in 50-Ω characteristic impedance under the expectation of excellent-conducting nanotubes filling the groove. However, the magnitude of the reflection coefficient, shown in Fig. 7, indicates that the characteristic impedance is far from the intended 50 Ω. This is due to the nature of CNT networks produced as the mixture of metallic and semiconducting nanotubes. As technology improves, advanced CNT fabrication techniques are expected to produce at low-cost separate metallic or semiconducting CNTs.
As shown in Fig. 8, there is a transmission from very low frequencies which confirms the existence of TEM mode. However, the magnitude of the insertion loss is more than 20 dB. The decay of transmission magnitude with frequency is confirmed by the increase of attenuation with frequency as shown in Fig. 9. The decay of transmission magnitude with frequency and length may be explained as follows. According to [Reference Fuhrer24], there are different types ofjunctions that are created between metallic and semiconducting CNTs such as: metallic–metallic, metallic–semiconducting, and semiconducting–semiconducting. The resistance of each junction is determined by the probability of an electron arriving at the junction to tunnel from one CNT to the other. As the frequency increases, the wavelength gets shorter compared to the separation between CNTs. The probability of tunneling between CNTs in each junction decreases. Moreover, as the length of transmission line increases, the number of junctions increases leading to a reduced transmission between input and output ports. To fully explain this attenuation, further investigations are needed. However, to verify this assumption, a systematic study on samples with controlled contents is needed. At low frequencies, the attenuation is proportional to the square root of frequency then changes linearly with frequency. The attenuation coefficient of TEM mode is attributed to the fact that the maximum electric field component occurs at the same location where the CNTs are located.
The phase propagation constant extracted from (8) is shown in Fig. 10. In all measurements, the magnitude of measured phase shift is always less than 360°. Thus, there is no phase ambiguity affecting the computed phase constant. In the same graph, the free-space propagation constant versus frequency (air light line) is included for comparison purposes. The phase constant curves for all cases indicate that the corresponding phase velocity is always less than the speed of light in free space. The phase constant variations with length l of transmission line is explained in Section V.
In Fig. 11, the inductance in (mH/m) is plotted versus frequency for the fabricated transmission lines. In the reported frequency range, the inductances are varying from the maximum value of 0.7 mH/m to the minimum value of 5.7 µH/m. The inductance is decreasing rapidly up to the offset frequency, which is also called percolation threshold, of 50 MHz after which the inductance is almost constant. This behavior follows the pair approximation model as reported in [Reference Bekyarova11–Reference Xu, Zhang and Anlage14] and explained in [Reference Stauffer and Aharony25]. The pair approximation model is a commonly observed property for randomly oriented networks inside a host medium, which follows the percolation theory [Reference Stauffer and Aharony25]. In mathematics, percolation theory describes the behavior of connected clusters in a random graph. In the current scenario, percolation theory explains the behavior of wave propagation through a random network of CNTs filling the groove of aTEM transmission line. Below an offset frequency, the electrical properties of transmission line are decreasing with the square root of frequency. As operating frequency is increased above offset frequency, wavelength gets smaller and connected clusters of CNT networks appear to be a continuous medium for traveling wave, hence, the electrical properties of transmission line are quite constant. It is to be noted that the inductance per unit length is constant for a coaxial transmission line filled with acontinuous lossless dielectric medium and operating only through its dominant TEM mode. For example a cylindrical coaxial with inner radius 0.61 mm, outer radius 2.1 mm, and filling dielectric material with relative permittivity 2.2, the inductance per unit length is 0.25 µH/m, which is very small compared to the values reported here. In [Reference Burke15], Burke reported a large kinetic inductance of 16 mH/m at dc for purely metallic CNTs. Burke's results are based on Luttingerliquid theory [Reference Luttinger26], which is a theoretical model describing interaction between electrons in a one-dimensional conductor such as CNTs, and formulation reported in [Reference Bockrath27].
Figure 12 presents the frequency dependence of capacitance per unit length (nF/m) for the different lengths l of the tested transmission lines. The capacitance values vary between a maximum of 3.8 nF/m and a minimum of 0.37 nF/m. The capacitance changes with the frequency until the offset frequency of 50 MHz where it reaches a quite constant minimum value. For the same parameters of coaxial transmission line mentioned in the previous paragraph, the capacitance per unit length is 0.1 nF/m. The quantum capacitance per unit length reported in [Reference Burke15] is 0.1 nF/m.
The dependance of resistance per unit length (kΩ/m) on frequency is depicted in Fig. 13. This graph presents a frequency dependence similar to that of the inductance. The resistance drops from the maximum value of 79 kΩ/m at 10 MHz to the minimum value of 6.5 kΩ/m at 400 MHz. The graph shows that the resistance versus frequency is constant up to an offset frequency around f 0 = 50 MHz after which the resistance decreases with frequency according to the pair approximation model as explained above:

where R 0 is the resistance at low-frequency end, k and s are two constants to be obtained from linear curve fitting. The fitting gives approximately k = 1.52 and s = 0.5 for the case of l = 2 cm.
The results shown in Figs 11–13 indicate that the values of L, C, and R per unit length are not varying monotonically with length. This is due to the randomly oriented networks of the mixture of metallic and semiconducting CNTs in the used dry-powder samples. For conventional metallic coaxial transmission lines, the values of L, C, and R per unit length are constant for any length of same metal.
It is interesting to observe that both the inductance and the resistance per unit length are decreasing with frequency. They represent the impedance related directly to CNT networks. The capacitance is viewed as that of the network of CNTs placed distant from a ground plane.
The normalized phase velocity with respect to the speed of light in vacuum is shown in Fig. 14. The phase velocity is quite constant until the onset frequency 50 MHz where it increases quickly with frequency. Within the frequency rangeof interest studied in this paper, the phase velocity in CNTs is much smaller than the speed of light in vacuum: 0.004 < v p/c < 0.08. This indicates that the designed transmission lines are behaving as slow-wave structures. The reduced speed is due to the large value of both real and imaginary parts of the relative dielectric constant corresponding to the CNT networks as shown in Figs 15 and 16, respectively. The highest value of the real part of relative complex permittivity, 9.1 × 10⁶ at 10 MHz, is decreasing rapidly with frequency until 50 MHz where it gradually drops with frequency to reach the value of 5.3 × 10⁴ at 400 MHz. The imaginary part of relative complex permittivity followsthe same movement where it decreases significantly from 13.6 × 10⁶ at 10 MHz to 9.4 × 10³ at 400 MHz. The vertical axes in Figs 15 and 16 are in logarithmic scale to stress on the fact that the realand imaginary parts of relative dielectric constant are not equal. Moreover, loss tangent shown in Fig. 17 varies from a minimum value of 0.28 to a maximum value of 7.48 which indicates that CNT networks in their current status without anychemical processing are very lossy materials. These losses indicate that used CNTs are not purely metallic nanotubes, they are a mixture of metallic and semiconducting nanotubes. The presence of metallic tubes mixed with semiconducting tubes creates plasma effect which is considered the reason for large values of complex permittivity at low frequencies. Also, this mixture of nanotubes creates interfacial polarization which contributes to the high permittivity. It is noted that initially CNTs were intended to be used as replacement to copper trace according to the claimed conductivity of CNTs to be 10 times the conductivity of copper. However, the measurement results revealed high values of relative permittivity at low frequencies which might be used to design and fabricate slow-wave devices. The value of relative complex permittivity is way higher than the relative complex permittivity of microwave materials. Figure 18 shows the complex-plane locus of the relative complex permittivities divided by the bulk density. The averaged data correspond to those extracted from the manufactured transmission lines with length l = 2, 3, 4, and 5 cm. The following formula is used to extract the complex relative dielectric constant of the MUT:

where A groove and A sub are the cross-sectional areas of groove and substrate, respectively. The groove space is where the CNT networks are packed. It is to be noted here the possible existence of air gaps between the nanotubes in addition to the already existing air medium inside the tubes themselves. (The tubes under test are not filled.) As a first-order approximation, (15) is used to estimate the effective complex permittivity of the mixture of CNTs and air. Further work may seem necessary to predict the percentage of air and to extract the complex permittivity of only CNTs. However, the large values of extracted relative dielectric constant imply that they are strongly dominated by CNTs.
V. EFFECT OF CNTS BULK DENSITY ON PARAMETERS
In this section, the effect of varying bulk density on measured and computed electrical parameters is explained. The bulk density is defined to be

where M CNT is the mass of CNTs added inside the groove of volume V. For a fixed volume of air, as more mass of CNTs is added, the percentage of the volume occupied by air is reduced. This leads to a denser material. Moreover, the number of metallic and semiconducting nanotubes, existing inside the volume, increases. For the different lengths of transmission lines, the discrepancy in values of each extracted electrical parameter with packing variation of CNTs is an inherent property of randomly oriented networks subject to percolation theory mentioned before. CNTs used in this study are in dry-powder form. The packing of this material inside the groove is done manually (material is picked from the container then inserted inside the groove). This manual-filling mechanism yields varying densities for each tested case. To overcome this limitation, the measurements are repeated five times for each length l and the results are averaged. This smoothes the final data and gives the bestrepresentative values of electrical parameters. However, the variation of results with the length l of transmission line is due to the different quantities and densities of the tested sample. In fact, the electrical parameters are function of the groove length l as explained by the percolation theory. Through the process of repeated measurements, the mass of CNTs varies from one length to the other and from one set of measurements to the other. For the same structure even if the same mass of CNTs is packed, the orientation of nanotubes might not be the same and results may slightly vary. These explanations are supported by recorded permittivity and measured scattering parameters at different densities as follows. The variation of the real part of relative dielectric constant versus density of CNTs is shown in Fig. 21 at two different frequencies 50 and 100 MHz. The corresponding imaginary part is given in Fig. 22. It is observed that the real and imaginary parts of complex permittivity decrease as the bulk density increases until they reach aconstant value at the actual density of CNTs of 1.1 g/cm3. Figure 19 shows the variation of |S 11| versus frequency at different bulk densities of CNTs filling the groove of the 3-cm transmission line. Figure 20 shows that as the bulk density increases, the transmission between input and output becomes stronger. This may be attributed to the fact that the percentage of conductive CNTs is increasing. In another words, the conductive path between the transmission line terminals is enhanced (Figs 21 and 22).
Magnitude of reflection coefficient versus frequency in MHz for the 3 cm transmission line at different bulk densities.

Magnitude of transmission coefficient versus frequency in MHz for the 3 cm transmission line at different bulk densities.

Variation of the real part of relative dielectric versus density of CNTs at two different frequencies 50 and 100 MHz.

Variation of the imaginary part of relative dielectric versus density of CNTs at two different frequencies 50 and 100 MHz.

The standard deviation of extracted electrical parameters is computed to confine the range of possible values. For example, in Fig. 23, the bars plotted on the mean curve (solid line) represent the standard deviation of the resistance per unit length versus frequency. The graph shows that deviations are decreasing with frequency. Similarly, in Fig. 24, the bars plotted on the mean curve represent the standard deviation of the phase velocity normalized with respect to the speed of light in vacuum versus frequency. The data correspond to the 3-cm transmission line for both figures.
Standard deviation of the mean resistance per unit length versus frequency in MHz. These data are extracted for the 3 cm transmission line.

Standard deviation of the mean phase velocity normalized with respect to the speed of light in vacuum versus frequency. These data are extracted for the 3 cm transmission line.

VI. POTENTIAL OF CNTS IN TRANSMISSION LINES
This study initially started based on theoretical results reported in literature which states that CNTs have a conductivity 10 times the conductivity of copper. This superior conductive properties suggest that CNTs may be used to replace conventional metallic conductors in electric circuits, in general, and RF/microwave circuits in particular. However, as demonstrated in this study, the losses of CNT networks are very high compared to copper. This is due to the low-cost CNTs used, with 1:3 metallic to semiconducting composition. As manufacturing techniques for the preparation of CNT networks and separation between metallic and semiconducting nanotubes improve, it is anticipated that materials consisting of only metallic CNTs would be produced at low cost. Thus, the overwhelming advantages of CNT-based transmission lines will be fully exploited.
VII. CONCLUSIONS
Networks of CNTs replace conventional metallization in planar transmission lines which function as stripline waveguides in the frequency range studied in this paper. The measured two-port scattering parameters enable the extraction of the equivalent circuit elements of the transmission lines. The measurements are repeated and average results are presented. The presented results are in good agreement with the predictions of percolation theory. The computed phase velocity is significantly reduced compared to the speed of light in the frequency range of interest. This shows that the constructed transmission line is behaving as a slow-wave structure. The extracted complex dielectric constant of CNTs exhibits large values which potentially lead to miniaturized components. The data reported here are expected to be useful for designers of CNT-based RF circuits.
In this study, CNTs in dry-powder form are used. However, the procedure is valid for CNTs grown on microwave substrates and the electrical parameters are expected to be in the same order of magnitude as those reported here. The advancement in technology will allow precise control of growth parameters to achieve the electrical parameters required for a specific design purpose.
This paper suggests that the production of high-purity and low-cost metallic or semiconducting CNTs will lead to many developments in RF and microwave circuits and devices. Numerous innovative concepts and functions will be realized.
 Mahmoud A. EL Sabbagh is holding the position of Professor of Practice in the EECS Department, Syracuse University and also working as a consultant with Anaren Microwave, Inc. He is cofounder of EMWaveDev where he is involved in the design of ultra-wideband microwave components. Dr. EL Sabbagh is a senior member of IEEE, received Ph.D. degree from the University of Maryland College Park, College Park, MD in 2002. He worked at several academic and governmental institutes in Cairo, Canada, and US. His research interests include computer-aided design of microwave devices, microwave filter modeling and design for radar and satellites applications, dielectric characterization, metamaterial, EM theory, and RF Nanotechnology.



