







1. Introduction
Ever since the seminal work of Brown & Roshko (Reference Brown and Roshko1974), the study of turbulent flows has increasingly focused on the presence and role of coherent vortical structures. Besides the rollers in the mixing layer, other examples are the hairpin structures in the boundary layers (Head & Bandyopadhyay Reference Head and Bandyopadhyay1981; Zhou et al. Reference Zhou, Adrian, Balachandar and Kendall1999; Ganapathisubramani, Longmire & Marusic Reference Ganapathisubramani, Longmire and Marusic2003; Hutchins & Marusic Reference Hutchins and Marusic2007) as reviewed by Marusic & Monty (Reference Marusic and Monty2019), vortices in swirling jets (Ianiro et al. Reference Ianiro, Lynch, Violato, Cardone and Scarano2018), and structures in turbulent Taylor–Couette flow (Grossmann, Lohse & Sun Reference Grossmann, Lohse and Sun2016). In wall-bounded flows, streamwise rolls transport the low-speed fluid near the wall away from it to form long streamwise streaks, which subsequently break down by bursting (Kim, Kline & Reynolds Reference Kim, Kline and Reynolds1971). The roll–streak interaction maintains turbulence by the self-sustaining mechanism (Hamilton, Kim & Waleffe Reference Hamilton, Kim and Waleffe1995; Schoppa & Hussain Reference Schoppa and Hussain2002; McKeon Reference McKeon2017). The advent of volumetric measurements of turbulent velocity fields has opened up new avenues for the identification and study of such coherent structures (Elsinga et al. Reference Elsinga, Scarano, Wieneke and van Oudheusden2006; Schröder & Schanz Reference Schröder and Schanz2023). Identifying and characterizing these coherent structures in a variety of turbulent flows should aid in lower-order modelling of their behaviour for fundamental elucidation and various applications (Rowley et al. Reference Rowley, Mezić, Bagheri, Schlatter and Henningson2009; Schmid Reference Schmid2010).
There exist numerous studies of turbulent flow through contractions, because of their relevance to many industrial flow configurations, as concerns mixing, pressure drop, noise, and so on. Early on, Prandtl (Reference Prandtl1933) suggested treating random distributions of vorticity as a primary quantity underlying the turbulent velocity fluctuations, with stretching of strain-aligned vortex filaments amplifying their vorticity. By applying continuity and conservation of angular momentum, one can express, in terms of a streamwise contraction ratio  $c$, that the stretched fluctuating vorticity component in the streamwise direction grows by
 $c$, while in the compressed transverse directions, the fluctuations reduce by a factor
 $c^{-1/2}$. On the other hand, the velocity fluctuations are tangential to the cross-section of the vortex filaments, hence their streamwise variation can be obtained using similar arguments, i.e. streamwise fluctuations
 $u_{rms}$ decay as
 $c^{-1}$ while the transverse fluctuations
 $v_{rms}$ and
 $w_{rms}$ grow proportional to
 $c^{1/2}$. Similar scaling was obtained from spectral theory by Taylor (Reference Taylor1935) and Ribner & Tucker (Reference Ribner and Tucker1952). Taylor (Reference Taylor1935) used one Fourier mode to represent vorticity disturbances in three-dimensional (3-D) Taylor–Green cells, and obtained its amplification at the contraction exit. He showed that
 $u_{rms}$ decays within the range between
 $c^{-1}$ and
 $2c^{-1}$. In contrast, the transverse
 $v_{rms}$ grows as
 $c^{1/2}$, similar to Prandtl's theory, but the prefactor depends on the initial anisotropy and the strength of the contraction. Ribner & Tucker (Reference Ribner and Tucker1952) used detailed spectral analysis of an initially isotropic turbulent field to obtain relations for the ratio of root mean square (r.m.s.) velocity fluctuations before and after the contraction. Batchelor & Proudman (Reference Batchelor and Proudman1954) independently derived such relations by assuming rapid distortion of fluid elements relative to their displacement, which was later called rapid distortion theory (RDT) (Sreenivasan & Narasimha Reference Sreenivasan and Narasimha1978; Hunt & Carruthers Reference Hunt and Carruthers1990). They suggested that for a symmetric contraction, the ratio of streamwise turbulent energy from outlet to inlet
 $u_{rms,2}^2/u_{rms,1}^2$ varies as
 ${{\frac 34 c^{-2}[\log (4c ^3) -1]}}$, for
 ${{c}}\geqslant {{2}}$. Similarly, the ratio of energies of the two lateral velocity components
 $(v_{rms,2}^2+w_{rms,2}^2)/(v_{rms,1}^2+w_{rms,1}^2)$ is approximately
 ${{\frac 34c}}$. Sreenivasan & Narasimha (Reference Sreenivasan and Narasimha1978) generalized the theory of Batchelor & Proudman (Reference Batchelor and Proudman1954) for the distortion of an initially homogeneous, axisymmetric turbulence. They used Fourier transforms in terms of two scalar functions of the wavenumber vector and its projection on the axis of symmetry to express the velocity spectral tensor, in order to obtain the ratio of energies before and after the distortion. They compared their predictions to those of isotropic models and experiments. For large-
 $c$ planar and axisymmetric contractions, their longitudinal energy predictions matched isotropic theory.
Experiments, primarily using single-point hot-wire measurements (Uberoi Reference Uberoi1956; Hussain & Ramjee Reference Hussain and Ramjee1976; Tan-Atichat, Nagib & Drubka Reference Tan-Atichat, Nagib and Drubka1980; Thoroddsen & Van Atta Reference Thoroddsen and Van Atta1995; Ayyalasomayajula & Warhaft Reference Ayyalasomayajula and Warhaft2006) have verified qualitatively the above framework for the velocity fluctuations, but only for small contraction ratios. Uberoi (Reference Uberoi1956), in his pioneering measurements in many different axisymmetric contractions with total ratios  $C=4$, 9 and 16, verified the decay of
 $u_{rms}$ and increase in the lateral
 $v_{rms}$ for the smaller
 $C$. This was done in grid-generated wind tunnel turbulence over a large range of Reynolds numbers
 ${Re_{M}=U_i M/\nu } = 3700\unicode{x2013}12\,000$, where
 $U_i$ is the mean velocity at the inlet, and
 $M$ is the grid mesh size. However, for the strongest contraction with
 $C=16$,
 $u_{rms}$ initially decreases, but then increases towards the exit. He concluded that Prandtl's theory applies only for
 $C<4$.
Reynolds & Tucker (Reference Reynolds and Tucker1975) performed hot-wire experiments in wind tunnel test sections with three different straining conditions, which included axisymmetric straining as well as one axis contracting while the other expands to keep the cross-sectional area constant. Hussain & Ramjee (Reference Hussain and Ramjee1976) also observed the non-monotonic behaviour in  $u_{rms}$ when
 $C>4$, when they studied the effects of different axisymmetric contraction shapes while keeping the total contraction ratio constant at
 $C=11$. Their experiments also focused on wind tunnel design and used minimal inlet fluctuations using a fine 1.4-mm mesh, thereby giving
 $Re_{M}=234$, while the exit bulk
 $Re$ based on the nozzle diameter reached
 $Re_D \sim 10^5$. The non-monotonic downstream evolution of
 $u_{rms}$ was also reported by Tan-Atichat et al. (Reference Tan-Atichat, Nagib and Drubka1980), who investigated ten axisymmetric contractions with a wide range of
 $C=2\unicode{x2013}36$, while varying their aspect ratios and incoming turbulence levels. They emphasized the influence of the inlet turbulent length scales on the straining effect. In their subsequent experiments in a settling chamber followed by an axisymmetric contraction with
 $C=9$, Nagib, Marion & Tan-Atichat (Reference Nagib, Marion and Tan-Atichat1984) conclude that a larger contraction ratio can probably be used to reach small integral scales and low fluctuating intensities for wind tunnel applications.
Ayyalasomayajula & Warhaft (Reference Ayyalasomayajula and Warhaft2006) investigated turbulence evolution through an axisymmetric contraction, with ratio  $C=4$, for both passive and active grids producing a wide range of
 $Re_{\lambda } = 40\unicode{x2013}470$. They made comparison with RDT predictions of the turbulence statistics through the contraction and the subsequent return to isotropy. They found that the ratio of longitudinal r.m.s. fluctuations before and after contraction agreed well with the RDT limits computed for an initial isotropic spectrum. The measured transverse r.m.s. fluctuations ratio was, in contrast, smaller than the RDT values. Following this work, the effect of strain on temperature fluctuations was investigated in the same contraction by Gylfason & Warhaft (Reference Gylfason and Warhaft2009), wherein they imposed transverse mean temperature gradient onto the homogeneous, grid-generated turbulence. They compared the evolution of the fluctuating temperature gradient anisotropy tensor with RDT predictions with isotropic inlet condition. They found that the theory overestimated the transverse, while underestimated the longitudinal component of the fluctuating gradients. Thoroddsen & Van Atta (Reference Thoroddsen and Van Atta1995) previously investigated the straining effect within a two-dimensional (2-D) contraction having
 $C=2.5$, while adding a passive or strong transverse thermal gradient to the wind tunnel. The stretching enhancement of the transverse vertical velocity component is reduced by buoyancy for a strong temperature gradient generating stable density stratification. Without the temperature stratification,
 $u_{rms}$ is reduced by
 ${\sim }40\,\%$ through the entire contraction, while
 $w_{rms}$ grows by a factor
 ${\sim }30\,\%$, broadly consistent with the above studies. These r.m.s. velocity components tend to the same level very slowly downstream of the exit.
Based on their study in contractions with  $C=3.69$ and 14.75, Ertunç & Durst (Reference Ertunç and Durst2008) questioned all previous hot-wire measurements of the streamwise
 $u_{rms}$. They postulated that
 $u_{rms}$ should decrease monotonically in a contraction as per RDT, and called the increase after an initial decay a ‘high contraction ratio anomaly’. They attributed this anomalous behaviour to measurement errors originating from noise in the instruments, spatial resolution of the wires, or fluctuating inlet flow conditions. Keep in mind that these sources of noise should not be present in our optical measurement technique, described herein.
Direct numerical simulations (DNS) can provide time-resolved 3-D velocity, vorticity and pressure fields, which can be very helpful in understanding coherent structures and their characteristics, where single-point measurements fail to detect them. However, in complex geometries, such simulations are limited to moderate  $Re_{\lambda }$, and rather than simulating the contracting stream, they are often formulated in idealized conditions of uniform strain. Below, we list some important numerical studies in straining geometries wherein the behaviours of vortical structures are discussed. Clay & Yeung (Reference Clay and Yeung2016) used DNS to reproduce the experimental results of Ayyalasomayajula & Warhaft (Reference Ayyalasomayajula and Warhaft2006), by applying time-dependent strain on the computational domain to match the experimental conditions, but only up to a maximum
 $Re_{\lambda }=95$. Similarly, Gualtieri & Meneveau (Reference Gualtieri and Meneveau2010) simulated the straining–destraining experiments of Chen, Meneveau & Katz (Reference Chen, Meneveau and Katz2006), wherein they used planar particle image velocimetry (PIV) to study active-grid-generated turbulence subjected to planar piston-driven compression and straining cycles in a piston tank device at up to
 $Re_{\lambda }= 400$. This very large value of
 $Re_{\lambda }$ was accomplished with experiments very close to the grid, at
 $x/M \sim 3.5$, where homogeneity may be affected. Gualtieri & Meneveau (Reference Gualtieri and Meneveau2010) simulated these experiments, but only up to a maximum
 $Re_{\lambda }=40$. By visualizing coherent structures by
 $\varDelta$-criterion, they noted qualitatively that the initially arbitrarily oriented worm-like structures tend to align along the positive strain direction during the straining phase. They return to the initial isotropic state when the strain is removed. Jang, Sung & Krogstad (Reference Jang, Sung and Krogstad2011) simulated fully developed turbulent pipe flow through an axisymmetric contraction, focusing on the boundary layer structures. They noted that the spanwise vortical structures, visualized based on swirling strength, get stretched in the contraction, with the long ‘streaky’ structures aligned in the streamwise direction towards the exit of the contraction. Lee et al. (Reference Lee, Gylfason, Perlekar and Toschi2015) studied dynamics of particle-laden turbulence subjected to axisymmetric expansion at
 $Re_{\lambda }=117$ and 193. Qualitatively, coherent filaments, visualized by vorticity magnitude, are seen to align with the extensional directions in the contraction.
Herein, we experimentally identify and study the evolution of coherent vortical structures in a turbulent flow through a rapid 16 : 1 3-D contraction. Using time-resolved volumetric Lagrangian particle tracking (LPT) velocimetry, we collect a sufficient number of realizations to quantitatively characterize the length, orientation and prevalence of these vortical structures. Besides our earlier study in a weaker 2-D contraction, with  $C=2.5$ (Mugundhan et al. Reference Mugundhan, Pugazenthi, Speirs, Samtaney and Thoroddsen2020), we present for the first time the time-resolved volumetric measurements in this ‘axisymmetric’ geometry for
 $C=16$. It is important to note that most previous studies have focused on single-point hot-wire measurements, which precludes them from capturing any coherent vortical structures or even measuring vorticity.
2. Experimental set-up
2.1. Water tunnel
The water flow facility (figure 1a) is the same as used by Mugundhan et al. (Reference Mugundhan, Pugazenthi, Speirs, Samtaney and Thoroddsen2020), but with a different contraction section, which now contracts the flow in both horizontal directions. The 16 : 1 area contraction reduces the square cross-section from  $180\times 180\ {\rm mm}^2$ at the inlet to
 $45\times 45\ {\rm mm}^2$ at the outlet. The water is pumped into a constant-head inlet tank from a 500 litre supply tank using a centrifugal pump. A constant water level is maintained in the overhead tank by setting the bypass valve at a constant opening with the valve at pump suction and the two ball valves in the return lines left fully opened, thus operating at maximum flow rate. Honeycomb and perforated plates kill off large-scale motions and make the flow uniform as it enters the active grid through a 203 mm long converging section that reduces the cross-section from
 $260\times 260\ {\rm mm}^2$ to
 $180\times 180\ {\rm mm}^2$. The active grid consists of 10 independently rotated rods with flat blades with holes, and mesh size
 $M=30$ mm. This allows synchronized or random grid rotation protocols to inject turbulent fluctuations, as explained in Mugundhan et al. (Reference Mugundhan, Pugazenthi, Speirs, Samtaney and Thoroddsen2020). Here, we use mostly results from the random mode where the shafts are rotated at a constant speed 210 or 240 rpm but the cruise time is varied randomly between 0.5 and 1.5 times the period of one full revolution. This is referred to as the single-random mode in the literature (Larssen & Devenport Reference Larssen and Devenport2011). Our previous studies in the same set-up showed that the random mode resulted in higher
 $Re_{\lambda }$ and better transverse homogeneity than for the synchronized mode (Mugundhan et al. Reference Mugundhan, Pugazenthi, Speirs, Samtaney and Thoroddsen2020; Mugundhan & Thoroddsen Reference Mugundhan and Thoroddsen2023). Following the active grid, we include a 478 mm long channel of uniform cross-section before the inlet to the contraction, to improve transverse homogeneity. On the other hand, this long section reduces the turbulence intensity to
 $u_{rms}/\langle U_{{in}} \rangle = 5.8\,\%$, while producing
 $Re_{\lambda }=192$ at the inlet to the contraction.
(a) Schematic of the gravity-driven water tunnel with a two-directional 16 : 1 contraction. (b) The three measurement volumes P1–P3 with respect to the coordinate axes positioned at the start of the contraction. The depth of the measurement volumes into the board is 23 mm;  $M$ is the mesh size of the active grid, and SOC and EOC represent the start and end of the contraction. (c) A 3-D rendering of the contraction. All dimensions are in mm.

The contraction is formed with four 15 mm thick acrylic plates which are assembled to make an angle  $11^{\circ }$ with the vertical. To avoid any feedback effects from the outlet, a 500 mm long downstream straight section is provided before water exits the vertical channel symmetrically into two outlet pipes recirculating the flow to the supply tank. The inlet velocity is
 $\langle U_{{in}} \rangle = 0.28\ {\rm m}\ {\rm s}^{-1}$, but it reaches
 $2.52\ {\rm m}\ {\rm s}^{-1}$ near the bottom of region P3, i.e. the closest measurement to the outlet. Table 1 lists other turbulent quantities slightly inside the inlet of the contraction, at
 $x=5$ mm. Figure 1(b) shows the locations of the three measurement volumes, which were investigated in experiments on separate days, as they require rearrangement of the laser optics and cameras. All experimental runs are conducted at least 5 min after steady flow is reached. The measurements are taken near room temperature
 $21\,^{\circ }{\rm C}$, where the water density is
 $\rho = 998\ {\rm kg}\ {\rm m}^{-3}$ and the dynamic viscosity is
 $\mu =9.79 \times 10^{-4}\ {\rm Pa}\ {\rm s}$.
Turbulence quantities slightly inside the contraction, at  $x=5$ mm: mean inlet velocity
 ${ \langle U_{in} \rangle } \approx 0.28\ {\rm m}\ {\rm s}^{-1}$, streamwise velocity fluctuation
 $u_{rms}$, turbulent kinetic energy
 ${k}$, dissipation rate
 ${\varepsilon }$, streamwise integral length scale
 ${L_I}$, and Taylor microscale
 ${\lambda }$, computed by the two-point spatial correlation function
 $f(r)=[{ \langle u(x)\,u(x+\boldsymbol {e}_xr) \rangle }]/{ \langle u^2 \rangle }$. The Kolmogorov length scale is
 ${\eta }=(\nu ^3/\varepsilon )^{1/4}$, and Reynolds numbers are based on
 ${L_I}$ and
 ${\lambda }$. The velocity grid measurement resolution is
 $\Delta x$, and
 $S^{*}$ characterizes the maximum mean strain, in terms of a time scale ratio from the mean strain and the turbulent straining, as
 $S^{*} = \sqrt {3}\, (\partial \langle U \rangle /\partial x) (k/\varepsilon )$, with the prefactor for an axisymmetric contraction, according to Ayyalasomayajula & Warhaft (Reference Ayyalasomayajula and Warhaft2006).

2.2. Volumetric velocity measurements
We employ 3-D LPT velocimetry with the shake-the-box (STB) algorithm (Schanz, Gesemann & Schröder Reference Schanz, Gesemann and Schröder2016), as implemented by LaVision (DaVis 10.2 software) to obtain time-resolved volumetric flow fields. We utilize four high-speed 4 Mpx video cameras (Phantom V2640, which can capture up to 6600 frames per second (fps) at the full  $2048 \times 1952$ resolution) equipped with 85 mm Nikkor tilt lenses for a Scheimpflug set-up to align the focal plane with the laser. The aperture is set at f/22, to ensure sufficiently large depth of focus. Two of the cameras are mounted on each side of the test section, with optimal angles between adjacent cameras
 ${\sim }28^{\circ }\unicode{x2013}32^{\circ }$ for the particle triangulations, i.e. using a set-up similar to that in our previous experiments in a 2-D contraction (Mugundhan et al. Reference Mugundhan, Pugazenthi, Speirs, Samtaney and Thoroddsen2020). The cameras are positioned such that the viewing direction is approximately normal to the contraction walls to minimize optical distortions. A high-speed dual-cavity pulsed Nd-YLF green laser (527 nm Litron LDY 300 PIV) provides a beam that is expanded with two cylindrical lenses to illuminate a volume slice approximately 23 mm wide. The laser pulse duration is 100 ns width, with maximum energy output, pulsing both cavities simultaneously,
 $23\ {\rm mJ}\ {\rm pulse}^{-1}$, at 70 % power and frequency 1 kHz. The tracers are surfactant-treated fluorescent red polyethylene microspheres
 ${\sim }50\unicode{x2013}70\ \mathrm {\mu }{\rm m}$ (from Cospheric). These particles are close to neutrally buoyant with density
 $1.05\ {\rm g}\ {\rm cm}^{-3}$, which gives Stokes number
 $2\times 10^{-4}$ and suggests that the particles will follow the flow faithfully.
The measurements were performed in three separate regions (P1, P2 and P3) along the length of the contraction, as shown in figure 1(b). The corresponding volume slices were  $106\times 106\times 23\ {\rm mm}^3$,
 $106\times 58\times 23\ {\rm mm}^3$ and
 $85\times 42\times 23\ {\rm mm}^3$. To capture the particles in the accelerating flow, the frame rate must be increased in the different regions within the contraction, increasing in the streamwise direction from 1000 to 2000 to 4000 fps in volume P3 nearest to the outlet.
Spatial calibration maps the physical coordinates in the volume of interest to the sensor coordinates, using third-order polynomials in multiple planes. This process is performed with the test section filled with water, illuminated by normal lighting using an 11.8 mm thick double-sided calibration plate from LaVision (number 106-10). The whole  $106\ {\rm mm} \times 106\ {\rm mm}$ size of the calibration plate is used for region P1, while in the narrower regions, P2 and P3, it is trimmed from the sides to fit without touching the contraction walls. The plates used in P2 and P3 measure
 $106\ {\rm mm} \times 58\ {\rm mm}$ and
 $106\ {\rm mm} \times 42\ {\rm mm}$, respectively. Following image pre-processing (which involves subtracting a sliding minimum over 5 pixels and normalizing intensities with a local average), the volume self-calibration is applied (Wieneke Reference Wieneke2008). The volume self-calibration corrects for any misalignment between the original calibration and the experimental runs, and is performed using up to 20 000 brightest particles in the full recording. The self-calibration also implements the optical transfer function, to account for the different distortions of the particle images, depending on their location away from the lens centre.
The particle tracking algorithm (STB) identifies the 3-D location of particles by triangulating their images from the four cameras. To start the tracking, STB relies on a standard correlation or particle tracking velocimetry (PTV) algorithms. The original tracks at  $t$ are then fitted and extrapolated to predict the future location of each particle at time
 $t+\Delta t$. The particle position is then corrected by ‘shaking’ the particle in all three directions until its projection matches the real images in all four cameras. This is done by minimizing a cost function that is the difference between the projected and captured images, using iterative particle reconstruction (Wieneke Reference Wieneke2013). The recent review of Schröder & Schanz (Reference Schröder and Schanz2023) gives details of this 3-D LPT technique and its recent advances. The STB algorithm in DaVis 10.2 provides the particle statistics for every time step, which includes the number of particles identified, the number of particles that can be tracked, and the number of new particles entering the measurement volume. In our experimental runs, on average, the algorithm tracks around 210 000, 80 000 and 50 000 particles in the differently sized volumes P1, P2 and P3, respectively.
The Lagrangian particle tracks are then mapped onto a regular Eulerian grid, using the ‘binning’ step implemented in DaVis 10.2 software. Here, one considers all the particles within a cubical volume of size  $48\times 48\times 48$ voxels, which corresponds to
 $2.64\times 2.64\times 2.64\ {\rm mm}^3$. The velocity at the centre of the volume is calculated based on spatial second-order polynomial fits to the velocities of the typically 10–14 particles contained within the volume. With 75 % overlap of adjacent volumes, we reconstruct Eulerian velocities on a uniform grid with spacing
 $\Delta x = 0.66$ mm, which is approximately twice the estimated Kolmogorov scale. This interpolation provides 1 million, 600 000 and 300 000 velocity vectors within the P1, P2 and P3 regions, respectively. The choice of these parameters for the conversion from the Lagrangian tracks to Eulerian velocities is based on our previous study, where we used similar camera magnification and particle size and concentration. A systematic study was performed on the effect of volume size and time filter length on the r.m.s. statistics, as explained in the supplemental material of Mugundhan et al. (Reference Mugundhan, Pugazenthi, Speirs, Samtaney and Thoroddsen2020). We see that smaller volumes of 36 or 32 voxels can overpredict the r.m.s. values and the velocity gradients, hence all our calculations are based on velocities obtained from 48 voxels. Also, the vorticity field is ‘more’ continuous in time with 48 voxels as compared to the smaller volumes. We use time filter lengths
 $5$ for r.m.s. statistics and
 $11$ time steps to improve ‘trackability’ of the coherent vortical structures.
With the current magnification, we do not resolve the smallest scales. Casey, Sakakibara & Thoroddsen (Reference Casey, Sakakibara and Thoroddsen2013) and Mugundhan et al. (Reference Mugundhan, Pugazenthi, Speirs, Samtaney and Thoroddsen2020) show a clear shift in the peak of the probability density function (p.d.f.) of vorticity to higher values with increase in the camera magnification by  $\sim$2 times. The zoomed-in experiments resulted in higher values for the gradients and thus enhanced vorticity magnitude. Though the small scales are not fully resolved with the lower magnification, the large structures are captured as noted by Casey et al. (Reference Casey, Sakakibara and Thoroddsen2013). We find that the current set-up is a good compromise between volume size and resolution. The uncertainty and convergence of our measurements is discussed in the supplementary material available at https://doi.org/10.1017/jfm.2024.859.
3. Results
3.1. Mean velocity and fluctuation levels
Figure 2(a) shows the mean streamwise velocity along the centreline of the contraction. Near the exit, at the lowest part of the measurement volumes, the mean velocity has increased to  ${\sim }9$ times the inlet velocity, while the transverse mean velocities are near zero, as expected by symmetry. The r.m.s. velocity components shown in figure 2(b) are consistent with earlier experiments (Uberoi Reference Uberoi1956; Hussain & Ramjee Reference Hussain and Ramjee1976; Tan-Atichat et al. Reference Tan-Atichat, Nagib and Drubka1980), starting with suppression of the streamwise
 $u_{rms}$, with steady increase in the transverse fluctuations, owing to stretching of streamwise vortices. In the lowest test volume,
 $u_{rms}$ starts growing again, through nonlinear interactions. The gaps between measurement regions are due to experimental constraints that require the experimental runs in each region be conducted on separate days. This is necessitated by significant adjustments to the optical system, camera arrangement and new calibration. However, care is taken to ensure that the centreline of the laser volume aligns with the contraction axis; but there could be a shift by 2–3 mm that can cause small jumps between the regions P1, P2 and P3 in figure 2. Figure 2(c) shows the same scenario in terms of the vorticity components, where the streamwise
 $\omega _{x,rms}$ grows by factor 4, while the transverse component reduces slightly then stays approximately constant, with
 $\omega _{x,rms}/\omega _{z,rms} \approx 4.5$, at the lowest measurement location in P3, 10 mm before the end of contraction, with local
 $c\approx 11$. The vorticity fluctuations, which have not been measured previously, show results qualitatively consistent with the above basic inviscid theory, while the magnification is much below a factor of
 $c$.
(a) Mean velocity components along the centreline of the contraction. (b) The r.m.s. velocity components normalized by the mean inlet velocity  $\langle U_{{in}} \rangle$. (c) Vorticity r.m.s. for the streamwise
 $\omega _{x,rms}$ and transverse component
 $\omega _{z,rms}$.

3.2. Comparison with RDT
The reduction in streamwise r.m.s. velocity and increase in transverse r.m.s. can be compared to the theoretical predictions of RDT. We consider the square of the ratio of fluctuating r.m.s. velocities between inlet and outlet expressed as  $\mu _1 = [u_{rms}(x_{out})/u_{rms}(x_{in})]^2$, and compare to Batchelor & Proudman (Reference Batchelor and Proudman1954) (obtained independently by Ribner & Tucker Reference Ribner and Tucker1952) for our results at
 $Re_{\lambda } \approx 110$ and 190 in figure 3, corresponding to synchronous and random grid rotation protocols. The theory decomposes the fluctuations into Fourier modes in wavenumber space, and ignores viscous stress and the nonlinear advection term to derive expressions for these energy ratios. The underlying assumptions of incompressibility, homogeneity, isotropy and rapid distortion apply in our case to a reasonable extent. The expressions for the longitudinal
 $\mu _1$ and transverse
 $\mu _2$ energy ratios, in terms of the local contraction ratio
 $c$, are given by
 $$\begin{gather} \mu_1=\frac{\left \langle u^2 \right \rangle}{\left \langle u_o^2 \right \rangle}=\frac{3}{4c^2}\left [ \frac{1+\alpha^2}{2\alpha^3}\log\left (\frac{1+\alpha}{1-\alpha} \right ) - \frac{1}{\alpha^2}\right ] , \end{gather}$$
 $$\begin{gather}\mu_2=\frac{\left \langle v^2 \right \rangle+\left \langle w^2 \right \rangle}{\left \langle v_o^2 \right \rangle+\left \langle w_o^2 \right \rangle}=\frac{3}{4}\,c+\frac{3}{4c^2}\left [\frac{1}{2\alpha^2} - \frac{1-\alpha^2}{4\alpha^3}\log\left (\frac{1+\alpha}{1-\alpha} \right )\right ], \end{gather}$$
where  $\alpha ^2=1-c^{-3}$, and the subscript ‘
 $o$’ represents conditions at the inlet to the contraction. The streamwise energy ratio agrees reasonably well with the monotonic theoretical curve, but only up to
 $c= 3$, after which it deviates greatly from the theory. This non-monotonic behaviour of
 $u_{rms}$ has been documented before in experiments with contraction ratios
 $C>4$; see Uberoi (Reference Uberoi1956), Hussain & Ramjee (Reference Hussain and Ramjee1976) and Tan-Atichat et al. (Reference Tan-Atichat, Nagib and Drubka1980). These studies observed that
 $\mu _1$ reaches its minimum close to
 $c=4$, while in our case the minimum is at approximately
 $c=3$ for both cases, following which it increases. On the other hand, while the transverse energy
 $\mu _2$ evolves qualitatively similarly to the theory, figure 3(b) shows a constant deviation being lower by a factor 2–3, which is consistent with previous studies. Consistently larger values for
 $\mu _1$ and
 $\mu _2$ are observed for our lower
 $Re_{\lambda }$ case. Close to the exit, at
 $c=11$, the values of
 $\mu _1$ and
 $\mu _2$ are 1.6 and 3 for our lower
 $Re_{\lambda }=110$, but 2 and 4 for the higher
 $Re_{\lambda }=190$. The corresponding values in the experiments of Uberoi (Reference Uberoi1956) are 0.9 and 6, and in Hussain & Ramjee (Reference Hussain and Ramjee1976) they are 0.5 and 4. Later, Tsugé (Reference Tsugé1984) explained this discrepancy between theory and experiments by the theory's lack of consideration of the interaction of the turbulent vortices with the mean flow. He proposed that the small eddies decay in accordance to the theory, whereas the large eddies get amplified along the contraction. His modifications to the theory could match the results of Uberoi (Reference Uberoi1956) and Hussain & Ramjee (Reference Hussain and Ramjee1976).
Comparison of the (a) streamwise  $\mu _1$ and (b) transverse
 $\mu _2$ kinetic energy ratios with the linear RDT of Batchelor & Proudman (Reference Batchelor and Proudman1954) (BP-54). The theoretical expressions (black lines) are given by (3.1) and (3.2). The two Reynolds numbers arise from the random (blue asterisks) and synchronous (red circles) grid rotation protocols.

3.3. Coherent vortical structures
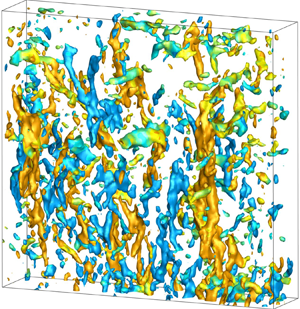
Having acquired volumetric measurements, we can, in addition to the r.m.s. fluctuations, investigate coherent vortical structures. Figure 4 shows examples of the vortical structures in the three measurement regions within the contraction, the locations of which were shown in figure 1(b). The structures are identified by the isosurfaces of vorticity. At the entrance to the contraction, the vortices are small and fairly randomly oriented, while in the centre, they become longer and a few of them are more prominent. On the other hand, near the outlet, where the mean strain is largest, the flow is characterized by isolated long streamwise vortices. Furthermore, the strength of these vortices has been greatly enhanced towards the outlet. In these plots, the  ${ | \omega |}$ threshold is increased in the streamwise direction, from 15 to 20 to
 $40\ {\rm s}^{-1}$. These coherent streamwise structures emerge repeatedly and dominate the observed turbulent structure. Figure 5 shows five examples in the lowest volume P3, taken from five different experimental runs.
The time evolution of the isosurfaces of vorticity magnitude normalized by the maximum mean strain rate  ${ | \omega |}/S_{{max}}$, where the maximum measured value is
 $S_{max} = \sqrt {3}\,|\partial \langle U \rangle /\partial x|_{max} = 51\ {\rm s}^{-1}$. The isosurfaces are coloured based on the rotation direction of each structure with respect to the vertical, i.e. the sign of
 $\omega _{x}$. Each row shows a sequence corresponding to the different measurement regions, captured in different experimental runs. The volumes shown are separated by 60 video frames, captured at frame rates 1000 fps for P1, 2000 fps for P2, and 4000 fps for P3. This corresponds to time intervals 60, 30 and 15 ms, respectively. The
 $XYZ$ coordinates shown in the figure are local to the measurement region, as arising from the separate calibrations. The corresponding
 $x$ extents and the thresholds used for visualization in each volume are: (a) volume P1,
 $x = [0,106]$ mm, with threshold
 ${ | \omega |} = 15\ {\rm s}^{-1}$, or
 ${ | \omega |}/S_{{max}} = 0.29$; (b) volume P2,
 $x = [124,230]$ mm, with
 ${ | \omega |} = 20\ {\rm s}^{-1}$, or
 ${ | \omega |}/S_{{max}} = 0.39$; (c) volume P3,
 $x = [244,325]$ mm, with
 ${ | \omega |} = 40\ {\rm s}^{-1}$, or
 ${ | \omega |}/S_{{max}} = 0.78$. The depths of the volumes into the board are all 23 mm. Each row is for a different experimental run.

(a–e) Five examples of the coherent vortical structures, each taken from a different experimental run. The isosurfaces correspond to  $|\omega |=40\ {\rm s}^{-1}$ (
 ${ | \omega |}/S_{{max}} = 0.78$), with the two colours indicating opposite sign rotation directions. The supplementary material contains snapshots of all 795 observed structures.

Using a  ${ | \omega |}$ threshold and a watershed algorithm, we identify the coherent structures based on their volumes. We also fit an ellipsoid around the largest vortices, which provides an estimate for their orientation and length. The choice of
 ${ | \omega |}$ threshold and the ellipsoid fitting is discussed in the supplementary material. Figure 6(a) shows the probability of vortex lengths
 $L$, which grows greatly as the flow is advected through the contraction. Keep in mind that the threshold used in this calculation is increased as the vortices strengthen in regions P1, P2 and P3. Furthermore, in volume P3, closest to the exit, the vortices frequently span the entire length of the measurement volume (see figure 4c), and
 $L$ is therefore a lower bound for the longest vortices.
Length and alignment of the coherent vortical structures. (a) Probability of the length of the coherent structures, for the three measurement regions. The dashed red curve is an approximate extrapolation to highlight that some of the vortices span the entire length of section P3 and must thereby be longer than the volume, due to clipping. (b) Time series of the length of the longest vortical structure within the volume P3 near the exit of the contraction. When the curve exceeds the horizontal line at  $L=90$ mm, the vortex spans the entire height of the volume. (c) Streamwise evolution of the p.d.f. of the orientation of coherent vortical structures. Only structures larger than 100 voxels are included, while the
 ${ | \omega |}$ thresholds in the three locations are varied: in region P1,
 ${ | \omega |}= 15$ s
 $^{-1}$ (
 ${ | \omega |}/S_{{max}} = 0.29$); in P2,
 ${ | \omega |}= 20$ s
 $^{-1}$ (
 ${ | \omega |}/S_{{max}} = 0.39$); and in P3,
 ${ | \omega |}= 40$ s
 $^{-1}$ (
 ${ | \omega |}/S_{{max}} = 0.78$). The inset plot highlights the orientation a short distance inside the contraction, where the orientation is closest to uniform, in subregions of P1, with streamwise ranges: for R1,
 $x=0\unicode{x2013}35.3$ mm; for R2,
 $x=35.5\unicode{x2013}70.7$ mm; and for R3,
 $x=70.7\unicode{x2013}106$ mm. The definition of the alignment angle
 $\theta$ is also shown. (d) The prevalence of streamwise orientation of the coherent structures along the contraction, quantified by the orientation coefficient
 $C_A$ (solid symbols) and peak value at 99.5 % probability (open symbols). The red, green and blue symbols correspond to measurements in volumes P1, P2 and P3, respectively. The streamwise coordinates from the entrance to the contraction are 18, 54, 90, 141, 175, 209, 256, 284 and 314 mm, which are normalized by the total length of the contraction
 $H=350$ mm. The arrows point to which axes correspond to the different data sets.

The extended time series of volumes allows us to quantify the prevalence of these coherent vortical structures. We identify them by looking at the time series of the longest structures within each volume in the bottom section, P3. A section of a typical time series of vortex structure lengths  $L$ is shown in figure 6(b). Over five separate experimental runs, we identified 795 structures, or on average
 $159 \pm 20$ separate structures per each continuous experimental run of 136 502 volumes. One characteristic structure from each run is shown in figure 5. The supplementary material includes a snapshot of one volume from each of the 795 long vortices, to give an indication of the variability in their morphology. Each structure is advected through the volume and is visible in
 ${\sim }600 \pm 75$ volumes, corresponding to 150 ms. For comparison, this time is 2.5 times the advection time scale computed by
 $T = \int _{t_{1}}^{t_{2}} {\rm d}t = \int _{x_{1}}^{x_{2}} \langle U(x) \rangle ^{-1}\, {{\rm d}\kern 0.06em x} = 60.5$ ms, which marks how long it takes a fluid element to be advected through the P3 volume at the mean local velocity. This hints at the vortices being longer than the height of P3, as one should arrive at a time
 $2T$ for a vortex of the same length as the volume, counting from the bottom tip of the vortex entering the volume until the top of the vortex leaves the bottom.
The large number of structures investigated also allows us to ascertain the symmetry of the turbulence in our experimental tunnel. The number of clockwise and anticlockwise coherent vortices should be identical for perfectly symmetric inlet conditions. This is indeed observed, with  $49/51$ % of the structures with each sign of the rotation direction. This suggests that the grid rotation protocol and the horizontal location of the grid rods do not bias the formation of the structures towards one sign, and rules out large-scale rotations in the incoming flow.
3.4. Vortex alignment
The coherent structures are best described by their extensive length and alignment with the streamwise mean strain. We see that the vorticity field is composed of discrete entities with vortex tubes oriented randomly. These vortex tubes get aligned with the  $x$-direction due to stretching by the strong mean strain, and thus increase the strength of
 $\omega _{x,rms}$. We see this trend for
 $\omega _{x,rms}$ in our earlier measurements within a much weaker smooth 2-D contraction with
 $C=2.5$, but obviously with a weaker amplification (Mugundhan et al. Reference Mugundhan, Pugazenthi, Speirs, Samtaney and Thoroddsen2020). Figure 6(c) shows how strongly the coherent vortices become aligned with the mean strain, with the peak in the probability concentrating at the angle
 $\theta = 0$, i.e.
 $\cos \theta = 1$. However, the height of the peak of the p.d.f. depends on the number of bins used, i.e. how well it is resolved near
 $\cos \theta = 1$. We calculate the p.d.f. using
 $\cos \theta$ to account for the range of allowed azimuthal space for each
 $\theta$. We propose here two quantitative measures independent of the bin size. First, we take the value of the probability when 99.5 % of cumulative distribution has been reached, starting at
 $\cos \theta = 0$. This is found by fitting the p.d.f.s with an inverted fifth-order polynomial (see the supplementary material for details). This value is plotted in figure 6(d). Second, we form an orientation coefficient
 $C_A$, which takes value zero for uniform orientation, and unity at fully aligned orientation, which is defined as twice the moment of the probability around
 $\cos \theta = 0.5$:
 \begin{equation} C_A = \int_0^{{\rm \pi}/2} 2 [ \cos\theta - 0.5 ]\,P( \cos\theta ) \,{\rm d}\theta. \end{equation}
Keep in mind that we have multiplied by a factor 2 to confine possible values of the orientation coefficient in the range  $C_A \rightarrow [-1,1]$. For perfect alignment in the streamwise direction,
 $C_A$ takes value 1, while for transverse alignment of the vortices (
 $\theta = {\rm \pi}/2$) this value becomes
 $-1$. Figure 6(d) shows the value of this coefficient and how it approaches unity travelling through the contraction.
3.5. Vortex alignment at different  $Re_{\lambda }$

We compare the alignment coefficients  $C_A$ and
 $P(99.5\,\%)$ for different
 $Re_{\lambda }$, ranging between approximately 100 and 200, to help to establish the generality of results. The variation in
 $Re_{\lambda }$ is achieved by changing the grid rotation protocol and the rotation rate of the active grid. In addition to the experimental conditions discussed above (which we refer to as set I), we perform experiments with the grid operated in synchronous mode at 240 rpm (set II) and in random mode at 300 rpm (set III). In the synchronous (sync) mode, alternate shafts are rotated at the same rotation rate but in opposite directions; for details, see Mugundhan et al. (Reference Mugundhan, Pugazenthi, Speirs, Samtaney and Thoroddsen2020) where it is referred to as Sync Mode 1. The experiments in the last set III are performed in a slightly weaker contraction with
 $C=13$. This contraction has length 260 mm and reduces the channel cross-section from
 $180 \times 180\ {\rm mm}^2$ to
 $50 \times 50\ {\rm mm}^2$. In set III, the flaps in the active grid that had holes in them are now replaced with solid flaps, in an attempt to increase the velocity fluctuations. The reduced length of the second contraction poses difficulty in accessing the lowest part of the contraction, hence we perform measurements in only two regions, P1* (
 $x=[4,110]$) and P2* (
 $x=[120,226]$), which are slightly different from P1 and P2 shown in figure 1. The random mode uses a cruise time between 0.5 to 1.5 times the period of one full rotation, before randomly changing the rotation direction, separately for each rod.
The important turbulent parameters measured on the centreline close to the inlet of the contractions are compared between the three cases in table 2. In comparison to set I, set II with the synchronous mode yields a lower  $Re_{\lambda } \sim 110$, whereas set III with the random mode and solid flaps yields
 $Re_{\lambda } \sim 150$. This is consistent with our previous experiments, where we have observed that synchronous modes result in lower
 $Re_{\lambda }$. Set III, on the other hand, results in lower
 $Re_{\lambda }$ compared to set I, in spite of an increase in the rotation rate by
 $\approx$40 %. This is due to the generation of turbulence with a smaller Taylor microscale. The length scale appears more dependent on the cruise time than the rotation speed. Note that the turbulence intensity increases by approximately 17 %. Lower
 $Re_{\lambda }$ with increase in rotation rate has been reported by Hearst & Lavoie (Reference Hearst and Lavoie2015), who study the effect of grid conditions of turbulence evolution in a wind tunnel.
Comparison of the turbulence quantities slightly inside the contraction, at  $x=5$ mm, obtained for the three sets of experimental conditions. Here, we use
 $C=16$ contraction in sets I and II, and
 $C=13$ contraction with solid flaps in set III experiments. All results in the earlier sections are from set I, and are repeated here for comparison. Refer to caption of table 1 for the nomenclature.

We illustrate the time evolution of a coherent vortical structure for set II with the lowest  $Re_{\lambda }$ in supplementary figure S6. We see the existence of coherent tubular structures as long as or longer than the measurement region, similar to those presented in figure 4, which was for the largest
 $Re_{\lambda }=192$. These structures evolve through the contraction and can be tracked in time. Examples of independent coherent structures occurring at totally different instants, one from each realization, are shown in supplementary figure S7. The structures appear in random time intervals with essentially equal probability for their rotation directions, with respect to the vertical streamwise direction, which are colour coded in the figures.
Comparison of the orientation parameters, for the two lower  $Re_{\lambda }$ values, is shown in figure 7. Comparing with figure 6(d), the preferential alignment of structures with the mean strain direction is clear in all three experimental sets. The minimum and maximum
 $Re_{\lambda }$ cases (sets I and II) show very similar streamwise variation of
 $C_A$ and
 $P(99.5\,\%)$ in the initial part of the contraction. Set II has slightly lower values of
 $P(99.5\,\%)$ towards the exit of the contraction compared to set I. Note that the contraction used in set III has a slightly larger contraction angle, but still shows variation similar to that in sets I and II. This shows clearly that the coherent structures exist, are similar in shape and size, and have preferential alignment to the same degree for
 $Re_{\lambda }$ in the range 110–190.
Comparison of the orientation coefficient  $C_A$ (solid symbols) and peak probability value at 99.5 % (open symbols) computed for the p.d.f.s of
 $\cos \theta$, for (a)
 $Re_{\lambda }=113$ in set II and (b)
 $Re_{\lambda }=192$ in set III. The red, green and blue symbols correspond to measurements in volumes P1, P2 and P3 in set II. The red and blue symbols correspond to measurement regions P1* and P2* in set III. The streamwise coordinates from the inlet are normalized by the corresponding total length of the contraction, i.e.
 $H=350$ mm for set II, and
 $H=260$ mm for set III. The axis labels corresponding to the different data sets are the same as in figure 6(d).

3.6. Vortex stretching
Vortices aligned with the mean strain should experience an increase in the local vorticity strength along their length, due to the stretching and near constancy of circulation. This is verified in figure 8(b), where the peak vorticity along the coherent vortices in P3 increases on average by approximately 65 %, much smaller than the increase in  $C$. The vortex strengths are also significantly larger than near the inlet, where the vortices are more randomly oriented. Figure 8(a) shows that the diameters of the typical coherent vortices are
 ${\approx }3\unicode{x2013}6$ mm. The above core sizes are determined by the equivalent cross-section of the structures above the cut-off
 ${ | \omega |} \geqslant 40\ {\rm s}^{-1}$, and their full size is
 ${\sim }50\,\%$ larger.
(a) Instantaneous vortical structure for  $Re_{\lambda }=192$, visualized in region P3 with threshold
 ${ | \omega |}= 40\ {\rm s}^{-1}$ (
 ${ | \omega |}/S_{{max}} = 0.78$), with three corresponding horizontal cuts through the vortex cores, showing their vorticity. (b) The streamwise variation of
 ${ | \omega |}$ in the cores of typical coherent vortices. In regions P1 and P2, the core strength is extracted from approximately 24 structures in each region. In P3, the vorticity is tracked along the longest coherent structures extending for the entire region, with the mean of a quadratic fit obtained from 48 strong structures. The red line indicates the local contraction ratio
 $c$, shown on the right-hand ordinate. The arrows point to which axes correspond to the curves.

4. Discussion and conclusions
Our time-resolved volumetric vorticity measurements are novel in this geometry, but comparison can be made with earlier velocity measurements. This showed increase in the streamwise  $u_{rms}$ after an initial decay, and steady increase in the transverse fluctuations consistent with the earlier hot-wire measurements (Uberoi Reference Uberoi1956; Hussain & Ramjee Reference Hussain and Ramjee1976; Tan-Atichat et al. Reference Tan-Atichat, Nagib and Drubka1980). In line with earlier hot-wire measurements, we confirm that Prandtl-like theoretical predictions of
 $u_{rms}$ do not hold for our large contraction ratio. Ertunç & Durst (Reference Ertunç and Durst2008) attributed the discrepancy between theory and measurements to hot-wire measurement errors and fluctuating inlet conditions. In contrast, our optical-based method employed here is not subject to those errors and still shows eventual growth in
 $u_{rms}$, thereby disputing this explanation.
Our time-resolved volumetric vorticity measurements have identified prominent coherent streamwise vortical structures dominating the turbulence in a rapid contraction. Even though these coherent structures can be anticipated from the basic conceptual picture of vortex stretching by the streamwise mean strain, their strength, extensive length and prevalence have not been characterized before. Such vortical structures have been reported and discussed qualitatively in some DNS studies of strained flows (Gualtieri & Meneveau Reference Gualtieri and Meneveau2010; Jang et al. Reference Jang, Sung and Krogstad2011; Lee et al. Reference Lee, Gylfason, Perlekar and Toschi2015). However, they do not quantify the characteristics of these structures. We believe that this study is the first to quantify these structures in great detail. Such quantification could be useful in the framework of structure-based models used in large eddy simulations of turbulent flows. The coherent vortices frequently span the entire length of the imaged volume P3, which is approximately four times the integral length scale of the incoming turbulent flow, and about 14 times the Taylor microscale.
We propose two quantitative ways of characterizing the alignment of the structures in the streamwise direction, i.e.  $P(99.5\,\%)$ and
 $C_A$. Both measures verify this strong alignment.
The typical diameter of the structures,  ${\sim }7$ mm, is approximately an order of magnitude larger than the characteristic size of the Burgers vortex
 $D=2\sqrt {4\nu /S_{max}} = 0.6$ mm, where viscous diffusion of vorticity is balanced by its enhancement by axial stretching, showing that these coherent structures are not viscous controlled. The streamwise velocity inside the vortex cores is only
 ${\sim }1\,\%$ slower than the mean, thereby not contributing much to the
 $u_{rms}$ fluctuations. The equal number of clockwise and anticlockwise coherent vortices suggests that they are not driven by large-scale rotation in the inlet flow into the tunnel.
Even though the coherent structures are the prominent vortical features in the flow, their volume is minimal. Using the watershed algorithm, we measure the volume of coherent structures with  ${ | \omega |} \geqslant 40\ {\rm s}^{-1}$ in each measurement volume. Figure 9(a) shows how this volume fraction changes with time, but looking at only the longest structures in each volume, they instantaneously occupy
 ${\approx }1.25\,\%$ of the total measurement volume in P3. Figure 9(b) shows the number of these structures that are likely to occupy any random volume. The histogram shows that it is more likely that there are one or two of these structures rather than none, destroying any notion of small-scale isotropy.
(a) The time series of the volume fraction  $V_{struct}/V_{total}$ of the coherent vortical structures, for
 $Re_{\lambda }=192$, in region P3 for one complete experimental realization (time between frames
 ${\rm d}t=0.25$ ms). Here,
 $V_{struct}$ is the total volume of all structures identified by
 ${ | \omega |} \geqslant 40\ {\rm s}^{-1}$ (
 ${ | \omega |}/S_{{max}} = 0.78$) and having a volume greater than 300 voxels, while
 $V_{total}$ is the total volume of the measurement region. The instantaneous coherent structures corresponding to the maximum volume fraction values marked by red dots are shown in supplementary figure S2. (b) Histogram of the number of coherent structures observed in each volume, for two different thresholds of structure volumes, of 500 and 800 voxels (144 and
 $230\ {\rm mm}^3$), corresponding to 0.17 % and 0.27 % of
 $V_{total}$.

What sets the size of these coherent structures, and how general are they? It also remains an open question whether these structures will persist at higher  $Re_{\lambda }$. The main results presented herein are for the largest possible
 $Re_{\lambda }\sim 200$ in our facility. We can, however, change the grid rotation protocol to lower
 $Re_{\lambda }$ to 110, which we have shown for the synchronous mode. The results at lower
 $Re_{\lambda }$ show the emergence of the same coherent structures, with very similar alignment statistics.
Future simultaneous measurements with multiple tomographic systems could identify the progenitors of these coherent structures and how the multitude of vortices are winnowed down to one or two near the outlet. Our results are in sharp contrast with the rapid distortion theory, where the turbulence is constructed from a myriad of intertwined modes, evolving independently. Here, the randomized inlet conditions lead to the emergence of one prominent mode.
Supplementary material
Supplementary material is available at https://doi.org/10.1017/jfm.2024.859.
Acknowledgements
We dedicate this work to the memory of Dr R.S. Pugazenthi (1974-2019).
Funding
This study was supported by King Abdullah University of Science and Technology (KAUST) under BAS/1/1352-01-01.
Declaration of interests
The authors report no conflict of interest.


 Open access

