



%20--%3e%3c!DOCTYPE%20svg%20PUBLIC%20'-//W3C//DTD%20SVG%201.0//EN'%20'http://www.w3.org/TR/2001/REC-SVG-20010904/DTD/svg10.dtd'%3e%3csvg%20version='1.0'%20id='Layer_1'%20xmlns='http://www.w3.org/2000/svg'%20xmlns:xlink='http://www.w3.org/1999/xlink'%20x='0px'%20y='0px'%20width='64px'%20height='64px'%20viewBox='5.5%20-3.5%2064%2064'%20enable-background='new%205.5%20-3.5%2064%2064'%20xml:space='preserve'%3e%3cg%3e%3ccircle%20fill='%23FFFFFF'%20fill-opacity='0'%20cx='37.785'%20cy='28.501'%20r='28.836'/%3e%3cpath%20fill='%23595959'%20d='M37.441-3.5c8.951,0,16.572,3.125,22.857,9.372c3.008,3.009,5.295,6.448,6.857,10.314%20c1.561,3.867,2.344,7.971,2.344,12.314c0,4.381-0.773,8.486-2.314,12.313c-1.543,3.828-3.82,7.21-6.828,10.143%20c-3.123,3.085-6.666,5.448-10.629,7.086c-3.961,1.638-8.057,2.457-12.285,2.457s-8.276-0.808-12.143-2.429%20c-3.866-1.618-7.333-3.961-10.4-7.027c-3.067-3.066-5.4-6.524-7-10.372S5.5,32.767,5.5,28.5c0-4.229,0.809-8.295,2.428-12.2%20c1.619-3.905,3.972-7.4,7.057-10.486C21.08-0.394,28.565-3.5,37.441-3.5z%20M37.557,2.272c-7.314,0-13.467,2.553-18.458,7.657%20c-2.515,2.553-4.448,5.419-5.8,8.6c-1.354,3.181-2.029,6.505-2.029,9.972c0,3.429,0.675,6.734,2.029,9.913%20c1.353,3.183,3.285,6.021,5.8,8.516c2.514,2.496,5.351,4.399,8.515,5.715c3.161,1.314,6.476,1.971,9.943,1.971%20c3.428,0,6.75-0.665,9.973-1.999c3.219-1.335,6.121-3.257,8.713-5.771c4.99-4.876,7.484-10.99,7.484-18.344%20c0-3.543-0.648-6.895-1.943-10.057c-1.293-3.162-3.18-5.98-5.654-8.458C50.984,4.844,44.795,2.272,37.557,2.272z%20M37.156,23.187%20l-4.287,2.229c-0.458-0.951-1.019-1.619-1.685-2c-0.667-0.38-1.286-0.571-1.858-0.571c-2.856,0-4.286,1.885-4.286,5.657%20c0,1.714,0.362,3.084,1.085,4.113c0.724,1.029,1.791,1.544,3.201,1.544c1.867,0,3.181-0.915,3.944-2.743l3.942,2%20c-0.838,1.563-2,2.791-3.486,3.686c-1.484,0.896-3.123,1.343-4.914,1.343c-2.857,0-5.163-0.875-6.915-2.629%20c-1.752-1.752-2.628-4.19-2.628-7.313c0-3.048,0.886-5.466,2.657-7.257c1.771-1.79,4.009-2.686,6.715-2.686%20C32.604,18.558,35.441,20.101,37.156,23.187z%20M55.613,23.187l-4.229,2.229c-0.457-0.951-1.02-1.619-1.686-2%20c-0.668-0.38-1.307-0.571-1.914-0.571c-2.857,0-4.287,1.885-4.287,5.657c0,1.714,0.363,3.084,1.086,4.113%20c0.723,1.029,1.789,1.544,3.201,1.544c1.865,0,3.18-0.915,3.941-2.743l4,2c-0.875,1.563-2.057,2.791-3.541,3.686%20c-1.486,0.896-3.105,1.343-4.857,1.343c-2.896,0-5.209-0.875-6.941-2.629c-1.736-1.752-2.602-4.19-2.602-7.313%20c0-3.048,0.885-5.466,2.658-7.257c1.77-1.79,4.008-2.686,6.713-2.686C51.117,18.558,53.938,20.101,55.613,23.187z'/%3e%3c/g%3e%3c/svg%3e)
%20--%3e%3c!DOCTYPE%20svg%20PUBLIC%20'-//W3C//DTD%20SVG%201.0//EN'%20'http://www.w3.org/TR/2001/REC-SVG-20010904/DTD/svg10.dtd'%3e%3csvg%20version='1.0'%20id='Layer_1'%20xmlns='http://www.w3.org/2000/svg'%20xmlns:xlink='http://www.w3.org/1999/xlink'%20x='0px'%20y='0px'%20width='64px'%20height='64px'%20viewBox='5.5%20-3.5%2064%2064'%20enable-background='new%205.5%20-3.5%2064%2064'%20xml:space='preserve'%3e%3cg%3e%3ccircle%20fill='%23FFFFFF'%20fill-opacity='0'%20cx='37.637'%20cy='28.806'%20r='28.276'/%3e%3cg%3e%3cpath%20fill='%23595959'%20d='M37.443-3.5c8.988,0,16.57,3.085,22.742,9.257C66.393,11.967,69.5,19.548,69.5,28.5c0,8.991-3.049,16.476-9.145,22.456%20C53.879,57.319,46.242,60.5,37.443,60.5c-8.649,0-16.153-3.144-22.514-9.43C8.644,44.784,5.5,37.262,5.5,28.5%20c0-8.761,3.144-16.342,9.429-22.742C21.101-0.415,28.604-3.5,37.443-3.5z%20M37.557,2.272c-7.276,0-13.428,2.553-18.457,7.657%20c-5.22,5.334-7.829,11.525-7.829,18.572c0,7.086,2.59,13.22,7.77,18.398c5.181,5.182,11.352,7.771,18.514,7.771%20c7.123,0,13.334-2.607,18.629-7.828c5.029-4.838,7.543-10.952,7.543-18.343c0-7.276-2.553-13.465-7.656-18.571%20C50.967,4.824,44.795,2.272,37.557,2.272z%20M46.129,20.557v13.085h-3.656v15.542h-9.944V33.643h-3.656V20.557%20c0-0.572,0.2-1.057,0.599-1.457c0.401-0.399,0.887-0.6,1.457-0.6h13.144c0.533,0,1.01,0.2,1.428,0.6%20C45.918,19.5,46.129,19.986,46.129,20.557z%20M33.042,12.329c0-3.008,1.485-4.514,4.458-4.514s4.457,1.504,4.457,4.514%20c0,2.971-1.486,4.457-4.457,4.457S33.042,15.3,33.042,12.329z'/%3e%3c/g%3e%3c/g%3e%3c/svg%3e)
Introduction
Acanthamoeba spp. are free-living amoebae (FLA) that opportunistically cause disease in humans, the most common of which is Acanthamoeba keratitis (AK), a sight-threatening infection of the cornea which is often associated with contact lens wear or corneal trauma and subsequent water exposure. Acanthamoeba is a diverse genus, with an unsatisfactory taxonomy based primarily on morphology of the dormant cyst stage (Page, Reference Page1988; Diehl et al., Reference Diehl, Paes and Rott2021). Acanthamoeba have historically been defined into 3 broad morphological groups I, II, and III (Pussard and Pons, Reference Pussard and Pons1977), delimited principally by the size ranges of the cysts (above, at, or below 18 µm, respectively) and the shape of the endocyst relative to the ectocyst. Less commonly, venation of the ectocyst known as reticulation, and non-morphological analyses such as isoenzyme electrophoretic pattern and pathogenicity in mice were deployed as taxonomic characters (Page, Reference Page1988).
An established approach for genotyping Acanthamoeba is based on comparison of partial or full-length 18S ribosomal RNA gene (18S rRNA gene) sequences (see Diehl et al., Reference Diehl, Paes and Rott2021). In this framework, genotypes are defined using a maximum sequence divergence threshold of 5%; thus, isolates sharing more than 95% 18S rRNA gene sequence identity are assigned to the same genotype (Fuerst and Booton, Reference Fuerst and Booton2020). This classification scheme was adapted from the work of Gast et al. (Reference Gast, Ledee, Fuerst and Byers1996), who originally defined sequence types as differing by at least 6%, corresponding to more than 134 nucleotide differences or an evolutionary distance exceeding 0.8% within their dataset of full-length sequences. Application of the 5% divergence threshold – to both partial and full-length 18S rRNA gene sequences – has led to the recognition of 24 Acanthamoeba genotypes (T1–T24) (see Diehl et al., Reference Diehl, Paes and Rott2021; Camacho-Aguilar et al., Reference Camacho-Aguilar, Gonzalez-Zuñiga, Gonzalez-Galaviz, Lares-Villa, Lares-Jiménez, Lozano Aguirre Beltrán, Otero-Ruiz and Rodriguez-Anaya2026).
Genotype T4 is the most frequently detected genotype in both environmental samples and approximately 84% of clinical cases of AK. However, several other genotypes, including T2, T3, T5, T6, T8, T9, T11, T13 and T15, have also been associated with AK (reviewed by Diehl et al., Reference Diehl, Paes and Rott2021). Phylogenetic analyses based on 18S rRNA gene sequences frequently show morphologically defined species dispersed across the resulting trees, indicating poor congruence between morphology-based taxonomy and molecular genotyping (Fuerst, Reference Fuerst2014). Consequently, morphological characteristics alone do not reliably reflect the evolutionary relationships among Acanthamoeba lineages.
As an opportunistic pathogen, elucidating the pathogenic potential of an isolate of Acanthamoeba spp. may have implications for patient treatment, and so accurate identification of amoebae has more than just taxonomic importance. The extent to which the different genotypes contribute to the variability observed in treatment outcomes remains unclear, as genotyping is not routinely performed on AK clinical isolates and genotypes have not been systematically linked to patient outcome data. The in vitro drug susceptibility of Acanthamoeba genotypes other than T4 is also rarely reported, despite some evidence suggesting that treatment outcomes may vary according to genotype (Diehl et al., Reference Diehl, Paes and Rott2021). It would therefore be highly beneficial to fully characterize the effect of different Acanthamoeba genotypes on treatment outcome and drug susceptibility. Comparison of whole-genome sequences would assist identification of genetic determinants of drug-susceptibility phenotypes and predictors of treatment outcome (e.g. virulence markers) as these are currently largely unknown. Development of high-quality reference genomes for representatives of all Acanthamoeba genotypes, especially for the less studied non-T4 genotypes, is therefore needed for any rigorous assessment of the relationship between taxonomic groupings within the genus. A better understanding of this diversity has potential ramifications for clinical management of AK and would permit more thorough investigation of links between genotype and treatment outcome. We describe here the first nuclear and mitochondrial genome assemblies for an Acanthamoeba isolate of genotype T6.
Materials and methods
Origin of GP39
Acanthamoeba isolate GP39 was derived from a clinical corneal scrape sample submitted to the Diagnostic Parasitology Laboratory (DPL) at the London School of Hygiene & Tropical Medicine for investigation of AK. For culture, spun deposit from the clinical sample was inoculated onto a Page’s non-nutrient agar (NNA) plate seeded with live Escherichia coli (E. coli) (NCTC 10418/ATCC® 10536 Selectrol, TCS Biosciences, UK) and incubated at 33°C. The plate was observed daily for growth. Following emergence of trophozoites and subsequent formation of cysts, the isolate was morphologically identified based on published taxonomic keys (Page, Reference Page1976, Reference Page1988), using cyst morphological characteristics and growth. After reporting the result, prior to this study, the sealed plate was stored at 4°C.
Revival, cloning and morphological characterization
A monoxenic subculture – GP39 – of the clinical isolate was established, and trophozoites were allowed to proliferate until encystment. Single cysts were manually isolated using a sterile loop under microscopic manipulation and transferred to fresh NNA plates. These plates with single cysts were covered with a suspension of E. coli and incubated at 33°C until trophozoites emerged, thereby establishing clonal lines. One of these resulting clones, designated GP39-C1, is the subject of this report. To capture morphological characteristics, a monoxenic culture of GP39-C1 was subcultured to 3 NNA plates and allowed to encyst. The cysts were suspended into Page’s saline and examined microscopically. Cyst characteristics (width, ectocyst shape, endocyst shape) were recorded with a Leica DMRB microscope and calibrated JENOTPIK GRYPHAX® (JENOPTIK GmbH, Jena, Germany) camera and software.
GP39-C1 was axenised to remove contaminating DNA from the E. coli food source present in the monoxenic culture. For axenisation, trophozoites from monoxenic subcultures of GP39-C1 were transferred firstly onto an NNA plate seeded with heat-killed E. coli, then subsequently moved into peptone–yeast–glucose (PYG) medium. Once established in axenic liquid medium, the clone was further subcultured to reduce residual dead bacteria in the medium.
DNA extraction
For ONT (Oxford Nanopore Technologies™, Oxford, UK) whole-genome sequencing (WGS), GP39-C1 DNA was extracted from pellets harvested from 50 mL PYG trophozoite cultures (approximately 540 000 cells mL−1). High molecular-weight DNA was extracted using a Dynabeads™ genomic DNA kit (Invitrogen/Thermo-Fisher, UK) using the manufacturer’s protocol. Genomic DNA was quantified at 55 ng μL−1 using Qubit™ fluorometry (Invitrogen Q33230). For Illumina WGS, GP39-C1 DNA was extracted from pellets harvested from 4 mL of the GP39-C1 trophozoite culture (approximately 540 000 cells mL−1). DNA extraction was performed using the Qiagen™ DNA mini kit (Qiagen, Manchester UK), according to the manufacturer’s instructions. DNA was quantified at 61 ng μL−1 via Qubit™ fluorometry.
Genotyping PCR and sequencing
18S rRNA gene PCR was performed using 10 μM each of primers SSU1 (5’-GACTGGTTGATCCTGCCAGTAG) and SSU2 (5’-TCCTGATCCCTCCGCAGGTTCAC) (Weekers et al., Reference Weekers, Gast, Fuerst and Byers1994) in HS VeriFi 2x mix (PCR Biosystems® London, UK) in a 25 μL reaction. Amplification was carried out on a Tetrad thermocycler (Bio-Rad, Watford, UK) using conditions specified by PCR Biosystems (95°C for 60 s (hot start initiation), followed by 30 cycles of 95°C for 15s, 60°C for 15 s and 72°C for 90 s).
The full-length 18S rRNA gene amplicons were subject to Oxford Nanopore sequencing with SQKNBD114.96 chemistry on an ONT MinION™ Mk1B R10.4.1 flow cell, according to the manufacturer’s protocol. The 18S rRNA gene sequence data from GP39-C1 were aligned with 18S rRNA gene sequences for the suggested representative genotypes T1-23, including subtypes of T4 (T4A-H), obtained from the National Centre for Biotechnology Information (NCBI) Genbank® (Sayers et al., Reference Sayers, Bolton, Brister, Canese, Chan, Comeau, Connor, Funk, Kelly, Kim, Madej, Marchler-Bauer, Lanczycki, Lathrop, Lu, Thibaud-Nissen, Murphy, Phan, Skripchenko and Sherry2022) using MUSCLE (Edgar, Reference Edgar2004). A Maximum Likelihood (ML) phylogenetic tree using 1000 bootstrap replicates was generated using the Tamura-Nei model in MEGA 11 (Tamura et al., Reference Tamura, Stecher and Kumar2021).
The extracted genomic DNA was prepared for MinION™ WGS analysis using the Ligation Sequencing Kit V14 SQK-LSK114 (ONT) following the manufacturer’s protocol. MinION™ sequencing was carried out in-house using MinKNOW (version 22.10.7). Illumina sequencing was outsourced to Genewiz (Genewiz GmbH, Leipzig, Germany).
Preparation of sequence reads for assembly
ONT base-calling was performed with GUPPY (Version 6.3.8) (Oxford Nanopore Technologies) using ‘super-high accuracy’ models. Porechop (https://github.com/rrwick/Porechop) was then used to trim ONT sequencing adapters from the reads. Yacrd (‘yet another chimeric read detector’) (v 1.0.0) (Marijon et al., Reference Marijon, Chikhi and Varré2020) was used to detect and extract chimeric reads that may have been generated during library preparation and sequencing. Kraken2 and Krakentools (Lu et al., Reference Lu, Rincon, Wood, Breitwieser, Pockrandt, Langmead, Salzberg and Steinegger2022) were employed to classify and subsequently extract any contaminating reads. This was done by excluding the reads classified into the following NCBI TaxIDs: 2 (Archaea), 2157 (Bacteria), 10239 (Viruses), 4751 (Fungi) and 9443 (Primates). As well as any lineages within these groups. 12.32 Gb of reads remained after this process. For the short reads, sequencing adapters were trimmed using fastp (v 0.23.4) (Chen, Reference Chen2023); then the reads were error-corrected using the error correction module of SPAdes (v 3.15.5) (Prjibelski et al., Reference Prjibelski, Antipov, Meleshko, Lapidus and Korobeynikov2020). The resulting FASTQ files were used for all polishing stages.
De novo assembly
Three genome assemblies were produced using 3 different pipelines to compare the output. During development of all pipelines, after each stage, BUSCO (Benchmarking Universal Single-Copy Orthologous Groups) analysis (v 5.4.7, database: eukaryota_odb10) (Manni et al., Reference Manni, Berkeley, Seppey, Simão and Zdobnov2021) was used to assess the impact on assembly metrics to ensure improvement.
Pipeline 1 – MaSuRCA
The first sequencing pipeline used the Maryland Super Cabog Assembler (MaSuRCA) (Zimin et al., Reference Zimin, Puiu, Luo, Zhu, Koren, Marçais, Yorke, Dvořák and Salzberg2017) and used the prepared ONT and NGS reads described above as input. The output assembly was then expanded using Ntlink (Coombe et al., Reference Coombe, Warren, Wong, Nikolic and Birol2023) and finally structural errors were corrected using Tigmint (Coombe et al., Reference Coombe, Warren, Wong, Nikolic and Birol2023).
Pipeline 2 – Flye ‘raw’
Initial de novo assembly of the genome was performed using Flye (v2.9.2) (Kolmogorov et al., Reference Kolmogorov, Yuan, Lin and Pevzner2019) with the predicted error rate of the reads set to 20% using the command-line argument ‘–nano-raw, and 5 rounds of polishing were performed. Hybrid polishing of the assembly was performed with HyPo (v1.0.3) (Kundu et al., Reference Kundu, Casey and Sung2019) using corrected Illumina reads. At this point, contigs belonging to the mitochondrion were detected with NCBI BLASTn (Sayers et al., Reference Sayers, Bolton, Brister, Canese, Chan, Comeau, Connor, Funk, Kelly, Kim, Madej, Marchler-Bauer, Lanczycki, Lathrop, Lu, Thibaud-Nissen, Murphy, Phan, Skripchenko and Sherry2022), as performed by Matthey-Doret et al. (Reference Matthey-Doret, Colp, Escoll, Thierry, Moreau, Curtis, Sahr, Sarrasin, Gray, Franz Lang, Archibald, Buchrieser and Koszul2022). The matching contigs were removed using Seqtk (v1.3) (https://github.com/lh3/seqtk) from the nuclear genome contigs and further assembled separately to prevent erroneous integration into nuclear scaffolds. Contig expansion of the nuclear genome was then performed using NtLink (v1.3.9) (Coombe et al., Reference Coombe, Warren, Wong, Nikolic and Birol2023). Initial de novo scaffolding was performed using 2 rounds of ARCS (v1.2.5) (Yeo et al., Reference Yeo, Coombe, Warren, Chu and Birol2018). Insertions and deletions (Indels) were detected using Sniffles (v2.2) (Smolka et al., Reference Smolka, Paulin, Grochowski, Horner, Mahmoud, Behera, Kalef-Ezra, Gandhi, Hong, Pehlivan, Scholz, Carvalho, Proukakis and Sedlazeck2024) and corrected using SnifflesVScorrector.py (custom script MH, LSHTM). The homology-based scaffolding software RagTag was then used to scaffold the genome using the MaSuRCA assembly for GP39-C1 generated by Pipeline 1 as reference, to improve contiguity. TGSgapcloser (v 1.2.1) (Xu et al., Reference Xu, Guo, Gu, Wang, Zhang, Peters, Fan, Liu, Xu, Deng and Zhang2020) was used to fill gaps in the assembly with ONT reads which spanned the gaps, after each round of scaffolding. A round of Pilon (v 1.24) polishing (Walker et al., Reference Walker, Abeel, Shea, Priest, Abouelliel, Sakthikumar, Cuomo, Zeng, Wortman, Young and Earl2014) was also performed using the Illumina reads after each scaffolding and gap-closing step.
Pipeline 3 – Flye ‘corr’
Pipeline 3 was performed in the same manner as Pipeline 2, with the exception that the expected error in the ONT reads was set to 3% using the argument ‘–nano-corr’ when running Flye.
Genome annotation
Genomes were annotated using MetaEuk using the protein sets for the Acanthamoeba castellanii C3 and Neff assemblies from Matthey-Doret et al. (Reference Matthey-Doret, Colp, Escoll, Thierry, Moreau, Curtis, Sahr, Sarrasin, Gray, Franz Lang, Archibald, Buchrieser and Koszul2022) and the UniProt database as input (Bateman et al., Reference Bateman, Martin, Orchard, Magrane, Adesina, Ahmad, Bowler-Barnett, Bye-A-Jee, Carpentier, Denny, Fan, Garmiri, Gonzales, Hussein, Ignatchenko, Insana, Ishtiaq, Joshi, Jyothi, Kandasaamy, Lock, Luciani, Luo, Lussi, Marin, Raposo, Rice, Santos, Speretta, Stephenson, Totoo, Tyagi, Urakova, Vasudev, Warner, Wijerathne, Yu, Zaru, Bridge, Aimo, Argoud-Puy, Auchincloss, Axelsen, Bansal, Baratin, Batista Neto, Blatter, Bolleman, Boutet, Breuza, Gil, Casals-Casas, Echioukh, Coudert, Cuche, de Castro, Estreicher, Famiglietti, Feuermann, Gasteiger, Gaudet, Gehant, Gerritsen, Gos, Gruaz, Hulo, Hyka-Nouspikel, Jungo, Kerhornou, Mercier, Lieberherr, Masson, Morgat, Paesano, Pedruzzi, Pilbout, Pourcel, Poux, Pozzato, Pruess, Redaschi, Rivoire, Sigrist, Sonesson, Sundaram, Sveshnikova, Wu, Arighi, Chen, Chen, Huang, Laiho, Lehvaslaiho, McGarvey, Natale, Ross, Vinayaka, Wang and Zhang2025). Notably, A. castellanii Neff is a controversial designation which has now been reassigned as A. terricola (Neff) Corsaro et al. (Reference Corsaro, Mrva, Colson and Walochnik2024)
Mitochondrial genome
The mitochondrial genome was assembled from contigs extracted from Pipeline 3 using CAP3 (v 10.2011) (Huang and Madan, Reference Huang and Madan1999); the assembly was polished using Pilon with the corrected short reads. The final assembly was aligned with other Acanthamoeba mitochondrial sequences to annotate gene locations and confirm ORF functionality using MEGA 11.
Orthology and synteny analysis
Synteny plots were generated using JupiterPlot (https://github.com/JustinChu/JupiterPlot).
Gap-excluded divergence between genome assemblies was calculated using the Python script ‘04_compute_seq_divergence.py’ as used by Matthey-Doret et al. (Reference Matthey-Doret, Colp, Escoll, Thierry, Moreau, Curtis, Sahr, Sarrasin, Gray, Franz Lang, Archibald, Buchrieser and Koszul2022). Orthologous sequences for detailed comparison were identified using a custom BLASTn database (Sayers et al., Reference Sayers, Bolton, Brister, Canese, Chan, Comeau, Connor, Funk, Kelly, Kim, Madej, Marchler-Bauer, Lanczycki, Lathrop, Lu, Thibaud-Nissen, Murphy, Phan, Skripchenko and Sherry2022) extracted from the genome assemblies using Seqtk (v1.3) (https://github.com/lh3/seqtk).
Results
Morphological description and growth characteristics
Prior to the widespread use of molecular analyses, morphological classification of Acanthamoeba was largely based on the keys of Page (Reference Page1976, Reference Page1988), where shape/form, size, and growth characteristics formed the taxonomic framework for the genus. In vitro culture of the clinical sample from which the isolate GP39 originated produced Acanthamoeba trophozoites that formed round cysts which, according to Page’s keys, indicated A. palestinensis or A. culbertsoni. Page states that A. palestinensis will not grow at 37°C; hence, to differentiate between these species, comparison of subculture growth following incubation at 28°C and 37°C was carried out. The clinical isolate did not grow at 37°C and, based on morphology and growth temperature characteristics, was classified as most consistent with A. palestinensis.
Two clones were isolated from GP39: GP39-C1 and GP39-C2. GP39-C1 reached a higher cell density than GP39-C2 and was therefore selected for further analysis. A cluster of typical GP39-C1 cysts is shown in Figure 1. GP39-C1 cysts comprised a mostly round, occasionally polygonal, endocyst (Figure 1A) and a close-fitting smooth (Figure 1B) or lightly crinkled (Figure 1C) ectocyst. The average cyst (n = 120) diameter was 13.466 μm (95% CI: 13.141–13.791; range: 9.330–19.014 μm) and would therefore place GP39-C1 in morphological group III as defined by Pussard and Pons (Reference Pussard and Pons1977). Variability in cyst size is more apparent in Figure 2, where a differential interference contrast microscopy image shows some of the larger cysts and also some slightly more polygonal-shaped cysts.
Brightfield microscopy of representative GP39-C1 cyst morphology. Representative cysts of the clonal isolate GP39-C1 grown on non-nutrient agar following encystment. Images illustrate the range of cyst morphologies observed, including (A) a predominantly round endocyst, (B) a close-fitting smooth ectocyst and (C) a lightly crinkled ectocyst. These morphological features, together with the inability of the isolate to grow at 37°C, were most consistent with the published description of Acanthamoeba palestinensis, although species assignment based on morphology alone remains uncertain. Images were acquired using a Nikon TiE2 microscope fitted with a Hamamatsu OrcaFlash camera at × 400 magnification.

Differential interference contrast (DIC) microscopy showing variation in GP39-C1 cyst morphology. DIC image illustrating the natural variation in cyst size and endocyst morphology within clone GP39-C1. Most cysts possess a rounded endocyst, although occasional polygonal forms are present. The mean cyst diameter was 13.47 µm (95% CI: 13.14–13.79; range: 9.33–19.01 µm; n = 120), consistent with morphological group III according to the classification of Pussard and Pons (Reference Pussard and Pons1977). Image acquired using a Leica DMRB microscope with a calibrated Jenoptik Gryphax camera.

The cyst characteristics of the clone GP39-C1 closely matched those of the parent DPL isolate from which GP39 was derived, i.e. the shape and size range of GP39-C1 cysts were consistent with Page’s descriptions of A. palestinensis and A. culbertsoni (both morphological group III, see Page, Reference Page1976, Reference Page1988). Furthermore, GP39-C1 did not grow at 37°C, which is described as differentiating for A. palestinensis. As we have no evidence to support the presence of other ‘species/genotypes’ in the original patient sample and the cyst characteristics of GP39 are retained by the clone, this implies that GP39-C1 is a clone of the dominant Acanthamoeba lineage present in the original clinical sample and is therefore likely to be the cause of the patient’s keratitis.
Phylogenetic evidence for placement of GP39-C1 in genotype T6
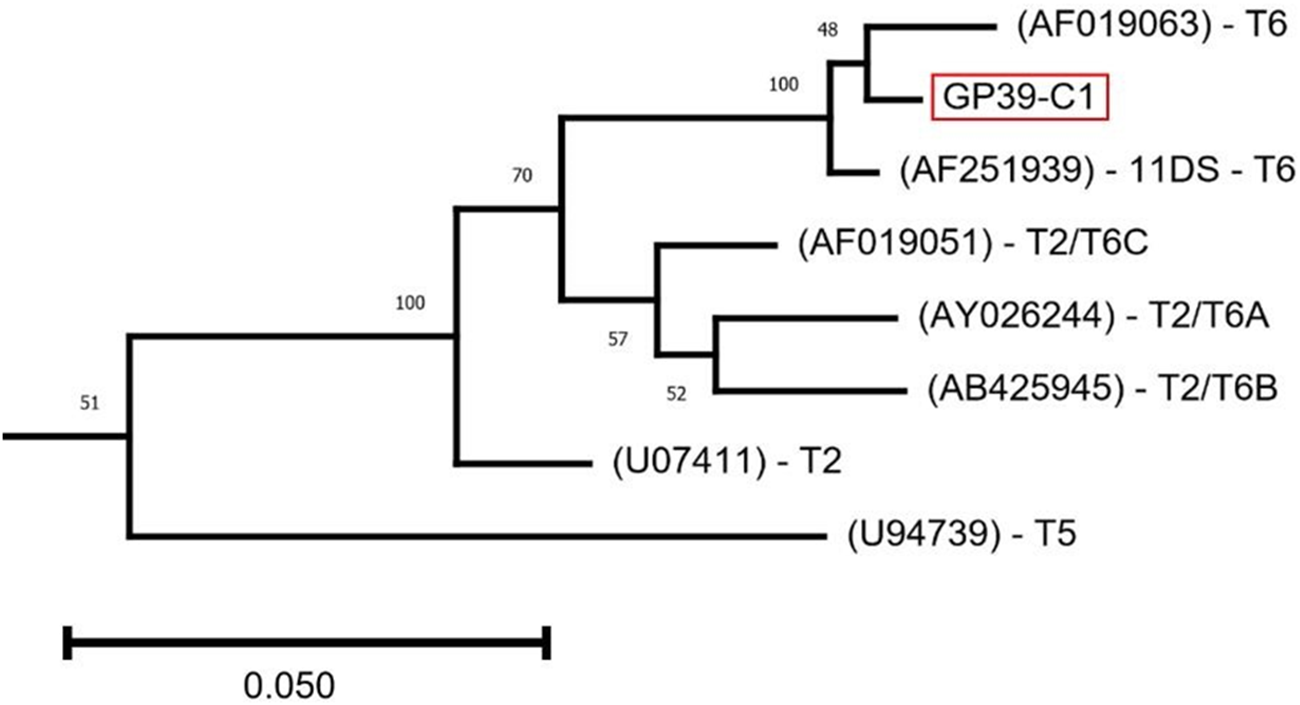
An ML tree was constructed to visualize the placement of the GP39-C1 18S rRNA gene sequence. For visual clarity, Figure 3 shows an extract of the tree, demonstrating the placement of GP39-C1 in the T2/T6 supergroup (Fuerst and Booton, Reference Fuerst and Booton2020).
Maximum-likelihood phylogeny of full-length 18S rRNA gene sequences showing placement of GP39-C1 within genotype T6. The phylogeny was inferred from a MUSCLE alignment of full-length 18S rRNA gene sequences using the Tamura–Nei substitution model with 1000 bootstrap replicates implemented in MEGA11. For clarity, only the T2/T6 clade is shown; the complete phylogeny including representatives of all recognized genotypes is provided in Supplementary Figure S2. GP39-C1 clusters with the genotype T6 isolates Acanthamoeba palestinensis 2802 (AF019063) and isolate 11DS (AF251939), supporting its assignment to genotype T6. Branch lengths represent evolutionary distance. Reference isolates are labelled by GenBank accession number and genotype designation.

The GP39-C1 sequence groups with that of both ‘2802’, a group III/T6 Acanthamoeba palestinensis isolate (GenBank accession: AF019063) and the group II/T6 Acanthamoeba isolate ‘11DS’ (GenBank accession: AF251939), described by Walochnik et al. (Reference Walochnik, Haller-Schober, Kölli, Picher, Obwaller and Aspöck2000). Both GP39 and 11DS were isolated from infected corneal samples and are classified as genotype T6, which is rarely implicated in corneal infection. Walochnik et al. (Reference Walochnik, Haller-Schober, Kölli, Picher, Obwaller and Aspöck2000) characterized 11DS morphologically as A. hatchetti, which belongs to morphological group II and is defined by 3- to 4-sided endocyst shapes (Page, Reference Page1988), quite distinct from the morphological description of A. palestinensis and of GP39-C1, which is group III.
The identity values for the full-length 18S rRNA sequence of GP39-C1 derived from amplicon sequencing are shown in Table 1. Also evaluated are type-sequence comparators, A. palestinensis (2802) AF019063 mentioned above (T6), A. palestinensis (Reich) U07411 (T2) and the 2 copies of the 18S rRNA gene extracted from the C3 and Neff assemblies published by Matthey-Doret et al. (Reference Matthey-Doret, Colp, Escoll, Thierry, Moreau, Curtis, Sahr, Sarrasin, Gray, Franz Lang, Archibald, Buchrieser and Koszul2022), all genotype T4. These pairwise 18S rRNA gene sequence comparisons support the finding in the phylogenetic tree that the most plausible genotype assignment of GP39-C1 is T6, as it was highly similar to the genotype T6 reference sequence (AF019063) with 98.26% identity, but also shows significant similarity to the T2 type sequence (U07411) at 96.02% sequence identity. This indicates the need for improved resolution among genotypes within the ‘T2-T6 supergroup’. The C3 and Neff isolates, both belonging to genotype T4, shared high sequence identity with one another, showing between 97.5 and 97.99% identity depending on the copies compared.
Per cent identity matrix of type-culture 18S rRNA sequences for T2, T6 compared with those from C3, Neff and GP39-C1

Table 1 Long description
Percent identity values compare 18S rRNA sequences across seven IDs: U07411.1, T2; GP39-C1; AF019063.1, T6; C3 18S Copy 2, T4; Neff 18S Copy 2, T4; C3 18S Copy 1, T4; and Neff 18S Copy 1, T4. Diagonal cells are 100 for each ID compared with itself. U07411.1, T2 has 96.02 with GP39-C1 and 95.26 with AF019063.1, T6, and ranges from 92.72 to 93.12 with the four T4 copies. GP39-C1 has 98.26 with AF019063.1, T6, and ranges from 91.83 to 91.96 with the four T4 copies. AF019063.1, T6 ranges from 91.26 to 91.60 with the four T4 copies. Among T4 copies, C3 18S Copy 2 has 97.99 with Neff 18S Copy 2, 99.82 with C3 18S Copy 1, and 97.72 with Neff 18S Copy 1. Neff 18S Copy 2 has 97.68 with C3 18S Copy 1 and 99.2 with Neff 18S Copy 1, and C3 18S Copy 1 has 97.5 with Neff 18S Copy 1.
Genome assembly pipeline outputs
The genome assembly pipelines used in this study produced 3 genome assemblies with different strengths and weaknesses. Of the GP39-C1 assemblies, Pipeline 1 (using MaSuRCA) produced the fewest scaffolds and the smallest genome and was the only assembly method that contained zero gaps. The BUSCO analysis annotated 84.3% of the expected genes, of which 20.8% were duplicated. Pipeline 2 (Flye with the ‘–nano-raw’ command) produced the fewest duplicated genes, comprising 7.1% of the loci identified in the BUSCO analysis, approximately 9 times more than in the C3 assembly by Matthey-Doret et al. (Reference Matthey-Doret, Colp, Escoll, Thierry, Moreau, Curtis, Sahr, Sarrasin, Gray, Franz Lang, Archibald, Buchrieser and Koszul2022). Pipeline 3 (Flye run with the ‘–nano-corr’ command) was the assembly with the largest proportion of expected genes being identified by BUSCO analysis, 89.1%; however, there was a marked redundancy, with 57.3% of these being duplicated. As a result of this high rate of duplication, the Pipeline 3 assembly was almost 2 times the size of the assemblies produced by the other 2 pipelines. All the assemblies had an N50 over 1 Mb. Table 2 and Figures 4 and 5 summarize the differences in the outputs.
Comparison of genome completeness between GP39-C1 genome assemblies. BUSCO genome-mode assessment of the 3 GP39-C1 genome assemblies generated using the MaSuRCA, Flye_raw and Flye_corr assembly pipelines, together with the published C3 and Neff assemblies from Matthey-Doret et al. (Reference Matthey-Doret, Colp, Escoll, Thierry, Moreau, Curtis, Sahr, Sarrasin, Gray, Franz Lang, Archibald, Buchrieser and Koszul2022). Analysis was performed using the eukaryota_odb10 database with MetaEuk as the exon prediction method. Bars show the proportions of complete (single-copy and duplicated), fragmented and missing BUSCO genes. Flye_corr produced the highest completeness, whereas Flye_raw showed the lowest proportion of duplicated BUSCOs. Plots were generated using the BUSCO generate_plot.Py utility.

Comparison of annotated protein set completeness. BUSCO protein-mode assessment of the annotated protein sets generated from the 3 GP39-C1 genome assemblies compared with the published C3 and Neff protein sets. Analysis was performed using the eukaryota_odb10 database. Annotation increased the proportion of complete BUSCOs in all assemblies relative to genome-mode analysis, with the Flye_corr protein set achieving 94.1% complete BUSCOs, approaching the completeness of the published C3 reference genome. Plots were generated using the BUSCO generate_plot.Py utility.

Figure 5 Long description
A stacked horizontal bar graph titled, BUSCO Assessment Results. Legend lists, Complete left parenthesis C right parenthesis and single copy left parenthesis S right parenthesis, Complete left parenthesis C right parenthesis and duplicated left parenthesis D right parenthesis, Fragmented left parenthesis F right parenthesis, Missing left parenthesis M right parenthesis. The horizontal axis label is, percent B U S C O s, with tick labels 0, 20, 40, 60, 80, 100. The vertical axis lists five categories: C M D underscore C 3 underscore proteins; C M D underscore Neff underscore proteins; corr underscore pipeline underscore proteins; masurca underscore pipeline underscore proteins; raw underscore pipeline underscore proteins. Each bar contains an internal text label. C M D underscore C 3 underscore proteins: C colon 244, S colon 238, D colon 6, F colon 5, M colon 6, n colon 255. C M D underscore Neff underscore proteins: C colon 246, S colon 230, D colon 16, F colon 2, M colon 7, n colon 255. corr underscore pipeline underscore proteins: C colon 240, S colon 89, D colon 151, F colon 5, M colon 10, n colon 255. masurca underscore pipeline underscore proteins: C colon 225, S colon 172, D colon 53, F colon 17, M colon 13, n colon 255. raw underscore pipeline underscore proteins: C colon 222, S colon 208, D colon 14, F colon 16, M colon 17, n colon 255.
Assembly summary statistics

Table 2 Long description
Four assemblies are compared across Pipeline 1, MaSuRCA, Pipeline 2, Flye Raw, Pipeline 3, Flye Corr, and C3 using completeness percentages, assembly size, counts, N50, and gaps. Single copy percent is 63.5 for Pipeline 1, 75.3 for Pipeline 2, 31.8 for Pipeline 3, and 77.3 for C3. Duplicated percent is 20.8 for Pipeline 1, 7.1 for Pipeline 2, 57.3 for Pipeline 3, and 0.8 for C3. Fragmented percent is 9.0 for Pipeline 1, 9.8 for Pipeline 2, 6.3 for Pipeline 3, and 12.5 for C3, and Missing percent is 6.7, 7.8, 4.6, and 9.4 respectively. Size in megabases is 58.5 for Pipeline 1, 60.8 for Pipeline 2, 110.2 for Pipeline 3, and 46.3 for C3. Contigs count is 86 for Pipeline 1, 802 for Pipeline 2, 581 for Pipeline 3, and 227 for C3, and Scaffolds count is 85, 673, 438, and 227 respectively. Scaffold N50 in megabases is 1.2 for Pipeline 1, 1.2 for Pipeline 2, 1.8 for Pipeline 3, and 1.4 for C3, and Gaps percent is 0.00, 0.017, 0.014, and 0.00 respectively.
18S rRNA gene sequences were searched for in the GP39-C1 genome assemblies; the sequences found in this search were compared to the one derived from amplicon sequencing (see Table 2 and Figure 3). Three distinct variants were found in both of the GP39-C1 assemblies shared. One variant from the Pipeline 3 assembly was 100% identical to the amplicon-derived 18S sequence used in downstream phylogenetic analyses shown in Figure 3 and showed very high similarity to the corresponding Pipeline 1 copy (98.20–99.39% identity across comparisons). The most divergent variants were not consistently reconstructed between assembly methods. Additional copies within both assemblies exhibited intragenomic variation, with pairwise identities ranging from 97.06% to 99.65%. However, the most divergent variant (Variant 3) showed reduced concordance between assemblies (97.06% identity) relative to the other copies, suggesting uncertainty in its reconstruction. Isolates of Acanthamoeba containing 3 allelic variants of the 18S rRNA gene have been reported before (Fuerst and Booton, Reference Fuerst and Booton2020), and these variants may reflect genuine intragenomic heterogeneity within the ribosomal DNA array. However, assembly artefacts associated with repetitive rDNA regions cannot be excluded. Given the perfect recovery of the amplicon-derived sequence in 1 assembly and its near-identical representation in the second, this sequence was considered the most robust and was therefore selected as the reference 18S sequence for phylogenetic analyses.
When the protein mode of BUSCO was used to assess the protein sets output by MetaEuk annotation, there was an increase in the number of complete genes in all assemblies, and the Pipeline 3 assembly showed a complete BUSCO score of 94.1% (240/255 genes searched), close to that of the C3 assembly, which has 95.7% (Figure 5).
Synteny
Due to time limitations, it was not possible to assess every variant of these genomes for all downstream investigations; hence, we selected the MaSuRCA assembly for the majority of the analyses performed because the smaller number of scaffolds made synteny comparisons easier to interpret and display. Figure 6 presents the synteny between the C3 genome assembly and the GP39-C1 assembly, which appears to be relatively low compared to the closer synteny demonstrated between the C3 and Neff assemblies by Matthey-Doret et al. (Reference Matthey-Doret, Colp, Escoll, Thierry, Moreau, Curtis, Sahr, Sarrasin, Gray, Franz Lang, Archibald, Buchrieser and Koszul2022).
Genome-wide synteny between GP39-C1 and the genotype T4 C3 reference genome. JupiterPlot comparison between the GP39-C1 MaSuRCA assembly and the chromosome-scale C3 genome assembly. Coloured blocks on the left represent GP39-C1 scaffolds and grey blocks on the right represent C3 scaffolds. Connecting ribbons indicate syntenic regions between assemblies. Only scaffolds exceeding 500 kb were included, using a minimum syntenic block size of 5 kb and a mapping quality threshold (MAPQ) of 50. Compared with previously reported T4 genome comparisons, relatively limited synteny is observed between GP39-C1 (T6) and C3 (T4), consistent with substantial genome divergence between these genotypes.

Figure 6 Long description
A chord diagram presents genome-wide synteny between GP39-C1 scaffolds and C3 scaffolds. The outer ring is divided into two groups of segments. The GP39-C1 scaffolds are represented by distinctly colored segments and the C3 scaffolds are represented by grey segments. The two groups of segments are positioned on opposite sides of the ring. Ribbons connect segments from the GP39-C1 group to segments in the C3 group, indicating shared syntenic regions, which are homologous blocks present in both assemblies. Ribbon thickness varies across connections, with some ribbons appearing notably thicker than others, indicating differences in the extent of shared sequence between specific scaffold pairs. Several scaffold segments on the GP39-C1 side carry visible short numeric or alphanumeric labels along the ring. The C3 side segments are unlabeled grey blocks. The ribbons form a few concentrated bundles in certain areas of the diagram, while other scaffold segments show sparse or thin ribbon connections. The overall pattern of ribbons shows that some GP39-C1 scaffolds share stronger connections with specific C3 scaffolds, while many scaffold pairs show only thin or minimal ribbon connections. No axes or units are present, as is standard for chord diagrams of this type. The perimeter segments represent individual scaffolds from each assembly and ribbon connections represent syntenic blocks identified between those scaffolds.
In addition to the C3 and Neff assemblies, GP39-C1 was compared to a more closely related comparator genome. The closest comparator assembly available was an assembly from an isolate of genotype T2, closely related to T6, as shown in Figure 3 and Supplementary Figure S2.
The T2 assembly was originally deposited in GenBank under the name of ‘Acanthamoeba healyi’ with the accession number CDFA01. CDFA01 was assembled using only Illumina data by the Centre for Genomic Research at the University of Liverpool in 2014. After the sequence was deposited, CDFA01 was subsequently reattributed to A. palestinensis (Reich, CCAP 1547/1, syn. ATCC 30870) https://u.osu.edu/Acanthamoeba/genomes-of-Acanthamoeba, Corsaro, Reference Corsaro2024).
The CDFA01 assembly is very fragmented, consisting of 26188 scaffolds. To produce some larger scaffolds for a more intelligible synteny plot, the CDFA01 assembly was further scaffolded using the GP39-C1 genome (MaSuRCA pipeline version) as a reference with RagTag. After scaffolding, the GP39-C1 assembly and the RagTag-scaffolded CDFA01 assembly were compared for synteny using the software package JupiterPlot; the resulting Figure 7 shows that the syntenic blocks are larger and more common between these assemblies than between GP39-C1 and the C3 assembly. The RagTag scaffolding process was also repeated using the CDFA01 assembly and the C3 assembly as the reference to check the synteny between these 2 genomes and to see if the process might bias the results. This comparison, shown in Supplementary Figure S3, shows that there is less synteny between the C3 and CDFA01 assemblies than there is between the GP39-C1 and CDFA01, as was expected of a T6 and a T2 genome, as these are more similar to each other based on their 18S rRNA gene sequence similarity than to C3, which is an isolate with genotype T4.
Genome-wide synteny between GP39-C1 and the genotype T2 genome assembly CDFA01. JupiterPlot comparison between the GP39-C1 MaSuRCA assembly and the RagTag-scaffolded CDFA01 assembly. Coloured blocks represent GP39-C1 scaffolds and grey blocks represent CDFA01 scaffolds, with ribbons indicating syntenic regions. Only scaffolds larger than 500 kb were included, using a minimum syntenic block size of 50 kb and MAPQ ≥ 50. Larger and more numerous syntenic blocks are observed than in the comparison with the T4 C3 genome (Figure 6), consistent with the closer evolutionary relationship between the T2 and T6 lineages.

Figure 7 Long description
A circular diagram illustrates syntenic relationships between genomic scaffolds labeled G1 to G38. Each scaffold is represented by a segment around the circle, with lines connecting them to indicate syntenic regions. The scaffolds are arranged sequentially and the connections form a pattern across the circle, suggesting genomic similarities or evolutionary relationships between the scaffolds. The diagram visually represents the comparative genomic analysis between different assemblies.
To produce a more quantitative figure, the gap-excluded per cent divergence between the genomes was calculated using the ‘04_compute_seq_divergence.py’ Python script as used by Matthey-Doret et al. (Reference Matthey-Doret, Colp, Escoll, Thierry, Moreau, Curtis, Sahr, Sarrasin, Gray, Franz Lang, Archibald, Buchrieser and Koszul2022). Table 3 shows that the Neff and C3 genomes diverge by 6.66%, whereas GP39-C1 and CDFA01 are 10.80% divergent.
Per cent gap-excluded divergence between genome assemblies

Table 3 Long description
Percent gap excluded divergence values are listed for pairwise comparisons among C3, Neff, CDFA01, and GP39-C1, with zeros on the diagonal for each assembly compared to itself. In the Neff row, divergence from C3 is 6.66 with an asterisk marker, and Neff compared to itself is 0. In the CDFA01 row, divergence from C3 is 16.88, from Neff is listed as Nd, and CDFA01 compared to itself is 0. In the GP39-C1 row, divergence from C3 is 17.49, from Neff is listed as Nd, from CDFA01 is 10.80, and GP39-C1 compared to itself is 0. Values are provided only in the lower triangle of the matrix, with the corresponding upper triangle cells left blank.
a Data obtained from Matthey-Doret et al. (Reference Matthey-Doret, Colp, Escoll, Thierry, Moreau, Curtis, Sahr, Sarrasin, Gray, Franz Lang, Archibald, Buchrieser and Koszul2022).
Search for putative virulence genes
Subtilisin-like serine protease
The MaSuRCA GP39-C1 genome assembly was searched for an orthologue of serine proteinase, a putative virulence gene, relevant in AK infections due to its proteolytic activity (Blaschitz et al., Reference Blaschitz, Köhsler, Aspöck and Walochnik2006). The sequences for serine protease in 11DS (T6) and GP39-C1 (proposed T6) are 97.495% identical. The amino acid sequences translated using ExPASy (Gasteiger et al., Reference Gasteiger, Gattiker, Hoogland, Ivanyi, Appel and Bairoch2003), excluding the ‘?’ symbol (caused by the indeterminate base M in the nucleotide sequence for DQ152195), are 98.75% identical, as demonstrated in the alignment of amino acid sequences in Figure 8.
Amino acid sequence alignment of the subtilisin-like serine protease from GP39-C1 and isolate 11DS. Protein sequences were translated from nucleotide sequences using ExPASy and aligned using ClustalW. The predicted subtilisin-like serine protease from GP39-C1 shows 98.75% amino acid identity with the experimentally characterized genotype T6 isolate 11DS, supporting conservation of this putative virulence-associated protease between T6 isolates.

Figure 8 Long description
Pairwise amino acid sequence alignment between DQ152195 and GP39-C1. The sequences are aligned in two rows per block, with position numbers at the top. Highlighted blocks indicate conserved residues. The sequences appear identical across the shown region. DQ152195: HGTVACTVCG CVARGGILIA KVVLGCDGST SAAVQIEGTQ WTAENAKRRG RRSVANMSLG GGYSATQNRA VAVVVVEGFV FPAAVGNEDQ NACNNSPASE AKATIVGATI YEGTSQQDIR ASFNSNCVDI LAPGQOSIKS AWQNSAYNTI SGQ. GP39-C1: HGTVACTVCG CVARGGILIA KVVLGCDGST SAAVQIEGTQ WTAENAKRRG RRSVANMSLG GGYSATQNRA VAVVVVEGFV FPAAVGNEDQ NACNNSPASE AKATIVGATI YEGTSQQDIR ASFNSNCVDI LAPGQOSIKS AWQNSAYNTI SGQ.
MBP1
The gene that codes for mannose-binding protein-1 (MBP1) was identified in the CDFA01 assembly by Corsaro (Reference Corsaro2022): a 3250-bp orthologue for this gene was also found in the GP39-C1 genome assemblies using a BLAST search. An alignment of MBP1 in the CDFA01 assembly and the MBP1 candidate sequence extracted from the GP39-C1 (MaSuRCA pipeline) assembly was produced and showed that the 2 sequences are 78.69% identical. No orthologous sequence was found in the GP39-C1 genome for the partial mannose-binding protein gene sequence that was reported to be from an A. palestinensis sample by Niyyati et al. (Reference Niyyati, Rezaie, Babaei and Rezaeian2010).
The MBP1 sequence contains several introns in Acanthamoeba. Using AUGUSTUS (Stanke et al., Reference Stanke, Steinkamp, Waack and Morgenstern2004) and Genscan (Burge and Karlin, Reference Burge and Karlin1997) to predict introns/exons, as performed in Corsaro (Reference Corsaro2022), yielded sequences that were dissimilar and lacked contiguity with those reported by Corsaro (Reference Corsaro2022). The genomic sequence for MBP1 in GP39-C1 was then translated in silico using FGENESH (Salamov & Solovyev, Reference Salamov and Solovyev2000). The resulting amino acid sequence was aligned with the MBP1-predicted protein sequence extracted from the CDFA01 assembly by Corsaro (Reference Corsaro2022) and that of A. castellanii (AAT37864), shown in Figure 9. In the absence of empirical data from transcript sequences, the putative 809 aa FGENESH-translated sequence was compared to the predicted protein sequence from CDFA01. Amino acid sequence identity was 76.1% using a BLOSUM62 comparison matrix (Henikoff and Henikoff, Reference Henikoff and Henikoff1992). Figure 9 also shows the presence of the calcium-dependent mannitol binding site, underlined in red.
Multiple sequence alignment of predicted mannose-binding protein 1 (MBP1). ClustalW alignment of the predicted MBP1 amino acid sequences from GP39-C1, the genotype T2 assembly CDFA01 and Acanthamoeba castellanii (AAT37864). The GP39-C1 coding sequence was predicted using FGENESH. The conserved calcium-dependent mannose-binding motif is underlined in red. GP39-C1 shares 76.1% amino acid identity with the predicted CDFA01 MBP1 sequence, indicating conservation of the protein despite substantial sequence divergence.

LBP
A 1288-bp orthologue was also found for the laminin-binding protein (LBP) gene sequence, using the nucleotide sequence of A. healyi (AY351649.1) as reference. The MaSuRCA assembly and Flye_corr assemblies were found to contain 2 copies of LBP; presented in Figure 10 is the single copy extracted from the Flye_raw assembly, translated using Genscan and aligned with the LBP sequence from CDFA01 as reported by Corsaro (Reference Corsaro2022). The transmembrane domain and putative laminin-binding sites, shown in Corsaro (Reference Corsaro2022), were found in the translated LBP sequence and are underlined in blue and red, respectively, in Figure 10. The identity of the sequences was found to be 96.2% using a BLOSUM62 comparison matrix.
Multiple sequence alignment of predicted laminin-binding protein (LBP). ClustalW alignment of predicted LBP amino acid sequences from GP39-C1 and the genotype T2 assembly CDFA01. The GP39-C1 coding sequence was predicted using GenSCAN. The putative laminin-binding motif (LMFWLL) is underlined in red, and the predicted transmembrane domain is underlined in blue. The GP39-C1 sequence shares 96.2% amino acid identity with CDFA01, demonstrating strong conservation of this putative adhesion protein.

Figure 10 Long description
Multiple sequence alignment of predicted laminin-binding protein (LBP) sequences. The alignment is organized in two rows per block: LBPT2Apa on top and GP39-C1LBF below, with position numbers labeled in increments from 10 to 266. The sequences show strong conservation, with highlighted differences and gaps. Specific motifs are underlined in red, indicating the putative laminin-binding motif (LMFWLL). The alignment demonstrates a high degree of similarity, with 96.2 percent amino acid identity between the sequences. The visual encoding includes colored residue blocks and position numbering, providing a clear representation of the sequence alignment.
GP39-C1 mitochondrial genome
The assembled mitochondrial genome of GP39-C1 is 42 kb in length. The annotated genome was found to contain 3 rRNA genes (23S, 16S-like and 5S), 16 tRNAs, 36 protein-coding genes and ORFs of unknown function.
Corsaro et al. (Reference Corsaro, Mrva, Colson and Walochnik2024) describe up to 3 different group I introns in the 23S rRNA gene of Acanthamoeba mitochondrial genomes. The 23S rRNA of GP39-C1 contains 2 of these 3 group I introns. The locations of the genes and features are shown in Figure 11, an annotation diagram produced with OGDRAW (Greiner et al., Reference Greiner, Lehwark and Bock2019).
Annotated mitochondrial genome of GP39-C1. A map of the 42 kb mitochondrial genome assembled from GP39-C1. The genome contains 3 ribosomal RNA genes (23S, 16S-like and 5S), 16 tRNA genes, 36 predicted protein-coding genes and several open reading frames of unknown function. Two group I introns are present within the 23S rRNA gene, consistent with previously described variation among Acanthamoeba mitochondrial genomes. Gene annotation and graphical representation were generated using OGDRAW.

Figure 11 Long description
The mitochondrial genome of Acanthamoeba sp. GP39-C1 is 42,042 base pairs long. It features a linear map with various colored blocks representing different genes and elements. On the left, a legend identifies the colors corresponding to specific gene types: ribosomal RNA genes, transfer RNA genes, protein-coding genes and open reading frames. The genome map includes three ribosomal RNA genes labeled as 23S, 16S-like and 5S and 16 transfer RNA genes. There are 36 predicted protein-coding genes, such as nad1, nad2 and cox1, among others. Several open reading frames of unknown function are also present. Two group I introns are located within the 23S rRNA gene. The diagram is oriented vertically, with the genome′s name and size written alongside. The layout provides a clear visual representation of the gene locations and their respective functions within the mitochondrial genome.
Discussion
Overview
Currently, there are very few genome assemblies available for Acanthamoeba, a medically important genus that can cause a debilitating keratitis (AK) which results in vision impairment. This study has generated the first whole-genome assemblies for the understudied genotype T6 of Acanthamoeba, obtained from a UK patient isolate. Using several methodological approaches, we compared and benchmarked our newly generated assemblies to one another, as well as to reference assemblies for T4 and T2 genotypes by assessment of genome-wide synteny and gap-excluded divergence. Following nuclear and mitochondrial genome annotation, we were able to identify and extract 3 putative virulence-associated genes, 1 coding for the proteolytic enzyme subtilisin-like serine protease and 2 coding for glycoprotein-binding proteins MBP1 and LBP. Combined, this constitutes a valuable resource for future studies of the genomic composition of T6 isolates.
Assembly quality
The generated genomes are highly contiguous and complete, as evidenced by the N50 and BUSCO score of the annotated genomes and their protein sets. Each of the assemblies had strengths and weaknesses. The highest BUSCO completeness was observed for Flye_corr with complete BUSCOs (89.1% genome mode, 94.1% protein mode). The assembly with the lowest duplication estimate was Flye_raw with 7.1%. The MaSuRCA pipeline produced the fewest scaffolds (85), fewer scaffolds than both of the T4 comparators. Additionally, these scaffolds contained no gaps, and the MaSuRCA pipeline assembly was the only GP39-C1 assembly to achieve this. Among these assemblies, the highest scaffold N50 assembly metric of contiguity was achieved by the Flye_corr assembly (1.8 Mb). The metrics for all versions of the assembly suggested each was highly contiguous and complete. However, the assembly with the most duplications, the Flye_corr assembly, was also the most complete. It is difficult to assess without further acquisition of data which of the assemblies generated best represents the ‘true’ form of the genome. Duplicate reduction strategies, for example the ‘–no-alt-contigs’ command in Flye (Kolmogorov et al., Reference Kolmogorov, Yuan, Lin and Pevzner2019) or using the Purge_Dups software package (Guan et al., Reference Guan, McCarthy, Wood, Howe, Wang and Durbin2020), do lower the number of duplicates, but also remove a significant number of complete BUSCOs from the assembly. These findings suggest that proper phasing is required to represent the natural genome. Furthermore, Matthey-Doret et al. (Reference Matthey-Doret, Colp, Escoll, Thierry, Moreau, Curtis, Sahr, Sarrasin, Gray, Franz Lang, Archibald, Buchrieser and Koszul2022) state in their paper that there are misassemblies present in their C3 assembly that cannot be resolved without a phased genome because these appear to result from heterozygosity. They also posit that the heterogeneous coverage of each of the scaffolds is possibly indicative of aneuploidy. In light of this information, the most logical way to improve the assembly of GP39-C1 would appear to be production of a phased genome, that is, an assembly in which the haplotypes present in multiploid genomes have been successfully deconvoluted so that attribution to chromosomes reflects the true genomic structure. Indeed, this approach may be required for Acanthamoeba genomes in general. An improved genome could potentially be generated using Hi-C or similar chromatin conformation mapping data for scaffolding and phasing, as has been used to produce haplotype-resolved assemblies of large and complicated polyploid plant genomes (Zhang et al., Reference Zhang, Chen, Shi, Gong, Zhang, Zhao, Zhan, Vasseur, Wang, Yu, Liao, Xu, Qi, Wang, Ma, Wang, Ye, Ma, Shi and You2021; Jang et al., Reference Jang, Cho, Park, Lee, Bae, Jung, Jin, Woo, Park, Kim, Choi, Chae, Guk, Kim, Kim, Kang, Lee, Cheon, Kim and Kim2024).
No single assembly consistently ranked highest across all evaluation metrics; therefore, we elected to release the best-performing assemblies. For the majority of downstream analyses, we selected the MaSuRCA assembly because it represented a compromise between assembly contiguity, which helped with the synteny analysis, and reduction of suspected false duplications. Nevertheless, without the additional scaffolding data described above, it remains unclear which assembly most accurately represents the true genome structure. Despite these uncertainties, we consider the release of these assemblies important because they constitute the first genomic reference resource for the T6 lineage. We therefore make them publicly available while recognizing that further refinement is warranted. Future sequencing efforts, either by our group or by collaborators working with GP39-C1 or related T6 isolates, should enable the generation of a more complete and accurate reference genome.
In addition to the potential for improvement to sequence quality, we also recognize the lack of RNA-based validation for the annotation. Given the improvement between the genome mode BUSCO results and the protein mode for the C3 assembly, we assert that an RNA sequencing-based annotation approach to produce the protein sets would likely show the genome to be more complete than those produced using MetaEuk in this study. It would be helpful to know with certainty which genes are expressed in GP39-C1, especially those that are potentially virulence-associated.
Morphological findings
Prior to genome sequencing, we performed a morphological assessment of GP39-C1 using the identification keys of Page (Reference Page1976, Reference Page1988). Based on cyst morphology and growth characteristics, GP39-C1 most closely resembled A. palestinensis. However, the match was not exact: the isolate exhibited a smaller average cyst diameter and shared morphological features with A. culbertsoni. These observations highlight a broader issue in Acanthamoeba taxonomy, in which isolates frequently display combinations of morphological traits that do not conform to existing species descriptions.
Historically, species designations within Acanthamoeba have been based primarily on cyst morphology. However, molecular studies have repeatedly shown that such classifications do not reliably reflect phylogenetic relationships. Consequently, morphologically defined species often represent phenotypic groupings rather than coherent evolutionary units. We therefore consider that these traditional species descriptions may be more usefully interpreted as morphotypes. While the detailed work of Page and of Pussard and Pons remains essential for describing isolate diversity, morphology alone appears insufficient for robust species delimitation. Accordingly, we do not assign GP39-C1 to a named species on morphological grounds alone and instead emphasize the need to integrate genomic data into future taxonomic frameworks.
Phylogenetic analysis of the 18S rRNA gene placed GP39-C1 closest to T6 isolates 11DS and A. palestinensis (2802) (a group III isolate). Notably, 11DS was originally identified morphologically as A. hatchetti, a distinctly different morphological description to that of GP39-C1 characterized by 3- to 4-sided polygonal endocysts, emphasizing the variability between morphological and phylogenetic classifications within the T2–T6 clade.
At present, there is no consensus on genomic thresholds for species delimitation in Acanthamoeba. However, several studies suggest that major T4 subtypes may represent independently evolving lineages approaching species-level units, although definitive boundaries require genomic evidence beyond the 18S rRNA gene alone (Fuerst and Booton, Reference Fuerst and Booton2020; Malavin and Shmakova, Reference Malavin and Shmakova2020). Genome comparisons between representatives of the T4 subtypes T4A (C3) and T4G (Neff) show 6.66% divergence, and these lineages are no longer considered conspecific following the reassignment of the Neff strain from A. castellanii to A. terricola (Corsaro et al., Reference Corsaro, Mrva, Colson and Walochnik2024). Although these comparisons do not define formal species thresholds, they indicate that lineages with substantially lower divergence than GP39-C1 and CDFA01 (10.8%) are already treated as distinct species in current practice. This supports the possibility that GP39-C1 and A. palestinensis Reich do not represent the same species despite their presumed morphological similarity, although this conclusion remains provisional pending broader phylogenomic analysis of T2 and T6 isolates.
Interpretation of the comparison between CDFA01 and GP39-C1 should be made with some caution. CDFA01 was selected as the only publicly available genome assembly from a T2 isolate, but the assembly is fragmented and suboptimal for detailed comparative analyses. In addition, it originates from the University of Liverpool Centre for Genomic Research mislabelling event and was not accompanied by contemporaneous morphological characterization. Although subsequent investigation suggested correspondence with ATCC 30870 (A. palestinensis Reich), the absence of primary phenotypic data limits direct comparison with GP39-C1. Given the poor concordance between morphology and phylogeny observed across the genus, it cannot be assumed with certainty that the sequenced isolate closely reflected the phenotype of GP39-C1.
Overall, the available data suggest that GP39-C1 and A. palestinensis Reich may represent distinct species despite presumed morphological similarity. Definitive resolution will require expanded phylogenomic analyses incorporating additional T2 and T6 isolates, including re-evaluation of ATCC 30870 using integrated morphological and genomic approaches. Direct comparison with A. palestinensis (2802) would further improve resolution of relationships within this clade.
More broadly, comprehensive phylogenomic sampling across Acanthamoeba is now increasingly feasible and is necessary to resolve long-standing taxonomic uncertainty. Until morphological and genomic frameworks are reconciled, assigning species designations solely on morphology is likely to obscure evolutionary relationships and hinder clinical and epidemiological interpretation of Acanthamoeba infections.
To summarize, the genome assemblies presented here, produced for an isolate from a clinical case of AK with a rare genotype, provide a new resource for researchers seeking to clarify the taxonomy of the genus. These assemblies allow for further comparison with genomes from other Acanthamoeba genotypes, as well as deeper investigation of clinically relevant genes in order to improve management of AK patients.
Supplementary material
The supplementary material for this article can be found at https://doi.org/10.1017/S0031182026102959.
Data availability statement
The assemblies and reads are available on the European Nucleotide Archive under Bioproject: PRJEB101620
Acknowledgements
The authors thank all those in the Diagnostic Parasitology Laboratory involved in the detection of Acanthamoeba in clinical samples. They also thank Richard Atherton for helping with the microscopy.
Author contributions
R.C.H. performed genome assembly, DNA extraction, amoebic culture, co-planned the assembly pipeline and wrote the first draft of this manuscript with D.N. M.H. co-planned the assembly pipeline and created custom Python scripts. D.W. performed the ONT sequencing, as well as designed custom scripts to automate and retrieve basecalling of reads. C.R. and D.N. performed initial isolation of clinical samples and curation of archived samples and relevant clinical data used for this study. S.C. performed an advisory role on DNA extraction and sequencing protocols, and several custom scripts were produced by her and her group. D.N. and C.S. supervised R.C.H. P.F. provided key insights and mitochondrial genome annotations from other Acanthamoeba isolates. N.B. helped with synteny analysis. All authors have provided edits to the manuscript.
Financial support
R.C.H was funded by a PhD studentship from Fight for Sight, which is in turn generously supported by the AK community.
Competing interests
R.C.H. received a bursary of 1000 USD from Oxford Nanopore Technologies to present this research at the Free-Living Amoeba Meeting in November 2025. This work was conducted prior to application for the bursary, and ONT has/had no editorial control over this publication whatsoever.
Ethical standards
Not applicable.




 Open access

