1. Introduction
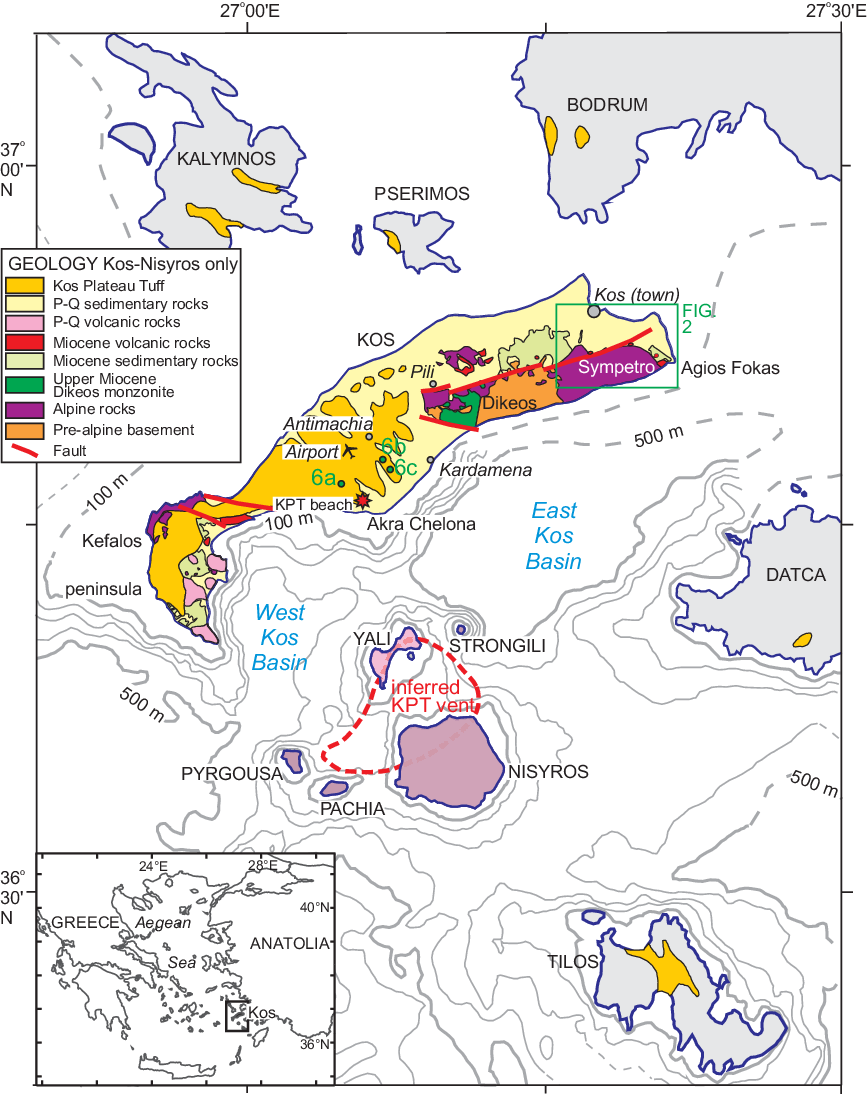
The islands of Kos, Yali and Nisyros (Fig. 1) form the most easterly volcanic centre of the South Aegean volcanic arc (Pe-Piper & Piper, Reference Pe-Piper and Piper2005). The Kos Plateau Tuff (KPT) eruption, at 161 ka, was the largest-known Quaternary eruption in the eastern Mediterranean, depositing tuffs up to 15 m thick that blanketed western Kos and extended as far as Tilos Island and the Bodrum and Datça peninsulas in Turkey (Allen, Reference Allen2001). The eruption took place at a time when global eustatic sea level was about 80 m below its present level (Rabineau et al. Reference Rabineau, Berné, Olivet, Aslanian, Guillocheau and Joseph2006).
General geological map of Kos island and the Nisyros volcanic complex (modified from Pe-Piper et al. Reference Pe-Piper, Piper and Perissoratis2005).

At the climax of the KPT eruption, the energetic pyroclastic flows of unit E scaled topographic barriers and deposited a widespread ignimbrite veneer, whereas the preceding pyroclastic flows of unit D were blocked by topography and deposited in valleys (Allen, Reference Allen2001). Only two outcrops of KPT north of Dikeos and Sympetro mountains in eastern Kos have been reported (E. Stadlbauer, unpub. Ph.D. thesis, Albert-Ludwigs University, Freiburg, 1988). One is a 2-m-thick flow tuff unit in the lowlands just north of Pili (Fig. 1). The other, located south of the town of Kos at an elevation of 50–80 m, was also briefly noted by Böger et al. (Reference Böger, Gersonde and Willmann1974) who included it in their “older Alluvium” unit, and by Keller et al. (Reference Keller, Rehren and Stadlbauer1990). Stadlbauer described this deposit as a 3–5-m-thick primary flow tuff with accretionary lapilli up to 3 cm near the top, and compared it with unit F of the KPT (Allen et al. Reference Allen, Stadlbauer and Keller1999). The first purpose of this study is to re-examine these KPT outcrops south of the town of Kos, correlating with typical primary KPT on central Kos Island, and to further constrain the timing and processes of deposition.
Furthermore, at Akra Chelona, south of Antimachia (Fig. 1) in central Kos, a beach deposit of pumice cobbles is preserved at the base of the KPT (Piper et al. Reference Piper, Pe-Piper and Lefort2010). The elevation of this dated beach provided an indication of the magnitude of tectonic uplift since the KPT eruption, estimated at 0.75 m ka−1. The second purpose of this study is therefore to determine the effects of subsequent marine transgression during the last interglacial (c. 127 ka) on the landscape of Kos. In particular, (1) we use the stratigraphic position of the KPT south of the town of Kos to date the terraces of eastern Kos Island; and (2) we test the hypothesis that the extensive flat upper surface of the KPT south and SW of Antimachia, including the airport, represents the marine isotope stage (MIS) 5e highstand. More generally, we demonstrate the magnitude and distribution of neotectonic uplift since the KPT eruption and compare it with available rates of neotectonism in the South Aegean Arc east of Santorini.
2. Methods
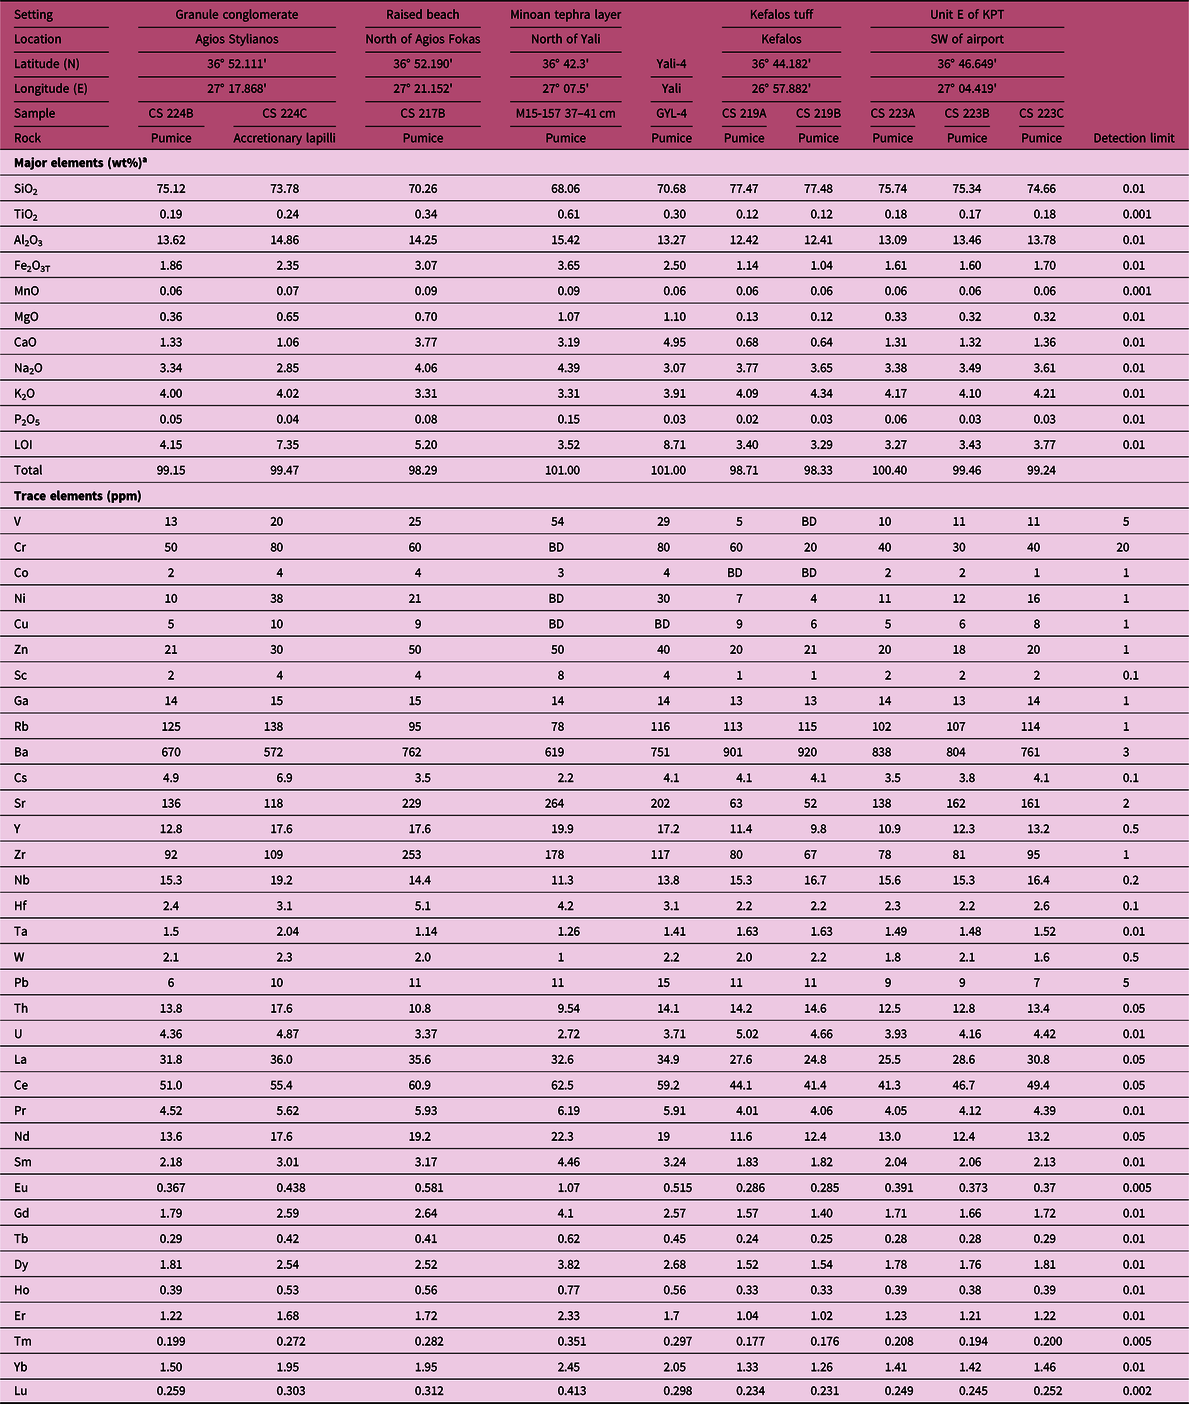
Fieldwork involved standard procedures, including measuring sections and taking photographs. Polished thin-sections of pumice samples were examined for textures and identification of ferromagnesian minerals and feldspar composition, both on a scanning electron microscope (SEM) with energy dispersive spectroscopy (EDS) chemical analyses, and on an electron microprobe (EMP) with wavelength-dispersive spectroscopy (WDS) analyses. Pumice types were identified using the classification of Bouvet de Maisonneuve et al. (Reference Bouvet de Maisonneuve, Bachmann and Burgisser2009) and vesicularity was measured from the weight of cubes of known size (Allen, Reference Allen2001). Bulk-rock geochemistry of various pumice samples was determined by inductively coupled plasma – mass spectrometry (ICP-MS) methods (details in Table 1) at Activation Laboratories (Ancaster, Ontario, Canada).
Geochemical analyses of Agios Stylianos pumice lapilli and comparative rocks. BD – below detection limit; LOI – loss on ignition. All elements determined by Activation Laboratories Ltd in 2011, according to their code 4Lithoresearch and code 4B1 packages, which combine lithium metaborate – tetraborate fusion ICP whole-rock analysis with a trace-element ICP-MS package

a Major elements are reported volatile-free, but the original values of LOI, total and trace elements are given.
3. Results
3.a. Reworked KPT south of Kos town
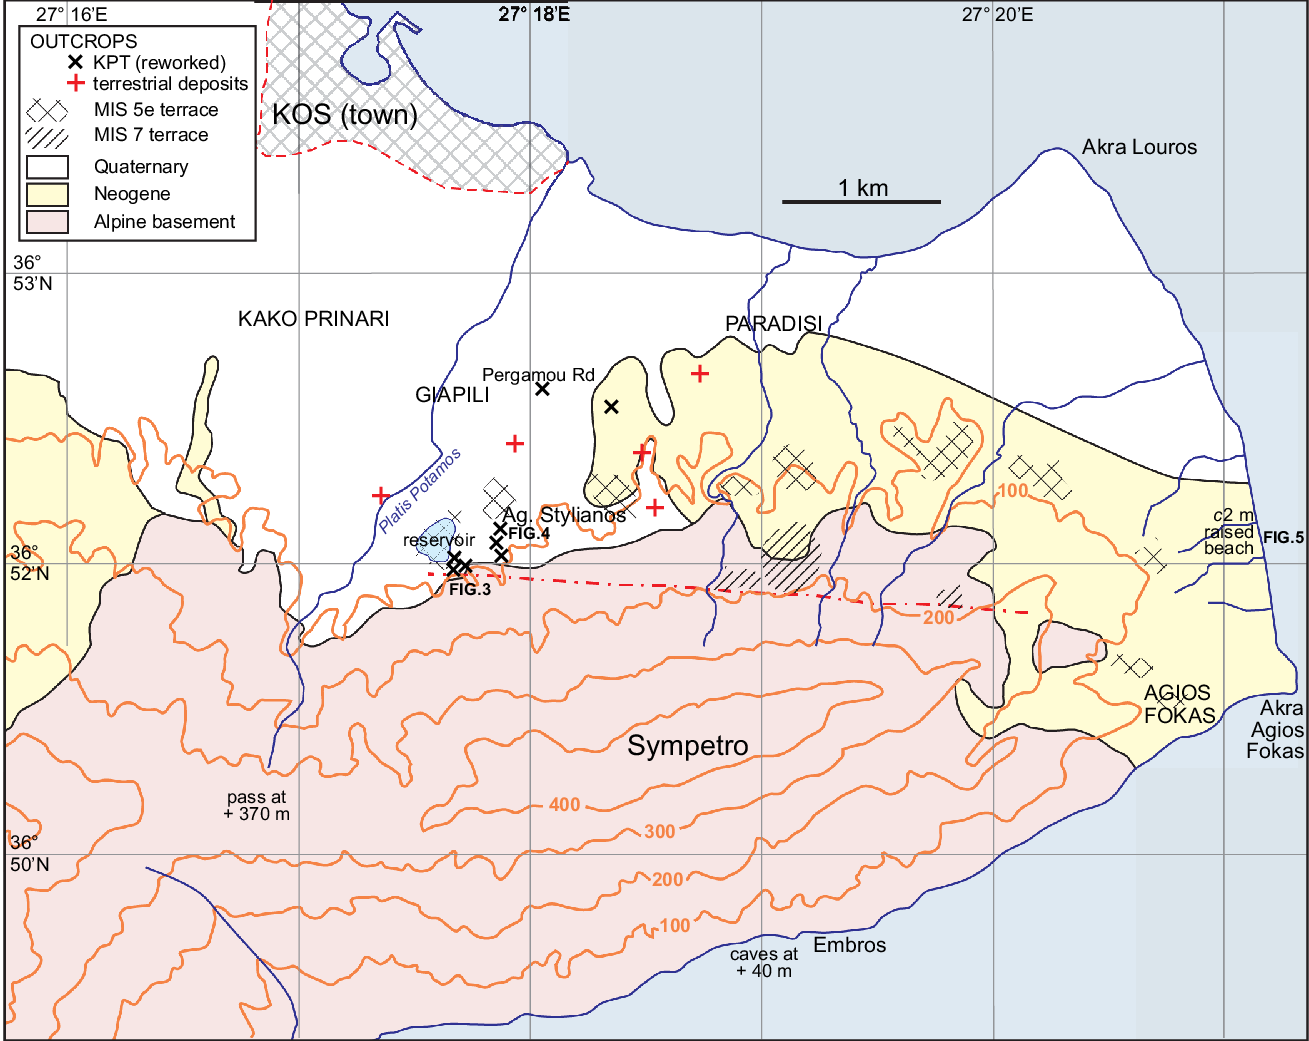
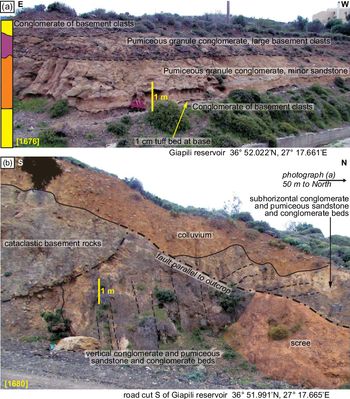
Much of eastern Kos is devoid of KPT but, to the south of the town of Kos, on the northern flanks of Sympetro Mountain, a distinctive pumice granule conglomerate, several metres thick, crops out at several localities between Agios Stylianos church and the Giapili reservoir (Fig. 2). At the reservoir, the base of the section consists of several metres of poorly sorted pebble conglomerate or breccia, principally of black metasandstone clasts, which is overlain by a thin (c. 1 cm) discontinuous tuff bed (Fig. 3a). This is followed by c. 2 m of bedded pumiceous granule conglomerate, locally with thin beds of pumiceous medium-and coarse-grained sandstone. The largest pumice clasts have a mean diameter of c. 1 cm. This unit contains a few percent of black metasandstone clasts, petrologically similar to those in the underlying conglomerate-breccia. The pumiceous granule conglomerate is overlain by c. 1 m of similar conglomerate that also has abundant pebbles and cobbles of black metasandstone. Finally, at the top of the section is a poorly sorted conglomerate-breccia of black metasandstone clasts similar to that at the bottom of the section.
Map of the area between Kos town and Agios Fokas. Geology simplified from IGME 1:50 000 map (Triantaphyllis, Reference Triantaphyllis1998). Shows outcrops with reworked pumice and other Quaternary outcrops where pumice was searched for but not found. Terraces and their interpreted ages are also shown.

(a) Pumiceous granule conglomerate section at the Giapili reservoir. (b) Faulted contact of Quaternary pumiceous granule conglomerate with basement rocks. (Note that colluvium and scree are shown with a transparent brown overlay.) Location in Figure 2.

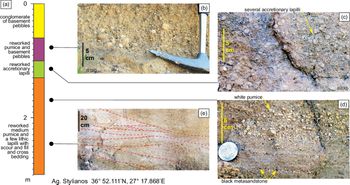
At Agios Stylianos church, 400 m NE of the reservoir section, the base of the volcaniclastic section is not seen. The lowest c. 1.5 m of outcrop comprises bedded and cross-bedded (Fig. 4d, e), pumiceous, granule conglomerate and sandstone, similar in thickness and lithology to that in the reservoir section, with some granules of black metasandstone (Fig. 4d). It also contains rare red and black volcanic lithic clasts (lapilli), < 10 mm mean diameter, that in hand specimen petrographically resemble andesite found elsewhere in the KPT. This basal unit is overlain by 30 cm of pumiceous granule conglomerate with abundant accretionary lapilli 5–8 mm in diameter (Fig. 4c), again with some granules of black metasandstone, followed by a further 40 cm of pumiceous granule conglomerate and sandstone including pumice clasts of mean diameter up to 1.5 cm (Fig. 4b). The section is capped by poorly sorted conglomerate-breccia of black metasandstone clasts similar to that at the reservoir section.
Pumiceous granule conglomerate section at Agios Stylianos church. Location in Figure 2. (a) Summary stratigraphic section; (b) upper pumiceous granule conglomerate and sandstone; (c) reworked accretionary lapilli; (d) detail of pumiceous granules, with some black metasandstone granules; and (e) cut-and-fill and cross-bedding in main pumiceous granule conglomerate and sandstone section.

About 1 km to the north, intervals of pumiceous granule conglomerate of thickness c. 2 m crop out along the Pergamou Road in Giapili (Fig. 2). Otherwise in the region of Kako Prinari–Giapili–Paradisi, all outcrops that we could study were either of Neogene marls and sandstones (Willmann, Reference Willmann1983), or terrestrial conglomerates and sandstones with metasandstone and/or limestone clasts, lacking any visible pumice component. Significant outcrops that we searched for traces of detrital pumice without success are shown by Figure 2.
Immediately south of the reservoir is the main fault separating alpine basement rocks of the Dikeos–Sympetro horst from Neogene and Quaternary rocks to the north. This fault is exposed in a road-cut just south of the reservoir (Fig. 3b), where there are multiple slices (5–10 m wide) of cataclastic basement metasandstone, schist and limestone bounded by subvertical E–W faults. The northernmost fault appears to have a thrust component (Fig. 3b) and overlies subvertical pumiceous granule conglomerate with distinct beds richer in granules and pebbles of black metasandstone. The illustrated outcrop is complicated by a minor N–S fault.
3.b. Terraces of eastern Kos
The Quaternary sections between the town of Kos and Sympetro Mountain are deeply dissected by the ephemeral Platis (wide) River and several smaller streams (Fig. 2). From the Platis River E-wards to Agios Fokas are a series of terrace remnants with an elevation of c. 70–110 m above sea level, including the terrace on which the Giapili reservoir was built (Fig. 2). A second higher set of terrace remnants occur at elevations of c. 170 m and are bounded by the active fault along the north side of Sympetro Mountain.
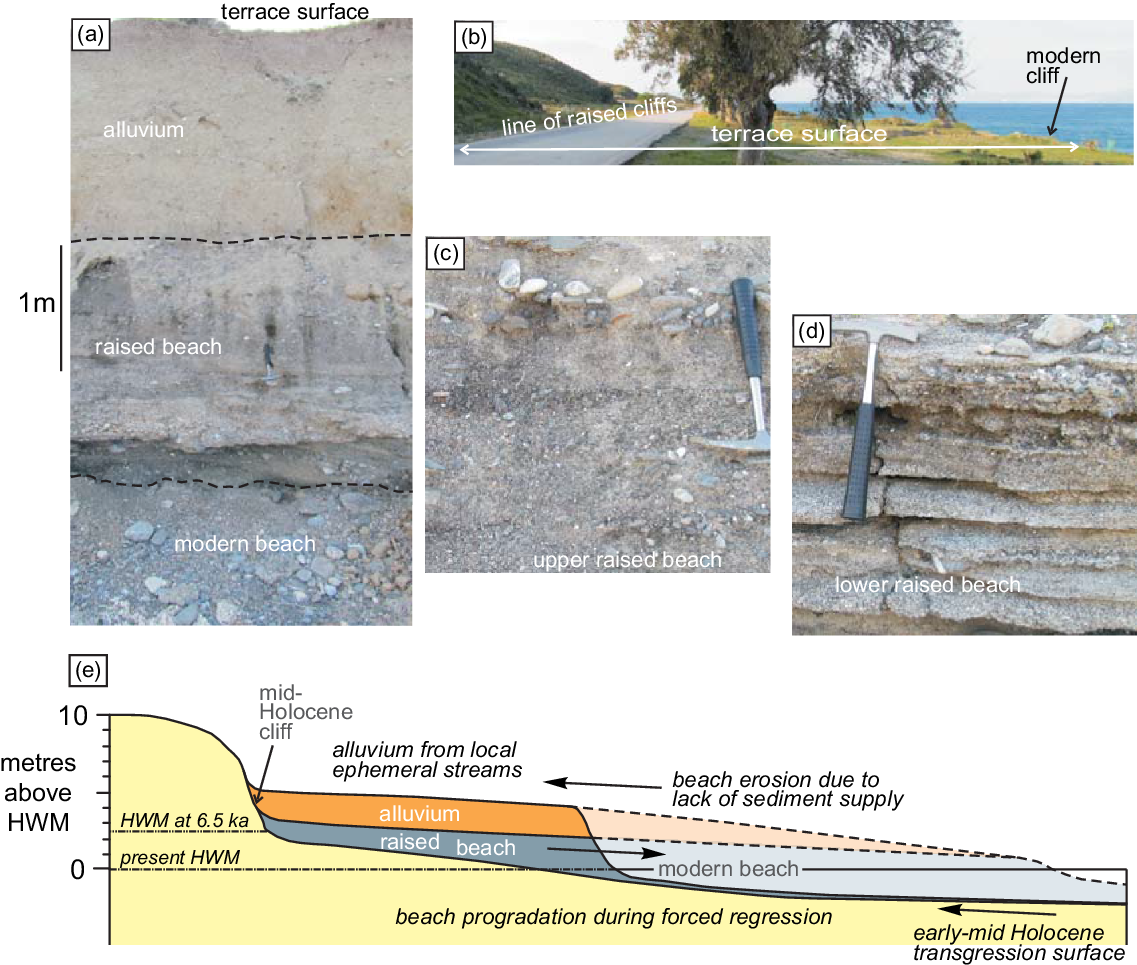
Lower terraces are present north and NW of Agios Fokas, with the most prominent terraces at elevations of 65–70, 34 and 28 m. A terrace at an elevation of c. 50 m is developed along the south coast of Sympetro mountain, with common caves at an elevation of c. 40 m in a limestone headland west of the Embros hot springs (Fig. 2). The N-trending coastline between Akra Louros and Akra Agios Fokas has a low raised beach with an elevation of c. 2 m above present high water (Fig. 5a, c, d), covered with 2–3 m of alluvium (Fig. 5a), terminating landwards in low cliffs in Neogene bedrock (Fig. 5b). The alluvium is apparently derived from several small ephemeral streams that have cut gullies into Neogene bedrock (Fig. 2). The raised beach rises slightly to the south. Two pumice pebbles were found in this raised beach and the bulk chemistry of the larger pebble was determined (Table 1). The lower part of the raised beach shows gently dipping well-sorted thin beds of coarse sand with rare sorted gravel (Fig. 5d). This facies may correspond to the zone of sandy beach cusps in the modern Dimitra beach south of Agios Fokas described by Sanders (Reference Sanders2000). The upper part of the raised beach is less-well-sorted, poorly stratified coarse sand and gravel (Fig. 5c), the likely result of storm deposits.
Raised beach north of Akra Agios Fokas. Location in Figure 2. (a) Modern cliff with alluvium overlying raised beach deposits; (b) general view of alluvial terrace and palaeocliffs in Neogene sediments; (c) detail of upper raised beach deposits; (d) detail of lower raised beach deposit; and (e) cartoon showing evolution of the raised beach during middle–late Holocene time. HWM – mean high water mark.

3.c. Erosion of the KPT south of Antimachia
The raised cobble beach at the base of the KPT described by Piper et al. (Reference Piper, Pe-Piper and Lefort2010) was re-examined and the key observations made in 2007 confirmed. The elevation of the beach deposit was re-determined several times by global positioning system (GPS) as 55 ± 3 m.
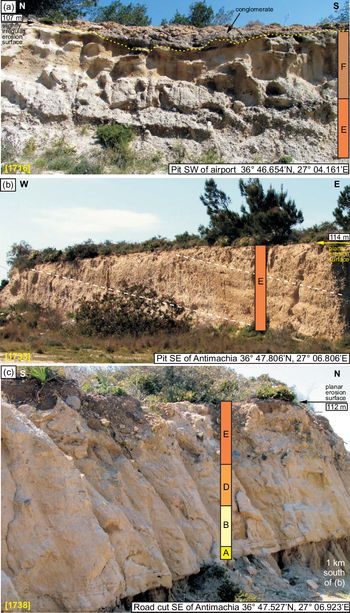
In addition, the flat upper surface of the KPT was examined at numerous localities at elevations of 100–135 m for evidence of overlying marine terrace deposits. In almost all outcrops, the top of the KPT appeared to be a flat horizontal erosional surface with only a thin soil cover cutting gently dipping KPT strata (Fig. 6b). In a large quarry SE of Antimachia on the Kefalos Road (Fig. 1), the erosional top of the KPT is overlain by a moderately sorted pebble conglomerate up to 1 m thick (Fig. 6a). The pebbles and granules principally comprise rounded pumice and lesser volcanic lithic clasts, apparently from the KPT. In addition, there are exotic lithologies not known in the KPT, including vein quartz (c. 1%) and metasandstone (trace). No marine fossils were found.
Field photographs of the erosional terrace cutting the KPT south of Antimachia. Locations in Figure 1. (a) Erosion surface with overlying conglomerate above KPT units E and F; (b) planar erosion surface above dipping KPT unit E; (c) planar erosion surface above basal part of unit E, with underlying units D, B and A of the KPT. The KPT stratigraphic units for these sections are tentative, and based on a comparison with nearby sections recorded in unpublished field notes of Dr Sharon Allen (pers. comm. 2019).

3.d. Geochemistry of pumice lapilli and blocks
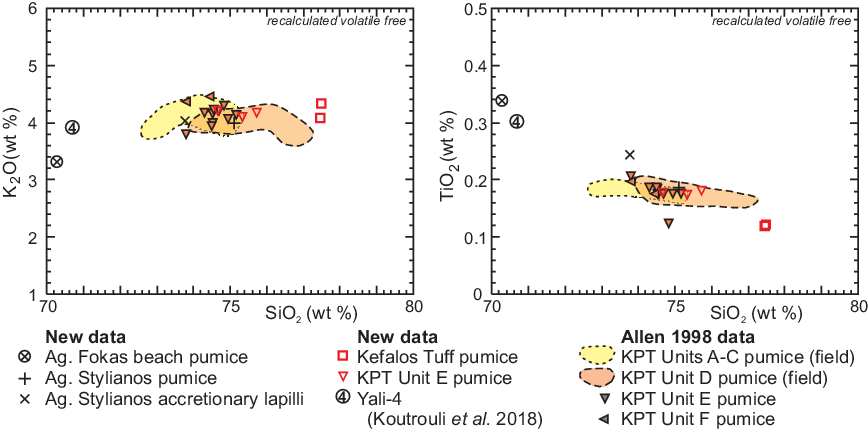
Geochemical analyses (Fig. 7) have been made of reworked pumice lapilli from Agios Stylianos, and a pumice clast in the low raised beach north of Akra Agios Fokas. For comparison, analyses have also been made of pumice lapilli or blocks from the Kefalos tuff at Kefalos, and unit E of the KPT SW of Antimachia (Table 1). The pumice lapilli from Agios Stylianos are geochemically similar to pumice lapilli from unit E of the KPT, whereas the accretionary lapilli with lower SiO2 content are geochemically similar to unit F (Fig. 7).
Geochemistry of pumice lapilli from various sources (Agios Stylianos, raised beach north of Akra Agios Fokas, Kefalos tuff, KPT unit E; Table 1) compared with analyses of pumice from units A to F of the KPT from S.R. Allen (unpub. Ph.D. thesis, Monash University, 1998) (excluding two analyses with likely admixture of andesitic glass).

3.e. Textures of pumice lapilli and blocks
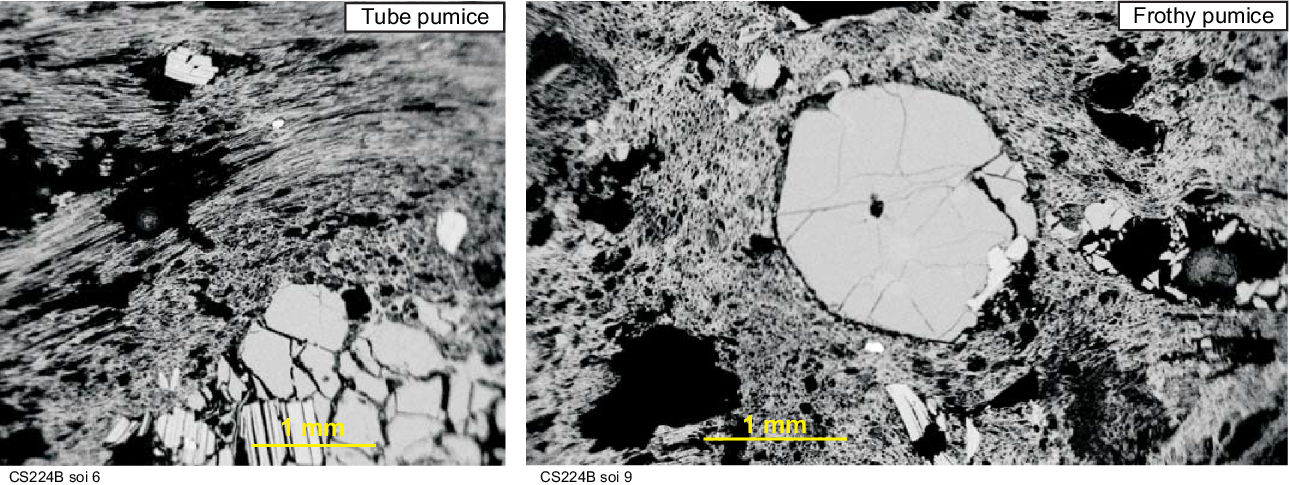
Textures of the reworked pumice lapilli from Agios Stylianos were studied using backscattered electron images on an SEM in order to demonstrate whether or not they resembled KPT pumice. Most of the pumice was either tube pumice or frothy pumice (Fig. 8) using the classification of Bouvet de Maisonneuve et al. (Reference Bouvet de Maisonneuve, Bachmann and Burgisser2009). Pumice lapilli have a vesicularity of 67% and an average of 11% phenocrysts, comprising sanidine, quartz, biotite and plagioclase (mostly oligoclase).
SEM backscattered electron images of pumice lapilli from Agios Stylianos, illustrating tube and frothy pumice types of Bouvet de Maisonneuve et al. (Reference Bouvet de Maisonneuve, Bachmann and Burgisser2009).

4. Discussion
4.a. KPT deposition and reworking in eastern Kos
The pumiceous tuffites of the Agios Stylianos and Giapili reservoir outcrops are interpreted as reworked river deposits, rather than being primary pyroclastic deposits. Even the most pumice-rich samples contain size-sorted clasts of black metasandstone, and the subvertical outcrop in Figure 3b has multiple beds richer in granules and pebbles of black metasandstone. The fine size-sorted laminae and cross-laminae are quite distinct from the generally crude stratification in KPT outcrops. The abundance of pumice lapilli makes it likely that the tuffite is related to the KPT eruption. The abundance of phenocrysts including sanidine rules out a correlation with the Kefalos tuff, the only other thick Quaternary tuff on Kos (Allen et al. Reference Allen, Vougioukalakis, Schnyder, Bachmann and Dalabakis2009).
The grain size and composition of lapilli in the reworked Agios Stylianos and Giapili reservoir outcrops are quite different from the sections in the KPT in central Kos described by Allen et al. (Reference Allen, Stadlbauer and Keller1999). The characteristics of the reworked deposits are: (1) the paucity and small size of volcanic lithic clasts (< 10 mm) and (2) the lack of coarse-grained pumice (> 16 mm) clasts. While some sorting may have occurred during transport and deposition on the alluvial fan, the upper pumiceous unit at the reservoir section has abundant large clasts of the local bedrock from Sympetro Mountain, suggesting that the lack of coarse pumice is not due to a lack of capacity of river flows. It is possible that larger pumice clasts do not waterlog so easily and are therefore easily transported downcurrent by rivers. It is unlikely that the observed lithic clasts (< 10 mm) and medium pumice were emplaced by fallout. Allen (Reference Allen2001) estimated a pyroclastic column height of 20–30 km, which, according to Carey & Sparks (Reference Carey and Sparks1986), would transport 10-mm lithic clasts no more than 8 km in a cross-wind direction. The crest of Sympetro above the tuffite outcrops is 25 km from the putative KPT vent (Fig. 1); the observed lithic clasts and medium pumice clasts therefore strongly suggest transport to the flanks of Sympetro Mountain by pyroclastic flows.
The pumice lapilli from Agios Stylianos closely resemble the pumice lapilli from the KPT in terms of geochemistry, petrography and physical properties. Because energetic pyroclastic flows may erode earlier deposits, the characterization of which unit the pumice was derived from requires care. Chemically, the pumice lapilli sample most closely resembles unit E of the KPT (Fig. 7). Both frothy and tube pumice lapilli, found in the tuffites, are common in units D and E of the KPT (Bouvet de Maisonneuve et al. Reference Bouvet de Maisonneuve, Bachmann and Burgisser2009) and the measured vesicularity and phenocryst abundance in the pumice lapilli of the tuffite correlate with unit E of the KPT (Allen, Reference Allen2001).
Accretionary lapilli 5–8 mm in diameter near the top of the Agios Stylianos section are concentrated, not dispersed as a minor component with more abundant pumice lapilli. The occurrence of black metasandstone granules suggests that the accretionary lapilli were reworked, but probably shortly after their deposition, as they are very common in the rock (Fig. 4c). Allen et al. (Reference Allen, Stadlbauer and Keller1999) described accretionary lapilli from unit F of the KPT in central Kos, during the final waning stage of the KPT eruption. Geochemically, the accretionary lapilli at Agios Stylianos resemble unit F tuff (Fig. 7).
The main succession of tuffite at Agios Stylianos (Fig. 4), principally pumiceous granule conglomerate, mirrors the stratigraphy of units E and F of the KPT, and was therefore deposited during the eruption of the KPT. The conglomerate bed overlying the accretionary lapilli has lesser pumice and more bedrock clasts (Fig. 4b), and was reworked and deposited after the eruption of unit F. At the Giapili reservoir (Fig. 3), the thin basal tuff is probably an airfall deposit from an earlier phase of the KPT. The main pumiceous granule conglomerate is similar to that at Agios Stylianos, interpreted as synchronous with the KPT eruption. No accretionary lapilli bed is present: it may have been eroded out by the topmost pumiceous granule conglomerate with abundant large clasts of bedrock, which probably immediately post-dated the KPT eruption. Later, normal hillslope erosion produced the overlying conglomerate with bedrock clasts. Reworking of KPT has also been described from the flanks of the domes in the western Kefalos Peninsula by E. Stadlbauer (unpub. Ph.D. thesis, Albert-Ludwigs University, Freiburg, 1988).
The preservation of KPT pumice only in a small area around Giapili appears to be the result of two phenomena. The Platis River is today the largest river in eastern Kos, and it was likely a significant river at the time of the KPT eruption, depositing a broad alluvial fan at the foot of Sympetro Mountain. To the east, streams are much smaller and have smaller drainage basins. Between Dikeos (846 m) and Sympetro (466 m) mountains, the headwaters of the Platis River extend to a 2-km-wide pass less than 400 m high, with a present least elevation of c. 370 m (Fig. 2). Parts of the KPT pyroclastic flows may therefore have spilled over the pass, whereas much of eastern Kos was completely protected by Dikeos and perhaps by Sympetro. We show below that the pass has been elevated 120 m since the KPT eruption, but at that time sea level was at −78 ± 12 m (Fig. 9). The phase E pyroclastic flow that crossed the marine area of the East Kos Basin (Allen & Cas, Reference Allen and Cas2001) would therefore have been at least 200 m thick. Furthermore, only in the area of the Platis alluvial fan was there significant deposition of clastic sediment that buried and preserved tuffs reworked at the time of the KPT eruption. The lack of primary deposits of tuff suggests that the pyroclastic flow may have accelerated down the steep northern flank of Sympetro, which has a present gradient of c. 10°, before perhaps depositing distally on the now-submerged plain off NE Kos. Coarse-grained lithic clasts and pumice, characteristic of unit E, are lacking in the reworked tuffite around Giapili, probably indicating vertical sorting within the pyroclastic flow that spilled over the pass.
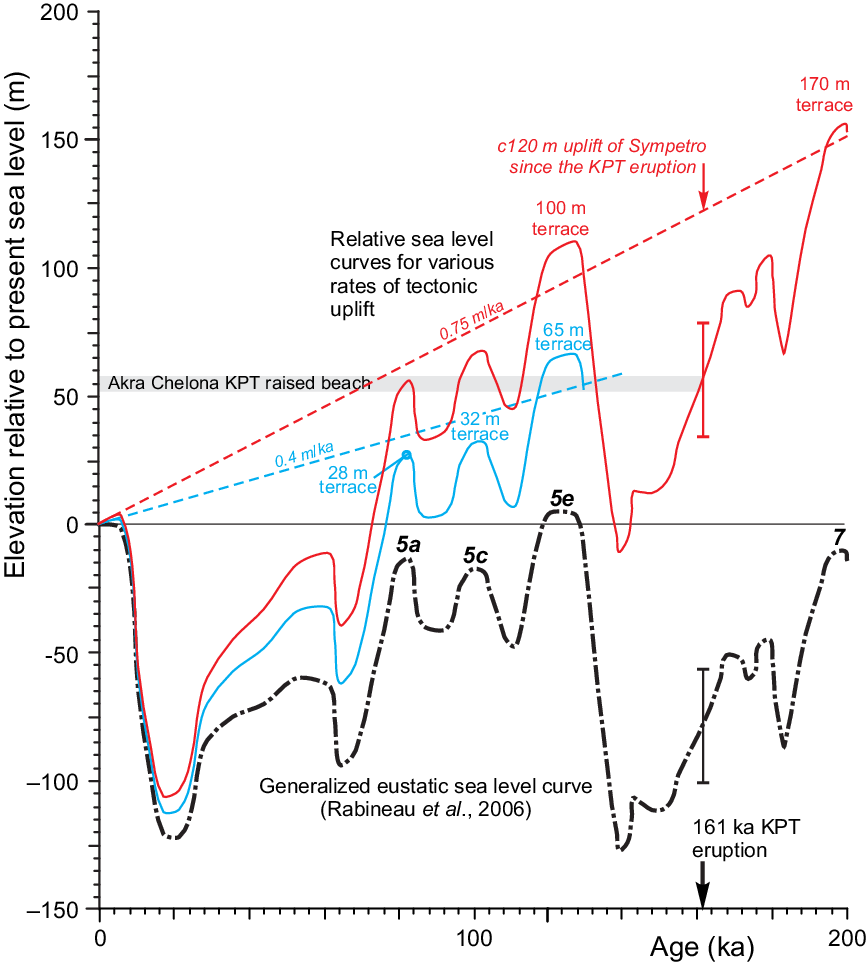
Relationship between marine highstand terraces, tectonic uplift and eustatic sea-level variations. Sea-level variation compiled from Rabineau et al. (Reference Rabineau, Berné, Olivet, Aslanian, Guillocheau and Joseph2006); bar shows range of possible eustatic sea level for the Akra Chelona beach. Red graph shows relative sea-level variation with 0.75 m ka−1 tectonic uplift based on the Akra Chelona beach. This rate of uplift is also the mean rate for the terraces of eastern Kos, which are assigned to the highstands at MIS 7 (terrace at elevation of c. 170 m) and MIS 5e (terrace at elevation of 70–110 m). Blue graph shows relative sea level with 0.4 m ka−1 tectonic uplift, characteristic of the area north of Akra Agios Fokas where the observed terraces are interpreted to have formed during MIS 5e, 5c and 5a.

4.b. The origin of the terraces in eastern Kos
The terrace near Agios Stylianos at an elevation of c. 70–110 m can be related stratigraphically to the reworked KPT deposits. The terrace cuts the stratigraphy of the Platis alluvial fan and its interbedded reworked KPT sediments, which form a cliffed palaeo-shoreline at the southern edge of the terrace at the Giapili reservoir (Figs 2, 3). This terrace is therefore younger than the KPT, and corresponds to the MIS 5e highstand of sea level, the highest eustatic sea-level stand since the KPT eruption (Fig. 9). Marine transgression following the MIS 6 lowstand, during which time the KPT was deposited, would have efficiently reworked and dispersed any tuffs that had accumulated on the land surface below the terrace level that were not buried by alluvium.
The present elevation of the terrace at 70–110 m implies an uplift rate of 0.6–0.9 m ka−1 (Fig. 9). This is not an exceptional neotectonic rate of displacement. It is comparable, for example, with the conservative estimates of late Quaternary rates of uplift of fan deltas in the western Gulf of Corinth (Taylor et al. Reference Taylor, Weiss, Goodliffe, Sachpazi, Laigle and Hirn2011). The terrace at an elevation of c. 170 m would correspond to the previous marine highstand in MIS 7 at c. 200 ka based on the same uplift rate. Rather lower terraces are present near Agios Fokas, with the main terrace at an elevation of 65–70 m (Fig. 2) and lower terraces at elevations of 32 and 28 m, suggesting a slower uplift rate of c. 0.4 m ka−1 (Fig. 9). The two lower terraces correspond to MIS 5c and 5a, respectively.
The raised beach at +2 m between Akra Loura and Akra Agios Fokas (Fig. 5) has depositional facies predominantly of gravel, comparable with beaches to the SW described by Sanders (Reference Sanders2000). The geochemistry of the pumice pebble found in the raised beach is compared in Table 1 with two possibly correlative late Holocene pumices: a pumice lapilli in the Minoan ash bed in core M15-157 north of Yali and the Yali-4 tuff on Yali island (Koutrouli et al. Reference Koutrouli, Anastasakis, Kontakiotis, Ballengee, Kuehn, Pe-Piper and Piper2018). This Yali-4 tuff overlies Neolithic material and was dated at 3–4 ka (± 0.5 ka) (Liritzis et al. Reference Liritzis, Michael and Galloway1996). The raised beach pumice closely resembles the Yali-4 pumice in SiO2, TiO2, rare earth elements, and trace elements including V, Cr, Ni, Sc, Ba and Nb. It differs in these trace elements from the Minoan pumice, which is less siliceous, and pumice from other units in Yali and the KPT, which are more siliceous (Table 1; see also Piper et al. Reference Piper, Pe-Piper and Lefort2010). The pumice supports the interpretation of this very fresh-looking raised beach as Holocene. Applying the mean uplift rate of 0.4 m ka−1 that accounts for the elevation of the nearby MIS 5e raised terrace at c. 65 m (Fig. 9) gives an age of c. 5 ka for the highest exposed beach facies at +2 m. This raised beach therefore prograded following the middle Holocene stabilization of sea level at c. 6.5 ka (Fig. 5e), and is now being eroded as coastal development has blocked the supply of new sediment from the small ephemeral streams (cf. Tzatzanis et al. Reference Tzatzanis, Wrbka and Sauberer2003; Bianchi et al. Reference Bianchi, Corsini-Foka, Morri and Zenetos2014).
On the south side of Sympetro Mountain there is a widespread terrace at c. 50 m above present sea level from Agios Fokas to at least west of Embros (Fig. 2). This terrace probably also dates from MIS 5e, but this interpretation requires further confirmation. If correct, it implies that the Sympetro block is tilted to the SE.
4.c. Origin of the terrace at an elevation of 100 m in central Kos
To the casual observer, the ‘Kos Plateau’ of western Kos, dipping gently W-wards from Antimachia to Kefalos, appears related to the deposition of the Kos Plateau Tuff, blanketing previous topography. However, sections through the KPT reported by Allen et al. (Reference Allen, Stadlbauer and Keller1999) from south of Antimachia show that the Kos Plateau is an erosion surface that cuts progressively deeper in the stratigraphy going S-wards (compare Fig. 6b with 6c, 1 km to the south). Field outcrops commonly show that the modern ground surface is a flat erosional surface cutting across gently dipping KPT strata (Fig. 6b). The elevation of the erosion surface ranges from c. 100 m at Akra Chelona, to c. 112 m at the Figure 6c locality, to c. 135 m at Antimachia (Fig. 1); the erosion surface is at an elevation of c. 107 m in the pit of Figure 6a. The erosion surface around Antimachia dips gradually to the SW, so that the prominent erosion surface at Akra Tigani at an elevation of 30 m appears to be the continuation of the same erosion surface (Fig. 10). In the Kefalos peninsula, prominent terraces are generally lacking except for a base-KPT surface at c. 180 m south of Kefalos. The north coast of Kos dips gently to the sea and generally corresponds to the somewhat eroded depositional top of units E and F of the KPT.
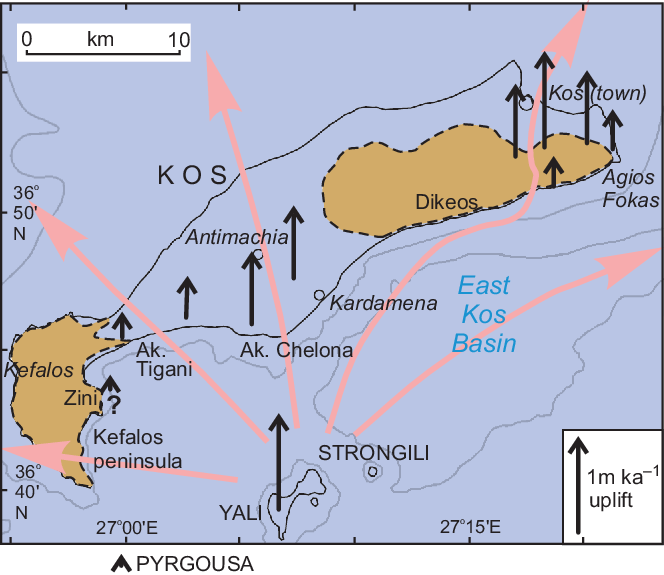
Outline map of Kos showing estimated rates of uplift since the MIS 5e highstand. Blue tone indicates areas that were submerged during MIS 5e. The length of the black arrows is proportional to the rate of uplift. Pink arrows show inferred pathways of pyroclastic flows during the KPT eruption.

The interpretation of the terrace at an elevation of c. 100 m in eastern Kos is based on the stratigraphic evidence that it cuts tuffites related to the KPT; around Antimachia, this terrace cuts the KPT itself (Fig. 6). In addition, the revised elevation of the Akra Chelona beach deposit to 55 ± 3 m can be used to estimate the amount of uplift since the KPT eruption, and therefore provide independent confirmation of the MIS 5e age for the erosion surface. At 161 ka, eustatic sea level was at −78 ± 12 m (Fig. 9), implying an uplift rate of 0.75 m ka−1. The marine transgression at the transition between MIS 6 and MIS 5 (127 ka) was a few metres higher than present eustatic sea level (Shackleton, Reference Shackleton1987). Using the mean uplift rate of 0.75 m ka−1 determined above from the elevation of the beach deposit, the highest MIS 5e (127 ka) shoreline would be c. 100 m above present sea level, with an error in the estimate of perhaps ± 15 m. This confirms that the extensive flat upper surface of the KPT south and SW of Antimachia (Fig. 6), including the airport, represents the MIS 5e highstand. Unlike in eastern Kos, any older MIS 7 terrace has been blanketed by the KPT. At the MIS 5e highstand, Kos consisted of two islands, one comprising the Kefalos peninsula and the other the Dikeos–Sympetro horst, with much of central and northern Kos being submerged (Fig. 10).
Late Quaternary uplift of much of the island of Kos therefore took place at a rate of c. 0.75 m ka−1 (Fig. 10). Rate of uplift diminishes W-wards towards the Kefalos Peninsula, as does the abundance of modern seismicity near the south coast of Kos (Hellenic Seismic Network; https://bbnet.gein.noa.gr). On the Kefalos Peninsula, geomorphological evidence for rapid uplift, such as deeply incised gullies, is lacking. A line of undated raised caves on the east slope of Zini (Fig. 10), a few metres above present sea level, may indicate only slow net uplift. The rate of uplift also diminishes at the extreme eastern end of the island, near Akra Agios Fokas.
Nearby estimates of rates of uplift include on Pyrgousa islet (Fig. 10), where the MIS 5e terrace has been uplifted at < 0.1 m ka−1 (Piper et al. Reference Piper, Pe-Piper, Anastasakis and Reith2019), comparable to Zini, whereas on Yali the uplift rate of the Yali-D pumice breccia is c. 1 m ka−1 (Allen & McPhie, Reference Allen and McPhie2000). Comparably high rates of neotectonic movement are known in the region from Kos through Amorgos to Santorini, associated with late Quaternary 065°-trending strike-slip faulting. East of Santorini, subsidence of the Santorini–Anafi valley of 600 m has taken place in the last 0.2 Ma (Piper & Perissoratis, Reference Piper and Perissoratis2003), implying a subsidence rate of c. 3 m ka−1.
5. Conclusions
Tuffite deposits south of Kos town were reworked during and immediately after the KPT eruption from units E and F tephra deposited from a pyroclastic flow upslope in the pass between Dikeos and Sympetro mountains. The topmost deposit comprises reworked accretionary lapilli deposited during the eruption of unit F of the KPT. The pyroclastic flow (density current) that flowed across the marine East Kos Basin was c. 200 m thick and accelerated down the 10° north slope of Sympetro.
The tuffite deposits, together with a previously reported raised beach that formed immediately preceding the KPT eruption, allow the dating of raised marine terraces (ravinement surfaces) as principally from MIS 5e and 7. These terraces indicate uplift rates in central and eastern Kos of 0.7–1.0 m ka−1. The Kos Plateau on the central part of the island is a MIS 5e erosion surface, locally overlain by a transgressive lag conglomerate. A middle–late Holocene raised beach on the east coast of Kos contains pumice clasts correlated with the Yali-4 eruption at 3–4 ka. Its elevation of 2 m above sea level is consistent with the elevation of the local MIS 5e terrace. Its present erosion results from blocking of discharge from ephemeral streams by human infrastructure.
Acknowledgements
Field and geochemical work were partly supported by Discovery Grant 2016-04310 from the Natural Sciences and Engineering Research Council of Canada to GPP. Jason Amyoony assisted with the petrographic analyses. Dr George Anastasaikis provided the pumice sample from core M15-157. We thank an anonymous reviewer for a constructive review, and particularly Dr Sharon Allen for her thorough reviews and willing assistance with a number of technical points.