Implications
The average lactation length of high-producing cows has increased markedly in recent years mainly because of negative relationships between level of production and reproductive efficiency. Nevertheless, a voluntary conception delay is an alternative of interest for many farmers.
The knowledge of temporal evolution of milk yield and milk components in extended lactations is a key element for accurate management strategies. For this purpose the use of different models may offer complementary information and allow calculation of two traits, the inflection point and the asymptotic level of production, which may have some relevance for management and genetic purposes.
Introduction
The occurrence of cows having lactations that exceed the standard length of 305 days has markedly increased in recent years. For example, more than 55% of US Holsteins have lactations longer than 305 days (VanRaden et al., Reference VanRaden, Dematawewa, Pearson and Tooker2006) and about 25% of cows in Costa Rica are dried off after 330 days of lactation (Vargas et al., Reference Vargas, Koops, Herrero and van Arendonk2000). An overall increase of lactation length of 30 days for the last decade has been estimated by Gonzalez-Recio et al., (Reference Gonzalez-Recio, Perez-Cabal and Alenda2004).
The main reason for extended lactations is conception failure in early lactation. Traditionally, calving interval is fixed at about 1 year and the cow is inseminated around 2 months after parturition, that is, approximately when the lactation peak is expected to occur. Several authors report a negative relationship between level of production and reproductive efficiency at this lactation stage, in intensively managed herds (Lucy, Reference Lucy2001; Dobson et al., Reference Dobson, Smith, Royal, Knight and Sheldon2007). The negative energy balance experienced by the animal leads to massive mobilization of body reserves with a subsequent marked decrease in conception rate (Veerkamp et al., Reference Veerkamp, Emmans, Cromie and Simm1995; Bertilsson et al., Reference Bertilsson, Svennersten-Sjaunja, Wiktorsson, Berglund and Ratnayake1997). Moreover, the intense selection for increasing yield has resulted in a high risk of health problems around the period between calving and lactation peak. Erb et al. (Reference Erb, Smith, Oltenacu, Guard, Hillman, Powers, Smith and White1984) estimated that around 60% of health disorders occur during the first 40 days of lactation.
Conversely, a voluntary waiting period for insemination in order to extend calving interval from 18 to 19 months represents a management strategy for cows able to maintain high production levels for long time (Knight, Reference Knight2005). Actually, the possibility of increasing lactation length has been considered as an alternative to the common strategy of maximizing lactation peaks and minimizing calving intervals (Grossman and Koops, Reference Grossman and Koops2003; Auldist et al., Reference Auldist, O'Brien, Cole, Macmillan and Grainger2007; Butler et al., Reference Butler, Shalloo and Murphy2010). Cows with extended lactations have a reduction of calving risks and of postpartum metabolic diseases (Cole and Null, Reference Cole and Null2009) with a corresponding decrease in insemination costs and in number of days dry. Intensively managed dairy cows typically achieve three lactations in their entire productive life, which exposes them to three ‘peak risk’ periods. The immediate benefit of extended lactations would be a reduction of this exposure to two cycles. Moreover, Knight (Reference Knight2005) pointed out that milk yielded in 3 years with two (extended lactation) or three (conventional lactation) cycles, is the same if persistency is improved by 1% in the extended lactations.
Knowledge of main features of long lactations could be a key element for management and breeding decisions. Mathematical modelling of lactation curve with regular functions of time represents the most frequently used approach for studying main features of lactation patterns. Till the early 2000s, most literature dealing with lactation curve modelling was focused on the standard length and models have been basically conceived to fit 305-day lactation patterns. Vargas et al. (Reference Vargas, Koops, Herrero and van Arendonk2000) fitted some of the most popular functions to extended lactations, obtaining the best performances for the diphasic model. Grossman and Koops (Reference Grossman and Koops2003) further developed the multiphasic approach. A more recent comparison performed by Dematawewa et al. (Reference Dematawewa, Pearson and VanRaden2007) on US Holsteins concluded that three- or four-parameter models, as the Wood (Wood, Reference Wood1967) or the Rook (Rook et al., Reference Rook, France and Dhanoa1993) could be more suitable for describing long lactations in routine use, whereas more complex mechanistic models with a higher number of parameters should be used mainly for research purposes.
Some authors have argued that models conceived for fitting 305-day patterns may not adequately describe extended lactations and that specific functions should be developed (Grossman and Koops, Reference Grossman and Koops2003). Such a consideration may be correct for simple models characterized by a scarce flexibility but it may be questionable if flexible and more general functions are used. On the other hand, the increase of the number of parameters often leads to computational problems.
VanRaden et al. (Reference VanRaden, Dematawewa, Pearson and Tooker2006), suggested a modification of the mechanistic model of Dijkstra et al. (Reference Dijkstra, France, Dhanoa, Maas, Hanigan, Rook and Beever1997). The model was effective in modelling the average extended lactations curves of US Holstein. Moreover, it was able to identify a phase with production nearly constant beyond 600 days in milk (DIM) (asymptotic phase) that may be used as a decision criteria for keep milking a cow.
The aim of this study is to assess the main features of lactation curves for milk yield (MY) and its components for different length classes. For this purpose, six empirical mathematical models currently used to fit 305 standard lactations and the modified Dijkstra function (DF) were tested to evaluate their efficiency in describing average and individual extended lactations of Italian Holsteins.
Material and methods
Data
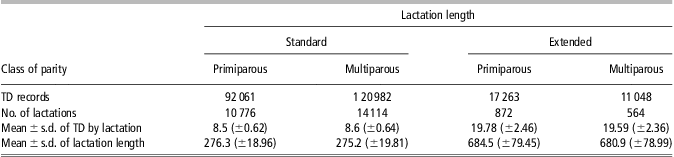
Data were 241 354 test-day records for MY, fat (FP) and protein (PP) percentage and somatic cell score (SCS = log2(somatic cell count/100)−3), from 21 658 lactations of Italian Holstein cows. Data were recorded in the period from 2002 to 2006 by the Italian Breeders Association in herds located in Northern Italy. Lactations were grouped according to parity (1 = first; 2 = second and third) and to lactation length (standard ⩽305 days, and extended from 600 to 1000 days), whereas lactations with lengths between 306 and 599 days were excluded from this study. Lactations were discarded if the first test day occurred after 70 days from parturition, whereas records after 1000 days from calving were not considered. Summary statistics across class of lactation length are reported in Table 1.
Distribution of lactations and TD available, means (and standard deviation) of lactation length and test days for lactation, according to parity and length classes

TD = test days.
Lactation curve models
Seven mathematical models available in literature were selected. Considered functions are characterized by an increasing number of parameters (three to seven), in order to test the effect of different degrees of flexibility on the ability to describe extended lactation patterns. The models were:
(1) the incomplete gamma function of Wood (Reference Wood1967) (WD):

that is the most popular and commonly used model of lactation curve, recommended also for fitting extended lactations (Dematawewa et al., Reference Dematawewa, Pearson and VanRaden2007);
(2) the combined exponential and linear model of Wilmink (Reference Wilmink1987) (WIL):

used in random regression test day models (Schaeffer et al., Reference Schaeffer, Jamrozik, Kistemaker and Van Doormaal2000; Reinhardt et al., Reference Reinhardt, Liu, Bünger, Dopp and Reents2002) to model fixed regression effects;
(3) the modified version of DF proposed by VanRaden et al. (Reference VanRaden, Dematawewa, Pearson and Tooker2006):

for t→∞ the DF has an horizontal asymptote the value of which is expressed by b 0, the asymptote can be interpreted as the value of MY in the final phase of lactation;
(4) the five-parameter polynomial regression of Ali and Schaeffer (Reference Ali and Schaeffer1987) (AS):

where x = t/lactation length, also this model has been used to fit individual curves in early versions of random regression test day models;
(5) a fourth-order Legendre orthogonal polynomial (LEG):

where Pi is the function of time calculated using values published by Schaeffer (Reference Schaeffer2004), in this form LEG is used as a sub-model in the random regression test day models for fixed and random effects, both in Italy (Muir et al., Reference Muir, Kistemaker, Jamrozik and Canavesi2007) and Canada (Muir et al., Reference Muir, Kistemaker and Van Doormaal2004);
(6) a quadratic spline function (QSPL) with three knots:

(7) a cubic spline function (CSPL) with three knots:

where Nj is the position of the knots, placed at 50, 200 and 600 days (the latter only for the longest class; Macciotta et al., Reference Macciotta, Miglior, Dimauro and Schaeffer2010). In all models, Yt represents the test day (MY, PP, FP or SCS) recorded at time t (days); ai , bi , ci and k are parameters to be estimated.
The seven models were used to fit both individual and average lactation patterns for all the traits considered. Average curves were calculated as means of all records available for each DIM, for each parity group and within each lactation length class. Only DIM with at least five test-day observations were considered. The goodness of fit was assessed by both using adjusted coefficient of determination (R 2 adj) and the root means square error (RMSE). Moreover, the Durbin–Watson statistic (DW) was used to detect the presence of autocorrelation in the residuals from the regression analysis. In fact, the presence of autocorrelated residuals suggests that the function may be inappropriate for the data. A linear regression was used to fit the AS, LEG, QSPL and CSPL models, whereas the WD, WIL and DF were fitted by a nonlinear regression, based on the Marquardt compromise and using the values published by VanRaden et al. (Reference VanRaden, Dematawewa, Pearson and Tooker2006) and Dematawewa et al. (Reference Dematawewa, Pearson and VanRaden2007) as initial parameter values.
Lactation curve traits, that is, time at which peak yield occurs (Tp), peak yield (Yp), cumulated milk production at 305 days (Y305) and 1000 days (Y1000) were calculated for average patterns. Individual curves were classified according to five levels of R 2 adj (<0.30, from 0.30 to 0.50, from 0.50 to 0.70, from 0.70 to 0.90, >0.90).
Results and discussion
Average curves
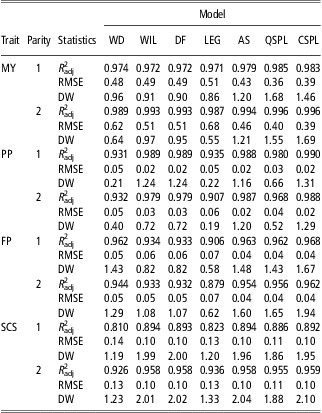
Goodness-of-fit statistics for the seven functions fitted to average standard curves are reported in Table 2. All models fitted MY well, with R 2 adj ranging from 0.971 to 0.996 and RMSE from 0.68 to 0.36 kg. Moderate values of autocorrelation between residuals were found for all models except for spline functions. For LEG, the value of DW was particularly low (dL = 1.71 for P < 0.01), especially for the second-parity group. Goodness of fit for milk components was slightly worse for FP and SCS, whereas for PP it was similar to MY. In general WIL, DF and polynomials provided the best fit, whereas WD and LEG gave systematically poorer results, with DW values particularly low for PP and SCS. An exception was the behaviour of WD on FP. For all models the fit was better for the second-parity group than for the first.
Goodness of fit for average standard curves for MY, PP, FP and SCS according to parity class, for WD, WIL, modified DF, LEG, AS, QSPL and CSPL models

MY = milk yield; PP = protein percentage; FP = fat percentage; SCS = somatic cell score; WD = Wood; WIL = Wilmink; DF = Dijkstra function; LEG = Legendre polynomials; AS = Ali and Schaeffer; QSPL = quadratic splines; CSPL = cubic splines; R 2 adj = adjusted coefficient of determination; RMSE = root means square error; DW = Durbin–Watson.
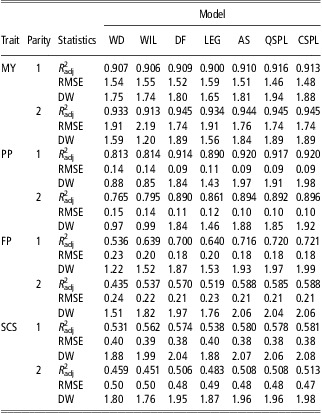
For extended lactations (Table 3) a general reduction of goodness of fit compared with standard lactations was found, with lower R 2 adj and higher RMSE. For example, average R 2 adj and RMSE for MY in the first-parity group were 0.98 and 0.45 in standard and 0.91 and 1.52 in extended lactations, respectively. Such a reduction was markedly higher for milk composition traits, especially FP and SCS. On the other hand, a substantial absence of autocorrelations among residuals (DW∼2.00, n = 713) was observed for extended lactations. Possible reasons for the reduction in goodness of fit in this class can be found in the high variability of test-day data beyond 600 DIM. Differences observed between traits could also be ascribed to their intrinsic variability, which is larger for SCS and FP than for MY and PP.
Goodness of fit for average extended curves for MY, PP, FP and SCS according to parity class, for WD, WIL, modified DF, LEG, AS, QSPL and CSPL models

MY = milk yield; PP = protein percentage; FP = fat percentage; SCS = somatic cell score; WD = Wood; WIL = Wilmink; DF = Dijkstra function; LEG = Legendre polynomials; AS = Ali and Schaeffer; QSPL = quadratic splines; CSPL = cubic splines; R 2 adj = adjusted coefficient of determination; RMSE = root means square error; DW = Durbin–Watson.
As far as model comparison is concerned, no important differences were found for MY, whereas for milk components WD, WIL and LEG models performed worse than the other functions. Moreover, no significant increase in goodness of fit was found moving from models with five parameters (DF and AS) to six (QSPL) and seven (CSPL).
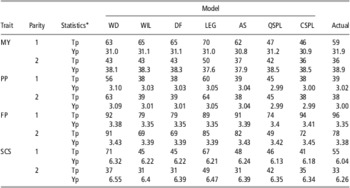
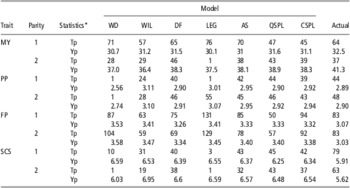
Tables 4 and 5 report lactation curve traits for standard and extended average patterns, respectively. Comparison between predicted and observed values shows, in general, a greater accuracy for AS and DF. Spline functions performed better for extended than for standard lactations. WD and LEG prediction were the less accurate, particularly for PP and SCS in standard and for MY and PP in extended lactations, respectively.
Tp, Yp and observed value (actual), for average standard lactations for MY, PP, FP and SCS according to parity class, predicted by WD, WIL, modified DF, LEG, AS, QSPL and CSPL models

Tp = time to the peak; Yp = production at peak; MY = milk yield; PP = protein percentage; FP = fat percentage; SCS = somatic cell score; WD = Wood; WIL = Wilmink; DF = Dijkstra function; LEG = Legendre polynomials; AS = Ali and Schaeffer; QSPL = quadratic splines; CSPL = cubic splines.
*Yp = maximum value for MY and minimum value for protein, fat and somatic cell score.
Tp, Yp and observed value (actual), for average extended lactations for MY, PP, FP and SCS according to parity class, predicted by WD, WIL, modified DF, LEG, AS, QSPL and CSPL models

Tp = time to the peak; Yp = production to the peak; MY = milk yield; PP = protein percentage; FP = fat percentage; SCS = somatic cell score; WD = Wood; WIL = Wilmink; DF = Dijkstra function; LEG = Legendre; AS = Ali and Schaeffer; QSPL = quadratic splines; CSPL = cubic splines.
*Yp = maximum value for MY and minimum value for protein, fat and somatic cell score.
As expected, first-parity cows had a lower peak yield (about 31 kg) and later occurrences (about 60 to 65 DIM), compared with higher parities (about 38 kg and 40 DIM, respectively). No practical differences between standard and extended cycles were observed for Yp and Tp predicted by AS, DF and spline functions, whereas for WD, WIL and LEG a large difference was found.
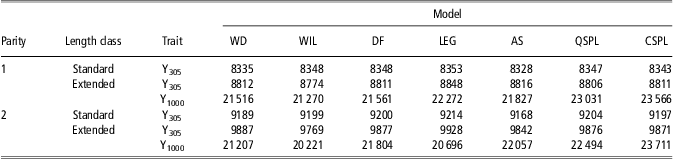
Prediction of total MY until 305 and 1000 days for standard and extended lactations are reported in Table 6. Estimates across models were rather similar for Y305 with means of 8343 ± 9 and 8811 ± 22 kg for first parity and 9196 ± 14 and 9864 ± 49 kg for second parity in standard and extended lactation, respectively. Differences were higher for Y1000, ranging from 21 270 to 23 566 kg and from 20 221 to 23 711 kg predicted by WIL and CSPL for the first- and second- parity groups, respectively. The differences between parities tended to decrease passing from standard to extended cycle because of greater persistency for young cows.
Cumulative production until 305 day (Y305) and cumulative production until the dry-off (Y1000), for MY, according to parity and length classes, predicted by WD, WIL, modified DF, LEG, AS, QSPL and CSPL models

MY = milk yield; WD = Wood; WIL = Wilmink; DF = Dijkstra function; LEG = Legendre polynomials; AS = Ali and Schaeffer; QSPL = quadratic splines; CSPL = cubic splines.
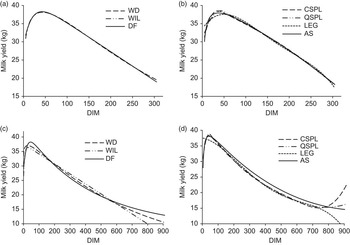
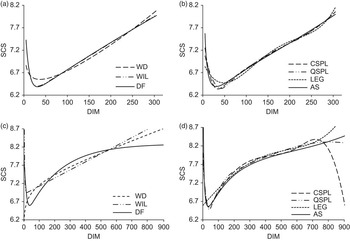
Estimated curves for standard and extended patterns (Figures 1 and 2), further clarify above reported results (only plots for MY and SCS for the second-parity group are reported for brevity). All models were able to adequately describe the trajectory of MY and SCS for standard lactation length, except WD for SCS and LEG for both traits. For extended lactations, models with fewer parameters tended to underestimate peak yield and were unable to describe the change of slope that occurred in the second part of lactation. This resulted in an overestimation (underestimation for milk contents) in the middle of lactation and an underestimation (overestimation for milk contents) in the final phase of production. These results partially agree with those reported by other authors (Grossman and Koops, Reference Grossman and Koops2003; Dematawewa et al., Reference Dematawewa, Pearson and VanRaden2006; VanRaden et al., Reference VanRaden, Dematawewa, Pearson and Tooker2006), that found underestimations of actual yield at later stage of extended lactations with standard models.
Estimated milk yield (MY) lactation curves for the second-parity group, by Wood (WD), Wilmink (WIL), modified Dijkstra function (DF), Legendre polynomials (LEG), Ali and Schaeffer (AS), quadratic splines (QSPL) and cubic splines (CSPL) models, for standard (a, b) and extended (c, d) classes. DIM = days in milk.

Estimated somatic cell score (SCS) lactation curves for the second-parity group, by Wood (WD), Wilmink (WIL), modified Dijkstra function (DF), Legendre polynomials (LEG), Ali and Schaeffer (AS), quadratic splines (QSPL) and cubic splines (CSPL) models, for standard (a, b) and extended (c, d) classes. DIM = days in milk.

Moreover, WD was unable to reconstruct the peak phase correctly for PP (result not shown) and SCS. Spline functions were able to describe both the first and the middle phase of lactation accurately, whereas beyond ∼600 DIM, they yielded a poor fit. A decrease of prediction ability for spline regression at the extremes of the lactation trajectory, especially if few records are available, has been previously reported (Macciotta et al., Reference Macciotta, Miglior, Dimauro and Schaeffer2010). LEG showed problems in fitting both extremes of the lactation trajectory for all traits.
An explanation of the difficulty for WD to adequately model the peak yield can be found in the high degree of correlations between its parameters. This is not the case for LEG because of the orthogonality property of polynomials. On the basis of the results on goodness of fit and prediction ability for average curves, DF and AS were able to reconstruct the regular patterns for both standard and extended average curves with good accuracies.
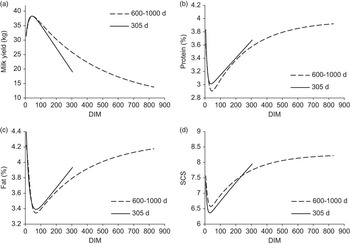
Main differences in shape between the two lactation length classes can be inferred from curves estimated by DF for the second-parity group in standard and extended lactations (Figure 3; similar results were obtained with the AS model). In agreement with previous studies (VanRaden et al., Reference VanRaden, Dematawewa, Pearson and Tooker2006; Dematawewa et al., Reference Dematawewa, Pearson and VanRaden2007) no important differences were detected between standard and extended patterns in the initial phase of lactation, both for the magnitude of values and for the occurrences of their maximum (or minimum for milk components). However, a marked difference in persistency can be observed between 200 and 305 DIM, especially for MY. Such a difference, reported by several authors (Bertilsson et al., Reference Bertilsson, Svennersten-Sjaunja, Wiktorsson, Berglund and Ratnayake1997; Vargas et al., Reference Vargas, Koops, Herrero and van Arendonk2000; Dematawewa et al., Reference Dematawewa, Pearson and VanRaden2007) may be explained by the effect of pregnancy on milk production, that results in a reduction of yield and in a change of milk composition around the 6th month of gestation (Bertilsson et al., Reference Bertilsson, Svennersten-Sjaunja, Wiktorsson, Berglund and Ratnayake1997; Brotherstone et al., Reference Brotherstone, Thompsonb and Whitea2004).
Estimated lactation curves by modified Dijkstra function (DF), for the second-parity group for (a) milk yield (MY), (b) protein percentage (PP), (c) fat percentage (FP) and (d) somatic cell score (SCS) according to length class. DIM = days in milk.

The variation of slope between standard and extended patterns resulted in an estimated difference of about 7 and 9 kg/day for daily yield at 305 DIM in the first- and second-parity groups, respectively. Extended lactations had a higher total MY at 305 DIM (difference of 463 and 677 kg for the first- and second-parity groups, respectively) compared with standard curves (Table 6).
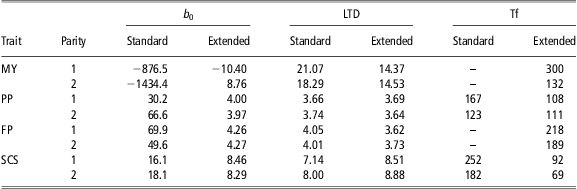
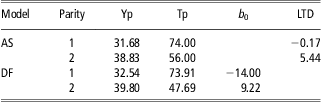
Beyond 300 DIM, it can be observed that the slope changes and MY and contents tend to an asymptotic value (Figure 3). Such a behaviour of the final stage of lactation can be described by variables calculated from parameters of both AS and DF, even though with a different meaning. In particular, the b 0 parameter of DF expresses the asymptotic value of the curve. Its values were much lower for MY and higher for composition traits in standard compared with extended curves, respectively (Table 7). These figures are obviously mathematical artefacts because of the fact that in the standard lactations there are no data after 305 DIM (i.e. when the asymptotical phase is expected to occur). The size of the estimated values of b0 seems to be related to the degree of slope of the curve. Test day for MY or composition at the last test day of lactation (LTD) can be predicted by the AS model AS = a 0 + a 1 + a 2. LTD for milk components were very similar between standard and extended lactations, whereas some differences can be observed for MY (about 7 and 4 kg/day, for the first- and second-parity groups, respectively). These results seem to indicate a constant milk composition for the extended period (i.e. from 300 to 1000 DIM). In general LTD values are slightly lower, except for MY, than those for b0 in the extended lactations (Table 7).
Asymptotic level (b 0) predicted by modified Dijkstra function and LTD and Tf, predicted by Ali and Schaeffer model, according to parity group and length classes for MY, PP, FP and SCS

LTD = last test day; Tf = time at inflection point; AS = Ali and Schaeffer model; MY = milk yield; PP = protein percentage; FP = fat percentage; SCS = somatic cell score.
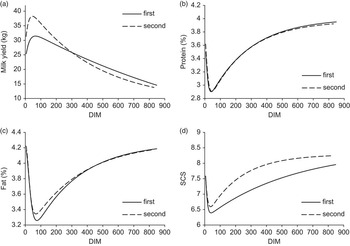
Differences between parity groups in extended lactations can be observed in Figure 4, which reports patterns for first and second-parity group predicted by DF for average extended lactations. First-parity cows showed lower peak MY and a greater persistency compared with higher parities. This trend confirms what is usually observed in lactations of standard length (Wood, Reference Wood1968), where it is ascribed to mammary maturation processes that are still in progress during the first lactation and which counteracts the normal decline in MY at the end of lactation (Stanton et al., Reference Stanton, Jones, Everett and Kachman1992).
Estimated lactation curves by modified Dijkstra function (DF) model, for (a) milk yield (MY), (b) protein percentage (PP), (c) fat percentage (FP) and (d) somatic cell score (SCS) according to parity class. DIM = days in milk.

After ∼300 DIM, older cows showed a lower production level compared with first parity and tend to an asymptotic value, in agreement with previous results on extended lactations (Haile-Mariam and Goddard, Reference Haile-Mariam and Goddard2008; Cole and Null, Reference Cole and Null2009). These results partially differ from those reported by VanRaden et al. (Reference VanRaden, Dematawewa, Pearson and Tooker2006) who found an asymptotic level of production for all parities of around 20 kg. Asymptotic yield estimated in this study with the DF (Table 7) was positive only for older cows. The time at which the lactation patterns changes the curvature (Tf; calculated for AS solving the following equations: a 3 + 2a 2 X 2 = −2a 4(1 + log(1/X))) confirms the differences between parity. Tf has an earlier occurrence in older cows compared with first parity.
Such behaviour is because of the different rates of decline (or increase, for milk components) of yield after the production peak (minimum for milk components). Curves for MY and SCS of primiparous cows show the classical pattern, whereas older cows exhibit an earlier change of curvature. Patterns of PP and FP are similar across parities (Figure 4 and Table 7).
With regard to lactation length, the second derivative had no solution for MY and FP in the 305-day class (Figure 3 and Table 7) presumably because there is no point of inflection after peak yield. In the case of PP and SCS, Tf was estimated around 150 and 200 days, respectively. It is interesting to notice that for these two traits the minimum level of production occurs earlier than for MY and FP (Tables 4 and 5). Results reported on Table 7 highlight an anticipated increase of the curve after the minimum for PP and SCS compared with FP.
Differences in Tf found between different classes of length (very large in the case of SCS) may be related to the fact that standard lactation patterns are more regular than those observed in extended ones. Thus, the change of curvature tends to occur later on in standard lactation. A shorter Tf may indicate a tendency of the animal to reach the asymptotic trend of production early. An anticipated occurrence of inflection in the lactation curve may be of help in an earlier evaluation of the opportunity to keep milking the cow. However, this may need further investigation as the possible influence of mathematical artefacts due to the interaction between properties of the mathematical model and data structure cannot be excluded.
As expected, milk components showed an opposite trend compared with MY (Figure 4). In particular, FP and PP did not show a significant variation among parities, whereas differences were detected for SCS, with a higher level for older cows. Similar SCS patterns were observed by Haile-Mariam and Goddard (Reference Haile-Mariam and Goddard2008) and Cole and Null (Reference Cole and Null2009). Moreover, FP and PP had the tendency to reach a plateau around 500 to 600 DIM. SCS showed a continuously increasing trend. The estimated Tf value (Table 7) indicated that the change of the slope occurred earlier for PP and SCS than for FP and MY.
Individual curves
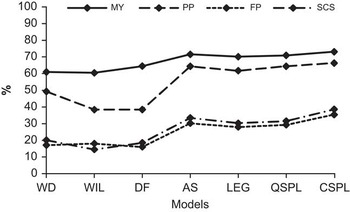
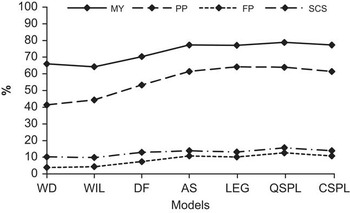
Percentage of individual lactation curves having an R 2 adj higher than 0.7 are reported in Figure 5 for standard and Figure 6 for extended lactations, respectively. Goodness of fit is markedly lower compared with average curves, thus confirming the higher variability of individual patterns. Similarly to average curves, poor fitting performances were obtained for FP and SCS, especially in extended lactations.
Percentage of individual standard curves having an adjusted coefficient of determination (R 2 adj) higher than 0.70 for Wood (WD), Wilmink (WIL), modified Dijkstra function (DF), Legendre polynomials (LEG), Ali and Schaeffer (AS), quadratic splines (QSPL) and cubic splines (CSPL) models. MY = milk yield; PP = protein percentage; FP = fat percentage; SCS = somatic cell score.

Percentage of individual extended curves having an adjusted coefficient of determination (R 2 adj) higher than 0.70 for Wood (WD), Wilmink (WIL), modified Dijkstra function (DF), Legendre polynomials (LEG), Ali and Schaeffer (AS), quadratic splines (QSPL) and cubic splines (CSPL) models. MY = milk yield; PP = protein percentage; FP = fat percentage; SCS = somatic cell score.

As expected, functions with a higher number of parameters show better fitting performances compared with three and four parameter functions. This difference was greatest for FP and SCS in standard lactations. QSPL and CSPL showed best fits for all traits and length classes. However AS and LEG models had very similar performances. DF showed intermediate results because of frequent convergence problems, which occurred in many cases (among 7% to 10% of cases, depending on the trait), especially for standard patterns.
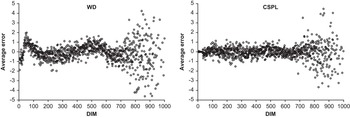
Figure 7 reports mean residuals (difference between observed and predicted) along the lactation for individual patterns in extended curves. Only an example of the best (CSPL) and the worst (WD) fit for MY are shown for brevity. A high variability of residuals was found, especially in the last part of lactation (i.e. beyond 700 DIM). A trend can be observed for WD throughout lactation (similar results were obtained by WIL and DF), whereas for LEG the trend was found in the first 150 DIM. CSPL showed a random distribution of residuals (similar results were obtained by QSPL and AS).
Distribution of average residuals (kg/day) for individual extended curves fitted by Wood (WD), and cubic splines (CSPL) models. DIM = days in milk.

Results obtained in this study for individual lactations of standard length agree with previous reports for dairy cattle (Olori et al., Reference Olori, Brotherstone, Hill and McGuirk1999; Macciotta et al., Reference Macciotta, Vicario and Cappio-Borlino2005; Silvestre et al., Reference Silvestre, Petim-Batista and Colaco2006), with a better fit for polynomials (AS, LEG and SPL) compared with models with three parameters. No studies are currently available in the literature on fitting individual extended lactation curves.
For genetic purposes, it may be of interest to have a first look at individual values of extended lactation curve traits. Medians of lactation curve traits for MY in the 600- to 1000-day class are reported in Table 8. Curve traits were similar in most of cases with corresponding values calculated for average curves (Tables 5 and 7). In general they are characterized by a high variability, as expected due to fitting performances.
Median of Yp, Tp, asymptotic yield (b 0) and production at the LTD of individual lactation curves, estimated by AS and modified DF for 600- to 1000-day class length

Yp = production at the peak; Tp = time to the peak; LTD = last test day; AS = Ali and Schaeffer; DF = Dijkstra function.
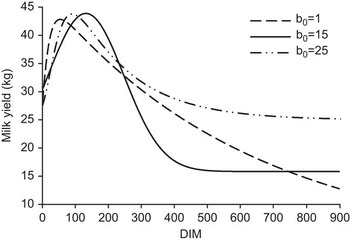
According to the value of asymptotic production estimated by the DF model, that is, bo , individual lactation curves can be grouped into three classes (Figure 8). The first, rather frequent for first-parity cows, is characterized by a decreasing phase after the peak yield with constant slope. The second and the third have a pattern characterized by a variation of the slope occurring at ∼300 to 500 days after calving, and by a tendency to reach an asymptotic level of production. The main difference between these two groups is the level of asymptotic yield. However, it must be remembered that this research, as most of studies on this topic, has been carried out on an archive where extended lactations were in the majority of cases the result of reproductive failures and not the consequence of management choices. Consequently, results obtained in this study need to be validated with an appropriate experimental plan, that also takes account of appropriate management of extended lactation (i.e. specific feeding strategy).
Individual patterns of milk yield (MY) lactation curves with different values of b 0 parameter estimated by modified Dikstra function. DIM = days in milk.

Conclusions
The comparison among seven different functions suggests that models used for describing lactations of standard length can be used also for extended patterns, provided they possess sufficient flexibility. In this study, models with a limited number of parameters were found to be inadequate to fit extended lactations in agreement with results of different authors. On the other hand, a poor prediction ability at the end of extended patterns was highlighted for regression splines, because of their intrinsic ability to fit random perturbation. AS and DF were found to be able to adequately describe both average and individual patterns in standard and extended lactations of Italian Holsteins for MY and PP. A reduced fitting ability was observed for FP and SCS, due to the wide variability of these traits both in standard and extended lactations. The DF was effective in modelling average curves, whereas it experienced computational problems when dealing with individual patterns. This yields a consistent number of lactation curves with very poor fit. These results confirm the reported difficulty for nonlinear models to describe individual patterns. Nevertheless, the DF is able to calculate the asymptotic level of production that is of help for classifying extended lactation shape and could provide useful technical information. The study of genetic basis of these traits may be of great interest for being included as possible goals in breeding programs aimed at modifying the lactation curve shape in an economically desirable direction.
Patterns found for extended lactations in the first phase of production do not differ from those observed in standard lactations, with level and occurrences of peak yield, which did not show substantial variation among lactation length. The second phase of production in lactations exceeding 400 to 500 days tends to an asymptotic level, especially for older cows. These results, confirming previous reports on dairy cattle obtained in other countries, seem to indicate the extension of lactation length as a valid management strategy.
Acknowledgements
Authors wish to acknowledge Prof. Cappio Borlino and the two anonymous referees for their helpful comments and suggestions.