1. INTRODUCTION
The tropopause is the atmospheric boundary between the troposphere and the stratosphere, which has fundamentally different characteristics with respect to the chemical composition and static stability. Many important atmospheric processes including chemical, dynamical, and radiative coupling between the stratosphere and troposphere are crucial for global climate change. As the key transition layer from the upper troposphere to the lower stratosphere, the behaviour of the tropopause is linked to stratosphere-troposphere exchange (STE) and climate variability and change. In climate research, to identify and monitor the tropopause continuously on a long-term basis is an important goal. It is of paramount importance to investigate the structure and the temporal-spatial variation of the tropopause since this will help us enormously in an in-depth understanding of water vapour transport, mass and chemical materials across the tropopause and its impact on global climate and ecological environment (Wu et al. Reference Wu, Yang, Wang, Yuan and Fan2006). For a long time, the tropopause parameters have been determined with radiosonde data and model analyses. However, the poor coverage of radiosonde measurements over polar and ocean regions and low vertical resolution of the models are two obstacles for the precise determination of the characteristics of the tropopause. Global Positioning System (GPS) radio occultation (RO) measurements are superb data sources for the study of the tropopause characteristics.
The concept of retrieving atmospheric profiles from GPS RO measurements was presented by Kursinski et al. (Reference Kursinski, Hajj, Schofield, Linfield and Hardy1997). With this technique, a high-frequency GPS receiver onboard a Low Earth Orbit (LEO) satellite serves as the observation platform. The paths of GPS signals are bent when the signals pass through the ionosphere and the troposphere. With the movements of the GPS and LEO satellites, the bent signal paths sweep over the Earth's atmosphere in a GPS radio occultation event (ROE), which lasts for about one minute. During a rising or a setting of a GPS ROE, phases and amplitudes of radio signals transmitted from the occulted GPS satellite are recorded with a sampling rate of about 50 Hz. These measurements, together with the precise orbits and clock error corrections of the GPS and LEO satellites, are utilised to derive the bending angle profile, from which other atmospheric parameter profiles, such as the refractivity, geopotential height, temperature, pressure and humidity profiles, are inverted accordingly.
The University Corporation for Atmospheric Research (UCAR) performed the first proof-of-concept GPS RO experiment in 1995. Since then, several other GPS RO missions have been launched. These missions include Ørsted, Argentine Satelite de Aplicaciones Cientificas-C (SAC-C), German Challenging Minisatellite Payload (CHAMP), Gravity Recovery And Climate Experiment (GRACE), the Constellation Observing System for Meteorology, Ionosphere and Climate (COSMIC) and Meteorological Operational Polar satellite-A (MetOp-A). With the ability to monitor the terrestrial atmosphere with high precision, good vertical resolution, global coverage, unbiased instrumentation and long-term stability, GPS RO technology provides an ideal data source for the study of the tropopause characteristics (Anthes et al. Reference Anthes, Bernhardt, Chen, Cucurull, Dymond, Ector, Healy, Ho, Hunt, Kuo, Liu, Manning, McCormick, Meehan, Randel, Rocken, Schreiner, Sokolovskiy, Syndergaard, Thompson, Trenberth, Wee, Yen and Zeng2008).
With RO data from the GPS/MET mission, Randel et al. (Reference Randel, Wu and Rios2003) studied the thermal structure and variability of the tropical tropopause. Using observations from CHAMP and SAC-C during 2001 and 2004, the consistency of the tropopause parameters obtained from different RO missions was verified and the variations of the global tropopause parameters including the height, temperature and pressure of the tropopause were analysed (Kishore et al. Reference Kishore, Namboothiri, Igarashi, Jiang, Ao and Romans2006). Using CHAMP RO data from May 2001 to December 2007 and GRACE RO data in July 2006, Schmidt et al. (Reference Schmidt, Wickert, Beyerle and Heise2008) analysed the zonal mean tropopause height and temperature and found that the global tropopause height increased by 26∼44 m during that period. With CHAMP and SAC-C measurements, Wang et al. (Reference Wang and Lv2007) analysed the structure variation of the tropopause over the Tibetan Plateau. In this paper, the tropopause height and temperature over China are studied using GPS RO data from both the CHAMP and COSMIC missions.
2. DATA SOURCE
The GPS RO temperature profiles observed by the COSMIC and CHAMP missions during June 2006 to December 2008 were used in this paper for the study of the tropopause structure over China (N15°∼N55°, E65°∼E135°). The two curves in Figure 1 show the monthly variations in the number of RO temperature profiles over China provided by the two missions respectively. Since the CHAMP RO observations terminated in September 2008, no temperature profiles were obtained from this mission during October to December 2008, as shown in Figure 1. It can be seen that CHAMP provided about 150 to 250 temperature profiles over China each month, except for July 2006, during which CHAMP only provided seven temperature profiles. In the early stage of the operation of the COSMIC mission, the number of RO profiles observed was limited because the constellation did not work stably. Only 466 and 761 temperature profiles over China were observed by this mission in June and July 2006, respectively. The number of monthly regular temperature profiles observed by the COSMIC mission has been larger than 2000 over China since August 2006. The COSMIC constellation is composed of six LEO satellites and each satellite can observe both rising and setting ROEs. In the single satellite CHAMP RO mission, it only observed setting ROEs. The comparison between the two curves in Figure 1 shows that, for the purposes of monitoring regional climate change, COSMIC is superior to CHAMP in terms of the number of atmospheric profiles that can be observed.
Number of CHAMP and COSMIC RO profiles over China.

3. VERIFICATION OF CONSISTENCY OF THE TEMPERATURE PROFILES
With radiosonde observations at co-located sites with the observation time close to that of the RO, the accuracies of the GPS RO atmospheric profiles were analysed in our previous work (Xu et al., Reference Xu and Luo2008). Data provided by both CHAMP and COSMIC were used in this paper for the study of the tropopause structure. It is necessary to verify the consistency of the precision of the temperature profiles from the two RO missions. There were 81232 RO temperature profiles over the time period in the geographical region. Of these temperature profiles, 75365 profiles were provided by the COSMIC mission and 5867 profiles from the CHAMP mission. For the comparison of the results of the two missions, only such pairs whose corresponding times and geographical locations are close enough were used. For the selection of such pairs, here we set the maximum values for the differences in the time and horizontal distance to 2 h and 2°, respectively. Based on these criteria, 454 pairs from the aforementioned temperature profiles were obtained hence used for the analyses and verification of the RO results.
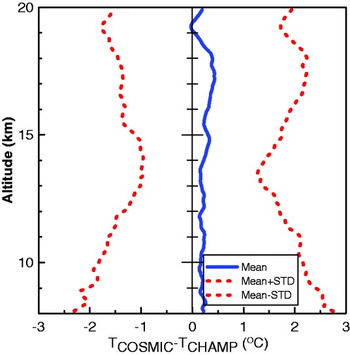
The statistical comparison results of the 454 pairs of temperature profiles are shown in Figure 2. In this figure, the range of the altitude is restricted to 8∼20 km due to the fact that tropopause height falls within this region. The blue solid curve presents the mean bias of temperature from COSMIC to CHAMP. The two red dash lines give the mean bias±its standard deviation at each altitude level. From the results in the whole altitude region, it can be seen that almost all the mean biases are positive, the magnitude of most of these biases are less than 0·5°C and the standard deviations are in the range of 1·2°C–2·5°C, with the smallest value at about 14 km height. These indicate a good overall agreement between the temperature profiles from the two different GPS RO missions. So in the following sections for the study of tropopause structure, data from these two missions are not differentiated.
Statistical comparisons of the CHAMP and COSMIC temperature profiles.

4. THE STRUCTURE AND VARIATION OF THE TROPOPAUSE OVER CHINA
The cold point tropopause (CPT) and the lapse rate tropopause (LRT) are two types of tropopauses that are identified according to the World Meteorological Organization (WMO) (WMO, 1957) criteria. The CPT can be identified by the lowest value in the temperature profile. The LRT is defined as “the lowest level at which the lapse-rate decreases to 2°C/km or less, provided that the averaged lapse-rate between this level and all higher levels within 2 km does not exceed 2°C/km”. In this research, the CPT and LRT are determined from GPS RO temperature profiles. The spatial and temporal variations in tropopause height and temperature over China were analysed accordingly.
4.1. Monthly Mean Tropopause Height and Tropopause Temperature
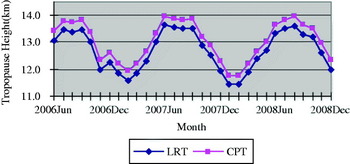
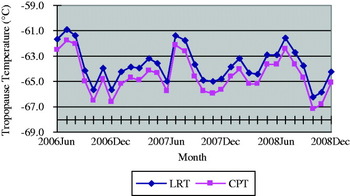
Based on the daily CPT and LRT values from the RO temperature profiles, monthly mean tropopause heights and temperatures can be obtained. Figures 3 and 4 show the results over China during the period from June 2006 to December 2008. From these two figures, the variations in monthly mean tropopause heights and temperatures during this period can be seen.
Figure 3 shows that both the monthly mean CPT and LRT heights vary roughly from 11·5 km to 14 km during the period. Moreover, in each month, the mean CPT height is always larger than the mean LRT height. For the seasonal variation, the monthly mean tropopause heights in winter are lower than in summer, which is true for either CPT or LRT results.
Figure 4 shows that the monthly mean tropopause temperature of both CPT and LRT varies roughly from −67°C to −61°C during the period and also the monthly mean LRT temperature is always higher than the monthly mean CPT temperature. For the seasonal variations, although the variation trend/cycle of the monthly mean tropopause temperature is not as obvious as that of the tropopause height shown in Figure 3, it can still be seen that the monthly mean tropopause temperature in winter (except for June 2007) is lower than in summer for both CPT and LRT results.
Monthly mean tropopause height over China.

Monthly mean tropopause temperature over China.

4.2. Spatial Variation of Tropopause Height and Temperature over Different Seasons
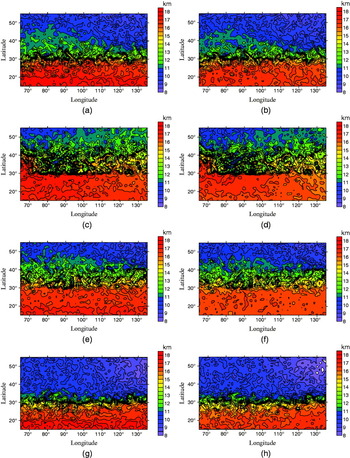
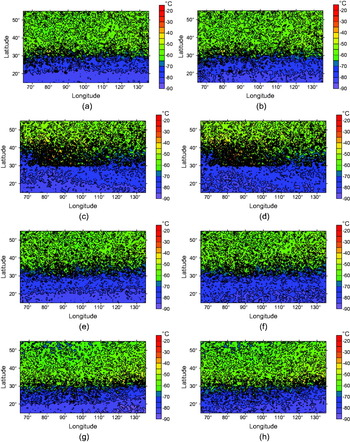
The GPS RO temperature profiles over China were divided into four groups according to the season of the observations from June 2006 to December 2008. The spatial distributions of the LRT and CPT height and temperature in the four seasons are shown in Figures 5 and 6 respectively.
All subfigures in Figure 5 show a similar trend; the lower the latitude region, the higher the tropopause. The distribution of the CPT heights shown in Figure 5 (a) indicates that in spring the CPT heights vary from 15 km to 18 km over the region where the latitudes are in the range of 15°N–30°N. Over the regions where the latitudes are in the range of 30°N–40°N and 40°N–55°N, these values vary from 12 km to 15 km and from 8 km to 12 km, respectively. Comparisons among Figures 5 (a), (c), (e) and (g) show that in all four seasons, the CPT heights in winter are lower than those in summer over the latitudinal region between 30°N and 40°N. Over the region with latitudes below 20°N, the distribution of CPT heights does not change much over the different seasons. From all of the subfigures in Figure 5, one can also see that in each season, the overall trend of the distribution of the CPT heights is similar to that of the LRT heights. The CPT heights are higher than the LRT heights over the region with latitudes below N30°.
Figures 6 (a)–(h) show the distributions of the CPT and LRT temperatures over China in four seasons. It can be seen that in all four seasons, the lowest values of both the CPT and the LRT temperatures are in the region where the latitudes are below N30°. For example, Figure 6 (a) shows that the CPT temperatures vary from −90°C to −80°C, −80°C to −70°C, and −50°C to −60°C over the regions where the latitudes are between 15°N and 20°N, 20°N and 30°N and the region with latitudes above 30°N, respectively. Comparisons of Figures 6 (a), (c), (e) and (g) show that, over the region with latitudes above 30°N, the CPT temperatures in summer are higher than those of the other three seasons. Over the regions with latitudes below 20°N, there is no significant difference among the distributions of the CPT temperatures in the different seasons. In each season, the overall trends of the distributions of the CPT and LRT temperatures are similar and the CPT temperature is slightly lower than the LRT temperature over the region with latitudes below 20°N.
Tropopause height distributions over China during the period of June 2006 to December 2008. NB: Subfigures on the left are for the CPT height and those on the right for the LRT height; and the subfigures from the top to the bottom (four rows) are for the four seasons in the order of spring, summer, autumn and winter.

Tropopause temperature distributions over China during June 2006 to December 2008. NB: Subfigures on the left are for the CPT Temperature and on the right for the LRT Temperature; and the subfigures from the top to the bottom (four rows) are for the four seasons in the order of spring, summer, autumn and winter.

5. CONCLUSIONS AND SUGGESTIONS
With the advantages of high precision and high vertical resolution, the GPS RO technique can provide an ideal data source for the study of the characteristics of the tropopause. In this research, the temperature profiles provided from the two GPS RO missions, CHAMP and COSMIC, were used for the analysis of the variations in the tropopause heights and temperatures over China during the period of June 2006 to December 2008. The consistency of the precision of the temperature profiles from the two missions was verified via a statistical comparison of the CHAMP and COSMIC profiles at co-located sites. The variations in both monthly mean CPT and LRT heights and temperatures were also analysed. The distributions of the CPT and LRT heights and temperatures in different seasons were studied accordingly. The results show that the GPS RO technique can be used to identify the variations in tropopause heights and temperatures in different latitudinal regions and for different seasons.
The rapid development of the next generation Global Navigation Satellite Systems (GNSS) such as Galileo, Compass, etc coupled with many new LEO satellite mission developed by various countries will offer unprecedented opportunities of research and practical operation in GNSS RO technology. The great amount of GNSS RO data will significantly benefit research on the tropopause and global and regional climate change.
ACKNOWLEDGEMENTS
The authors would like to thank the COSMIC Data Analysis and Archive Center (CDAAC) for providing COSMIC and CHAMP RO data. This work is funded through the National Nature Science Foundation of China (No. 40904002, 40804004, 40911120024) and the Scientific Research Foundation for the Returned Overseas Chinese Scholars, China State Education Ministry. Kefei Zhang would also like to acknowledge the funding received from Australian government through the following projects: ARC-Linkage (LP0883288), ISL (CH080253) and the ASRP Stream B – Space Innovation and Research Project.