Introduction
Chickpea (Cicer arietinum L.) is a vital legume crop cultivated extensively worldwide, especially in arid and semi-arid regions. Its nutritional benefits are highly valued, providing essential proteins and nutrients, while also enhancing soil fertility through biological nitrogen fixation (Khaitov et al., Reference Khaitov, Kurbonov, Abdiev and Adilov2016; Phiri et al., Reference Phiri, Njira and Chitedze2023). Globally, chickpea is grown on 14.81 million ha, contributing significantly to food security with a production of 18.09 million tonnes in 2022 (FAOSTAT, 2024). In India, the crop occupies a substantial share of legume cultivation, covering an area of 10.2 million ha with a production of 12.1 million tonnes in 2023−2024 (FAOSTAT, 2024).
Despite its importance, chickpea production faces considerable challenges due to climatic variations. In particular, terminal heat stress during the reproductive phase poses a serious threat, as it can drastically reduce yield potential (Devasirvatham and Tan, Reference Devasirvatham and Tan2018). Temperature is a critical factor in chickpea growth, especially during key developmental stages. While chickpea thrives in cool and dry conditions, exposure to temperatures above 30−35°C during flowering and podding stages induces terminal heat stress, accelerating plant senescence, reducing seed set and significantly lowering yield (Debnath et al., Reference Debnath, Ramakrishnan, Kumawat, Vengavasi, Kumar, Sharma and Samaiya2022; Kaushal et al., Reference Kaushal, Bhandari, Siddique and Nayyar2016). The increasing occurrence of high temperatures, exacerbated by climate change, is making terminal heat stress more frequent during the reproductive phase. Recent global climate assessments indicate that the global mean surface temperature has increased to approximately 1.5°C above preindustrial levels, with 2024 confirmed as the warmest year on record and exceeding 1.5°C above the 1850–1900 baseline (WMO, 2025). Elevated temperatures disrupt physiological processes, such as photosynthesis and transpiration (Maitra et al., Reference Maitra, Pramanick, Dey, Bhadra, Shankar, Anand and Yadav2021; Singh et al., Reference Singh, Paalli, Brar and Kaur2022), by inhibiting root growth and function, limiting nutrient uptake and reducing moisture availability. This stress ultimately diminishes the plant’s ability to cope with heat stress, further impairing growth and productivity (Wu et al., Reference Wu, Ma and Whalen2018).
Understanding the relationship between temperature and crop development is crucial, which is where the concept of heat units and photosynthetically active radiation (PAR) becomes relevant. Heat units such as growing degree days (GDD), helio-thermal units (HTU), photo-thermal units (PTU) and heat use efficiency (HUE) along with PAR are valuable tools for assessing the interaction between environmental factors and crop development (Islam et al., Reference Islam, Alam, Kamal, Zaman, Hossain, Alharby and El Sabagh2019). GDD measure the cumulative effect of temperature over time, aiding in predicting critical growth stages (Islam et al., Reference Islam, Alam, Kamal, Zaman, Hossain, Alharby and El Sabagh2019). For chickpea, the base temperature is generally considered to be 5°C, meaning that temperatures below this threshold do not contribute to plant growth (Nahas et al., Reference Nahas, Interdonato and Romero2019). Tracking heat units provides insights into how effectively a crop utilises available temperature during its lifecycle (Pandey et al., Reference Pandey, Pandey, Dwivedi and Singh2010). Furthermore, HTU and PTU refine this concept by incorporating sunlight and day length, which are essential for chickpea development (Kaushal et al., Reference Kaushal, Bhandari, Siddique and Nayyar2016). These indices are particularly valuable in assessing terminal heat stress, as they quantify the stress experienced by the crop and predict key phenological events such as flowering and podding (Richards et al., Reference Richards, Preston, Napier, Jenkins and Maphosa2020) (see equations listed in M & M).
In addition to heat units, PAR plays a vital role in chickpea development (Lake and Sadras, Reference Lake and Sadras2017). PAR refers to the spectrum of light (400−700 nm) used by plants in the process of photosynthesis and its availability is directly related to crop productivity. Adequate PAR during critical growth stages supports efficient photosynthesis, leading to improved biomass accumulation and yield (Singh et al., Reference Singh, Dhillon, Virk and Sandhu2024). Terminal heat stress can reduce the interception and efficiency of PAR, exacerbating the adverse effects of high temperatures (Basu et al., Reference Basu, Chaturvedi, Gaur, Mondal, Meena, Das and Kimatu2022). Combining the concepts of heat units and PAR allows for a more comprehensive understanding of how environmental factors influence crop performance under stress conditions.
The use of agroclimatic indices and PAR measurements allows for precise predictions of key developmental stages, helping farmers make informed decisions about sowing times and crop management (Tauseef et al., Reference Tauseef, Latief and Kotru2015). Aligning sowing dates with cooler climatic windows can help chickpea avoid the adverse effects of high temperatures. Studies have shown that adjusting sowing dates can mitigate yield losses due to heat stress by 13−15 % globally, underscoring the importance of this agronomic practice (Kaur et al., Reference Kaur, Sandhu, Virk and Singh2023). Early phenology is a crucial strategy for crops to escape late-season heat stress and adapt to short-season environments (Seth et al., Reference Seth, Ghosh, Nath, Hedyatullah and Nanda2020; Venugopalan et al., Reference Venugopalan, Nath, Sengupta, Nalia, Banerjee, Chandran and Hossain2021). Early sowing can help chickpea avoid the adverse effects of high temperatures during the reproductive phase, while late sowing exposes the crop to stress during critical stages, reducing biomass accumulation and pod formation (Basu et al., Reference Basu, Parya, Dutta, Maji, Jena, Nath and Chakraborty2014; Kumar et al., Reference Kumar, Luther, Rao, Rao and Prasad2018; Mathew et al., Reference Mathew, Sanbagavalli and Chinnusamy2017). Optimising sowing time becomes critical for improving crop performance (Singh et al., Reference Singh, Dhillon and Sidhu2019).
In addition to optimal sowing times, straw mulching is another effective strategy for managing heat stress, as it helps regulate soil and canopy temperatures. Mulch not only conserves soil moisture but also reduces temperature extremes in the root zone, thereby maintaining a favourable microclimate for the crop (Danish et al., Reference Danish, Kumar and Sahu2020). By reflecting solar radiation and reducing temperature extremes in the root zone, mulching helps enhance crop growth and resilience in stress-prone environments (Li et al., Reference Li, Chen, Shi, Liu, Wei and Xiong2021; Prem et al., Reference Prem, Ranjan, Seth and Patle2020). Combined with agroclimatic indices, these practices provide an integrated approach to enhance the crop’s resilience to climatic variability such as terminal heat stress (Chaudhary et al., Reference Chaudhary, Chhokar, Yadav, Sindhu, Ram, Rawal and Gill2019; Farooq et al., Reference Farooq, Bramley, Palta and Siddique2011).
Despite the critical threat posed by terminal heat stress to chickpea productivity, limited research has evaluated agronomic strategies such as sowing time and straw mulch as mitigation tools, either individually or in combination. While some studies have highlighted their potential, quantitative assessments using agroclimatic indices and PAR interception in the context of terminal heat stress remain sparse. This knowledge gap is particularly important in regions where delayed sowing frequently exposes chickpea crops to elevated temperatures during flowering and podding stages.
It was hypothesised that early sowing would allow chickpea to escape terminal heat stress, while straw mulch application would provide thermal benefits and improve crop performance, particularly under warmer conditions experienced in late sowing. The specific objectives were (i) to evaluate the effects of different sowing dates and straw mulch levels on agroclimatic indices and PAR interception in chickpea and (ii) to quantify the impact of these treatments on seed yield under varying thermal regimes, particularly under late-sown conditions prone to heat stress.
Materials and methods
Experimental field and treatment details
The experiment was conducted at Pulses Research Farm, Department of Plant Breeding & Genetics, Punjab Agricultural University, Ludhiana, Punjab, India (30°54′ N latitude and 75°56′ E longitude, 247 m elevation above sea level) during Rabi (winter) season of 2021−22 and 2022−2023. The region experiences a semi-arid climate, characterised by very hot summers from April to June and cold winters from December to January.
The study involved three different sowing dates: 1 November, 20 November and 10 December, as the main plot treatments and four levels of paddy straw mulch i.e. 0, 2, 4 and 6 t/ha as sub-plot treatments using split plot design, replicated four times. The paddy straw mulch was applied immediately after sowing.
The crop was sown with the variety PBG 8 in rows spaced 30 cm apart using a seed rate of 45 kg/ha, resulting in a plant population of about 12 plants/m row length. At sowing, nitrogen was applied at 18.75 kg/ha and phosphorus at 20 kg/ha using urea (46 % N) and single superphosphate (16 % P2O5), respectively. The crop was raised as per the recommended package of practices. Manual hand weeding was done at 30 and 60 days after sowing (DAS) to manage weeds. Irrigations were applied based on crop need. To manage gram pod borer (Helicoverpa armigera), chlorantraniliprole was sprayed at 125 ml/ha in 250 l of water. The plants were harvested when they dried out and pods turned brown on each sowing date. Plants were manually harvested with sickles and bundles were made from each treatment.
Observations recorded
The number of days taken to reach key phenological stages, such as 50 % flowering, 50 % podding and maturity, was recorded under various growing environments. Field observations were recorded on every alternate day throughout the crop growth period, and phenological stages were assessed by monitoring 10 randomly selected and tagged plants per plot from the central rows to avoid border effects. The number of days from sowing to 50 % flowering was recorded when approximately half of the tagged plants in a plot had at least one open flower. Similarly, the number of days to 50 % podding was recorded when approximately half of the tagged plants had at least one visible pod. Maturity was recorded as the number of days from sowing to when the majority of leaves on the tagged plants turned yellow and the pods acquired a golden-brown colouration, indicating physiological maturity. During critical growth stages, observations were recorded daily to ensure precision and reliability. Agroclimatic indices, including growing degree days (GDD), helio-thermal units (HTU), photo-thermal units (PTU), pheno-thermal index (PTI), heat use efficiency (HUE) and helio-thermal use efficiency (HTUE), were calculated using the following formulae (Equations 1–5).
Accumulated growing degree days
Accumulated growing degree days (AGDD) were determined by cumulating the daily mean temperatures exceeding the base temperature of 5°C for chickpea. GDD for each phenological stage was computed using the following formula:
 $$\small{\eqalign{ {\rm{AGDD(}}\,^\circ {\rm{C}}\,{\rm{day)}} & = {{{\rm{Maximum}}\;{\rm{temperature}}\; + \;{\rm{Minimum}}\;{\rm{temperature}}\;} \over 2} \cr & \quad - {\rm{Base}}\;{\rm{temperature}} \cr}} $$
Accumulated helio-thermal units
Accumulated helio-thermal units (AHTU) were computed using the following formula:
 $${\rm{AHTU}}\left( {^\circ {\rm{C \ day \ h}}} \right) = {\rm{GDD}} \times {\rm{Actual \ sunshine \ h}}$$
Accumulated photo-thermal units
The formula employed to compute accumulated photo-thermal units (APTU) is as follows:
 $${\rm{APTU}}\left( {^\circ {\rm{C \ day \ h}}} \right) = {\rm{GDD}} \times {\rm{Day \ length}}\,$$
Pheno-thermal Index
Pheno-thermal index (PTI) were calculated using the following formula:
 $$\small{{\rm{PTI}}\left( {^\circ {\rm{C \ day}}/{\rm{day}}} \right) = {{{\rm{GDD}}\;{\rm{consumed}}\;{\rm{between}}\;{\rm{two}}\;{\rm{phenological}}\;{\rm{phases}}} \over {{\rm{Number}}\;{\rm{of}}\;{\rm{days}}\;{\rm{taken}}\;{\rm{between}}\;{\rm{two}}\;{\rm{phenophases}}}}}$$
Photosynthetic active radiation
Photosynthetically active radiation (PAR) observations were recorded at 50 % flowering and 50 % podding stage at four different times: 1000, 1200, 1400 and 1600 h on clear sunny days, using a line quantum sensor (Make, LI-COR Biosciences; Model, LI-190R Line Quantum Sensor; City and Country of Origin: Lincoln, Nebraska, USA). The incoming, transmitted and reflected PAR were measured by positioning the sensor upward on the top of the canopy, at the bottom of the canopy and inverted approximately 10 cm above the soil surface, respectively. The intercepted PAR (%) was calculated using the formula:
 $${\rm{PAR}}\left( \% \right) = {{PAR\left( I \right) - \;PAR\;\left( T \right) - PAR\left( R \right)} \over {PAR\;\left( I \right)}}\; \times \;100$$
where PAR(I), PAR(T) and PAR(R) denote the incident, transmitted and reflected photosynthetically active radiation, respectively.
Yield attributes and yield
The yield attributes and seed yield of chickpea were carefully measured to assess the impact of sowing dates and straw mulch levels. The number of pods/plant was determined by counting all mature and effective pods on five randomly selected plants from each treatment at physiological maturity. The number of seeds/pod was calculated by selecting ten pods at random from different plants in each treatment and counting the number of seeds within them; the average was computed to represent the seeds per pod for the treatment. For seed yield determination, the total biomass from the net plot area was harvested, threshed and cleaned. The weight of the clean seeds was expressed in kilograms per hectare (kg/ha).
Statistical analysis
The effects of sowing dates, straw mulch levels and their interactions on various agrometeorological indices across different phenological stages were analysed separately for the two growing seasons (2021–2022 and 2022–2023) using a split-plot design. Statistical comparisons of treatment means were performed using Fisher’s least significant difference (LSD) test at P < 0.05 (Snedecor and Cochran, Reference Snedecor and Cochran1989). The analyses were performed using CPCS-1 software, developed by the Department of Statistics, Punjab Agricultural University, Ludhiana (Cheema and Singh, Reference Cheema and Singh1991). Regression analysis was conducted to examine the relationship between seed yield and agroclimatic indices such as growing degree days (GDD), helio-thermal units (HTU), photo-thermal index (PTU) and pheno-thermal index (PTI) following the methods of Draper and Smith (Reference Draper and Smith1998). A correlation matrix was also developed to evaluate the relationships among agroclimatic indices and seed yield, providing insights into the factors influencing yield under varying environmental conditions. While the primary analysis was conducted separately for each year to account for distinct climatic variations (as illustrated in Figure 1a and 1b), future analyses could explore combined models incorporating years as a random effect to assess treatment stability across seasons. For PAR data, measurements were analysed based on treatment effects, and observed trends across different times of day (10:00, 12:00, 14:00, 16:00 h) were interpreted descriptively.
(a) Weekly mean maximum temperature, minimum temperature, normal maximum temperature, normal minimum temperature, sunshine h and normal sunshine h during 2021−2022 growing season of crop. (b) Weekly mean maximum temperature, minimum temperature, normal maximum temperature, normal minimum temperature, sunshine h and normal sunshine h during 2022−2023 growing season of crop. (c) Weather records during flowering and podding stages in 2021−2022 and 2022−2023, D1 = 1st November; D2 = 20th November; D3 = 10th December; F50 =50 % flowering; P50 = 50 % podding.

Results
The interaction between sowing dates and straw mulch was non-significant for all measured traits in both years; therefore, only the main effects are presented.
Weather during the growing seasons
The weather during the two growing seasons is illustrated in Figure 1a (2021–2022) and Figure 1b (2022–2023). These figures depict the weekly mean maximum and minimum temperatures, normal temperatures, sunshine h and normal sunshine h. Temperatures at critical growth stages, specifically 50 % flowering and 50 % podding during both years, are presented in Figure 1c. The 2021–2022 growing season exhibited comparatively lower maximum and minimum temperatures during critical growth phases, particularly at flowering and podding stages. Sunshine h were relatively consistent but slightly below normal values. In contrast, the 2022–2023 growing season experienced elevated temperatures and increased sunshine h, especially during flowering and podding stages. These climatic variations significantly influenced agroclimatic indices, heat stress levels and crop phenological progression.
Agroclimatic indices
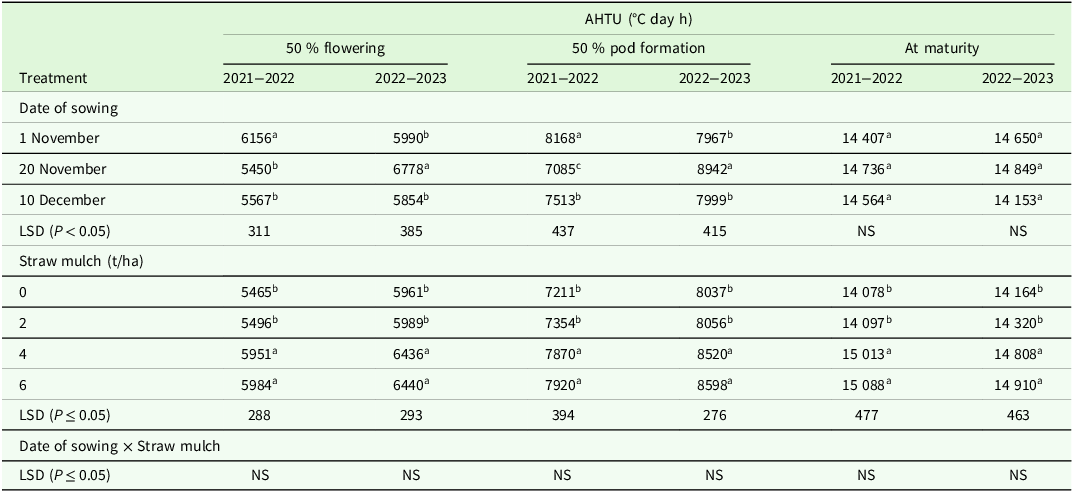
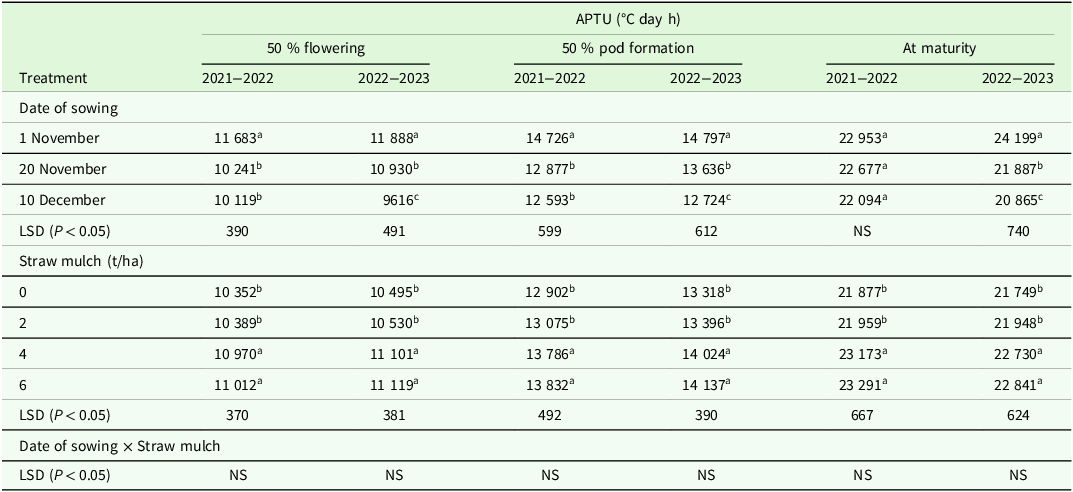
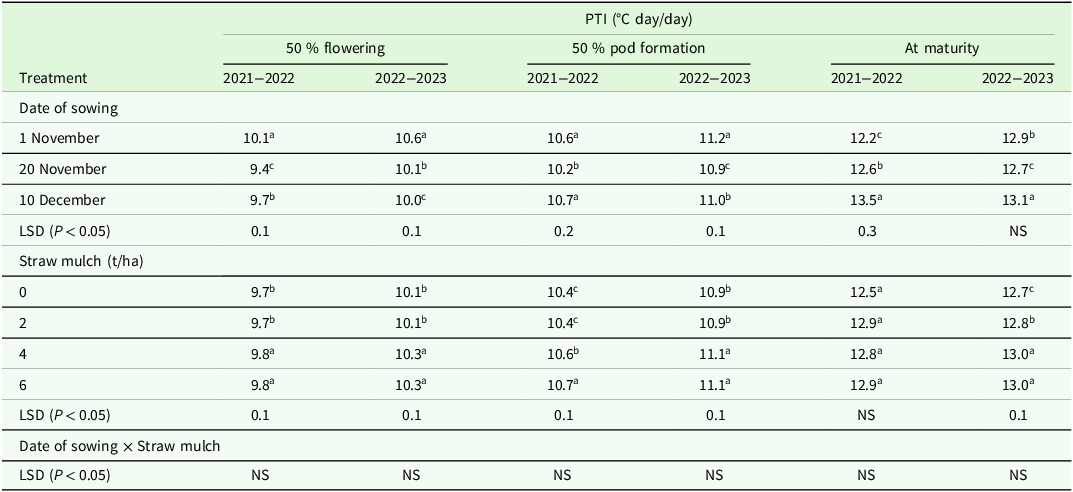
Sowing dates significantly affected the accumulation of thermal indices (Tables 1–4). In 2021–2022, chickpea sown on 1st November accumulated 1110, 1374 and 1964°C days (GDD) at 50 % flowering, podding and maturity, respectively, which were significantly higher than those recorded under 20th November and 10th December sowings. A similar pattern was noted in 2022–2023, where the respective GDD values were 1128, 1384 and 2147°C days. For helio-thermal units (HTU), the highest values at 50 % flowering (6156°C day h) and podding (8168°C day h) were observed in 1 November sowing during 2021–2022. However, in 2022–2023, maximum HTU at flowering (6778°C day h) and podding (8942°C day h) were recorded under 20th November sowing. Photo-thermal units (PTU) followed a consistent trend, with 1st November sowing producing the highest accumulations of 11 683, 14 726 and 22 953°C day h in 2021–2022 and 11 888, 14 797 and 24 199°C day h in 2022–2023, which were significantly greater than later sowings. The pheno-thermal index (PTI) also varied with sowing dates: at flowering, significantly higher PTI was recorded under 1st November sowing in both years, whereas at podding and maturity in 2022–2023, 20th November and 10th December sowings exhibited significantly higher PTI than 1st November.
Effect of date of sowing and straw mulch on accumulated growing degree days (AGDD) of chickpea at different growth stages

All data were compared using the analysis of variance method with the least significance difference test at P < 0.05. Means denoted by a different letter in a column indicate significant differences between treatments (P < 0.05).
LSD, least significant difference; NS, Non-significant.
Effect of date of sowing and straw mulch on accumulated helio-thermal units (AHTU) of chickpea at different growth stages

All data were compared using the analysis of variance method with the least significant difference test at P 0.05. Means denoted by a different letter in a column indicate significant differences between treatments (P 0.05).
LSD, least significant difference; NS, Non significant.
Effect of date of sowing and straw mulch on accumulated photo-thermal unit (APTU) of chickpea at different growth stages

All data were compared using the analysis of variance method with the least significant difference test at P 0.05. Means denoted by a different letter in a column indicate significant differences between treatments (P 0.05).
LSD, least significant difference; NS, Non-significant.
Effect of date of sowing and straw mulch on pheno-thermal index (PTI) of chickpea at different growth stages

All data were compared using the analysis of variance method with the least significance difference test at P ≤ 0.05. Means denoted by a different letter in a column indicate significant differences between treatments (P ≤ 0.05).
LSD, least significant difference; NS, Non- significant.
Straw mulch levels also had a marked effect on thermal indices. Application of 4 and 6 t/ha mulch, which were statistically at par, resulted in significantly higher GDD, HTU, PTU and PTI compared to 0 and 2 t/ha mulch in both years. The latter two treatments (0 and 2 t/ha) were statistically similar to each other.
Photosynthetic active radiation
Early sowing on 1st November consistently intercepted higher PAR at both 50 % flowering and 50 % podding stages throughout the day in both years, particularly during midday (1200 and 1400 h) when solar intensity was higher (Figures 2 and 3). In contrast, later sowing dates, particularly on 10th December, showed reduced PAR interception at 50 % flowering as well as 50 % podding stages throughout the two-year study.
Effect of date of sowing and straw mulch on photosynthetic active radiation (PAR) at 50 % flowering during 2021−2022 and 2022−2023.

Effect of date of sowing and straw mulch on photosynthetic active radiation (PAR) at 50 % podding during 2021−2022 and 2022−2023.

Mulch levels of 4 and 6 t/ha consistently recorded higher PAR interception than 0 and 2 t/ha at both flowering and podding stages across both years.
Yield attributes and yield
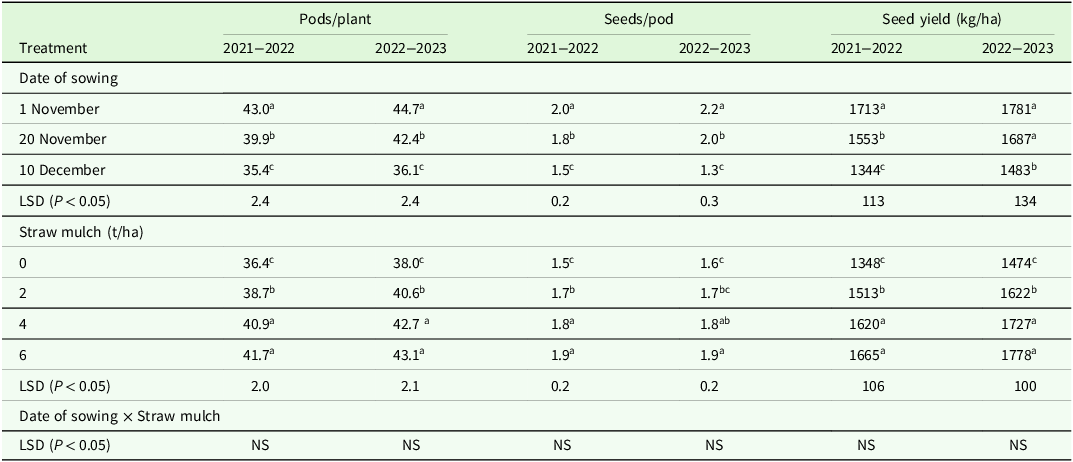
Yield attributes (pods/plant and seeds/pod) and yield followed similar trends to agroclimatic indices and PAR interception. The 1st November sowing produced significantly the highest values with 43.0–44.7 pods/plant, 2.0–2.2 seeds/pod and seed yield of 1713−1781 kg/ha during 2021–2022 and 2022–2023, respectively (Table 5). In contrast, 10th December sowing markedly reduced yield attributes compared with 1st November, with pods/plant declining by 21.4 and 23.8 %, seeds/pod by 33.3 and 46.6 % and seed yield by 27.4 and 20.1 % during 2021–2022 and 2022–2023, respectively. In 2022–2023, yield under 1st and 20th November sowings were comparable, but both were significantly superior to 10th December.
Effect of date of sowing and straw mulch on pods/plant, seeds/pod and seed yield of chickpea

All data were compared using the analysis of variance method with the least significance difference test at P 0.05. Means denoted by a different letter indicate significant differences between treatments (P 0.05).
LSD, least significant difference; NS, Non-significant.
Similarly, straw mulch exerted a positive influence, with 4 t/ha mulch increasing pods/plant by 12–13 %, seeds/pod by 12–20 % and seed yield 17–20 % compared with no mulch. This level was statistically at par with 6 t/ha, indicating that 4 t/ha was the most effective and economical application rate.
Regression of agroclimatic indices on seed yield
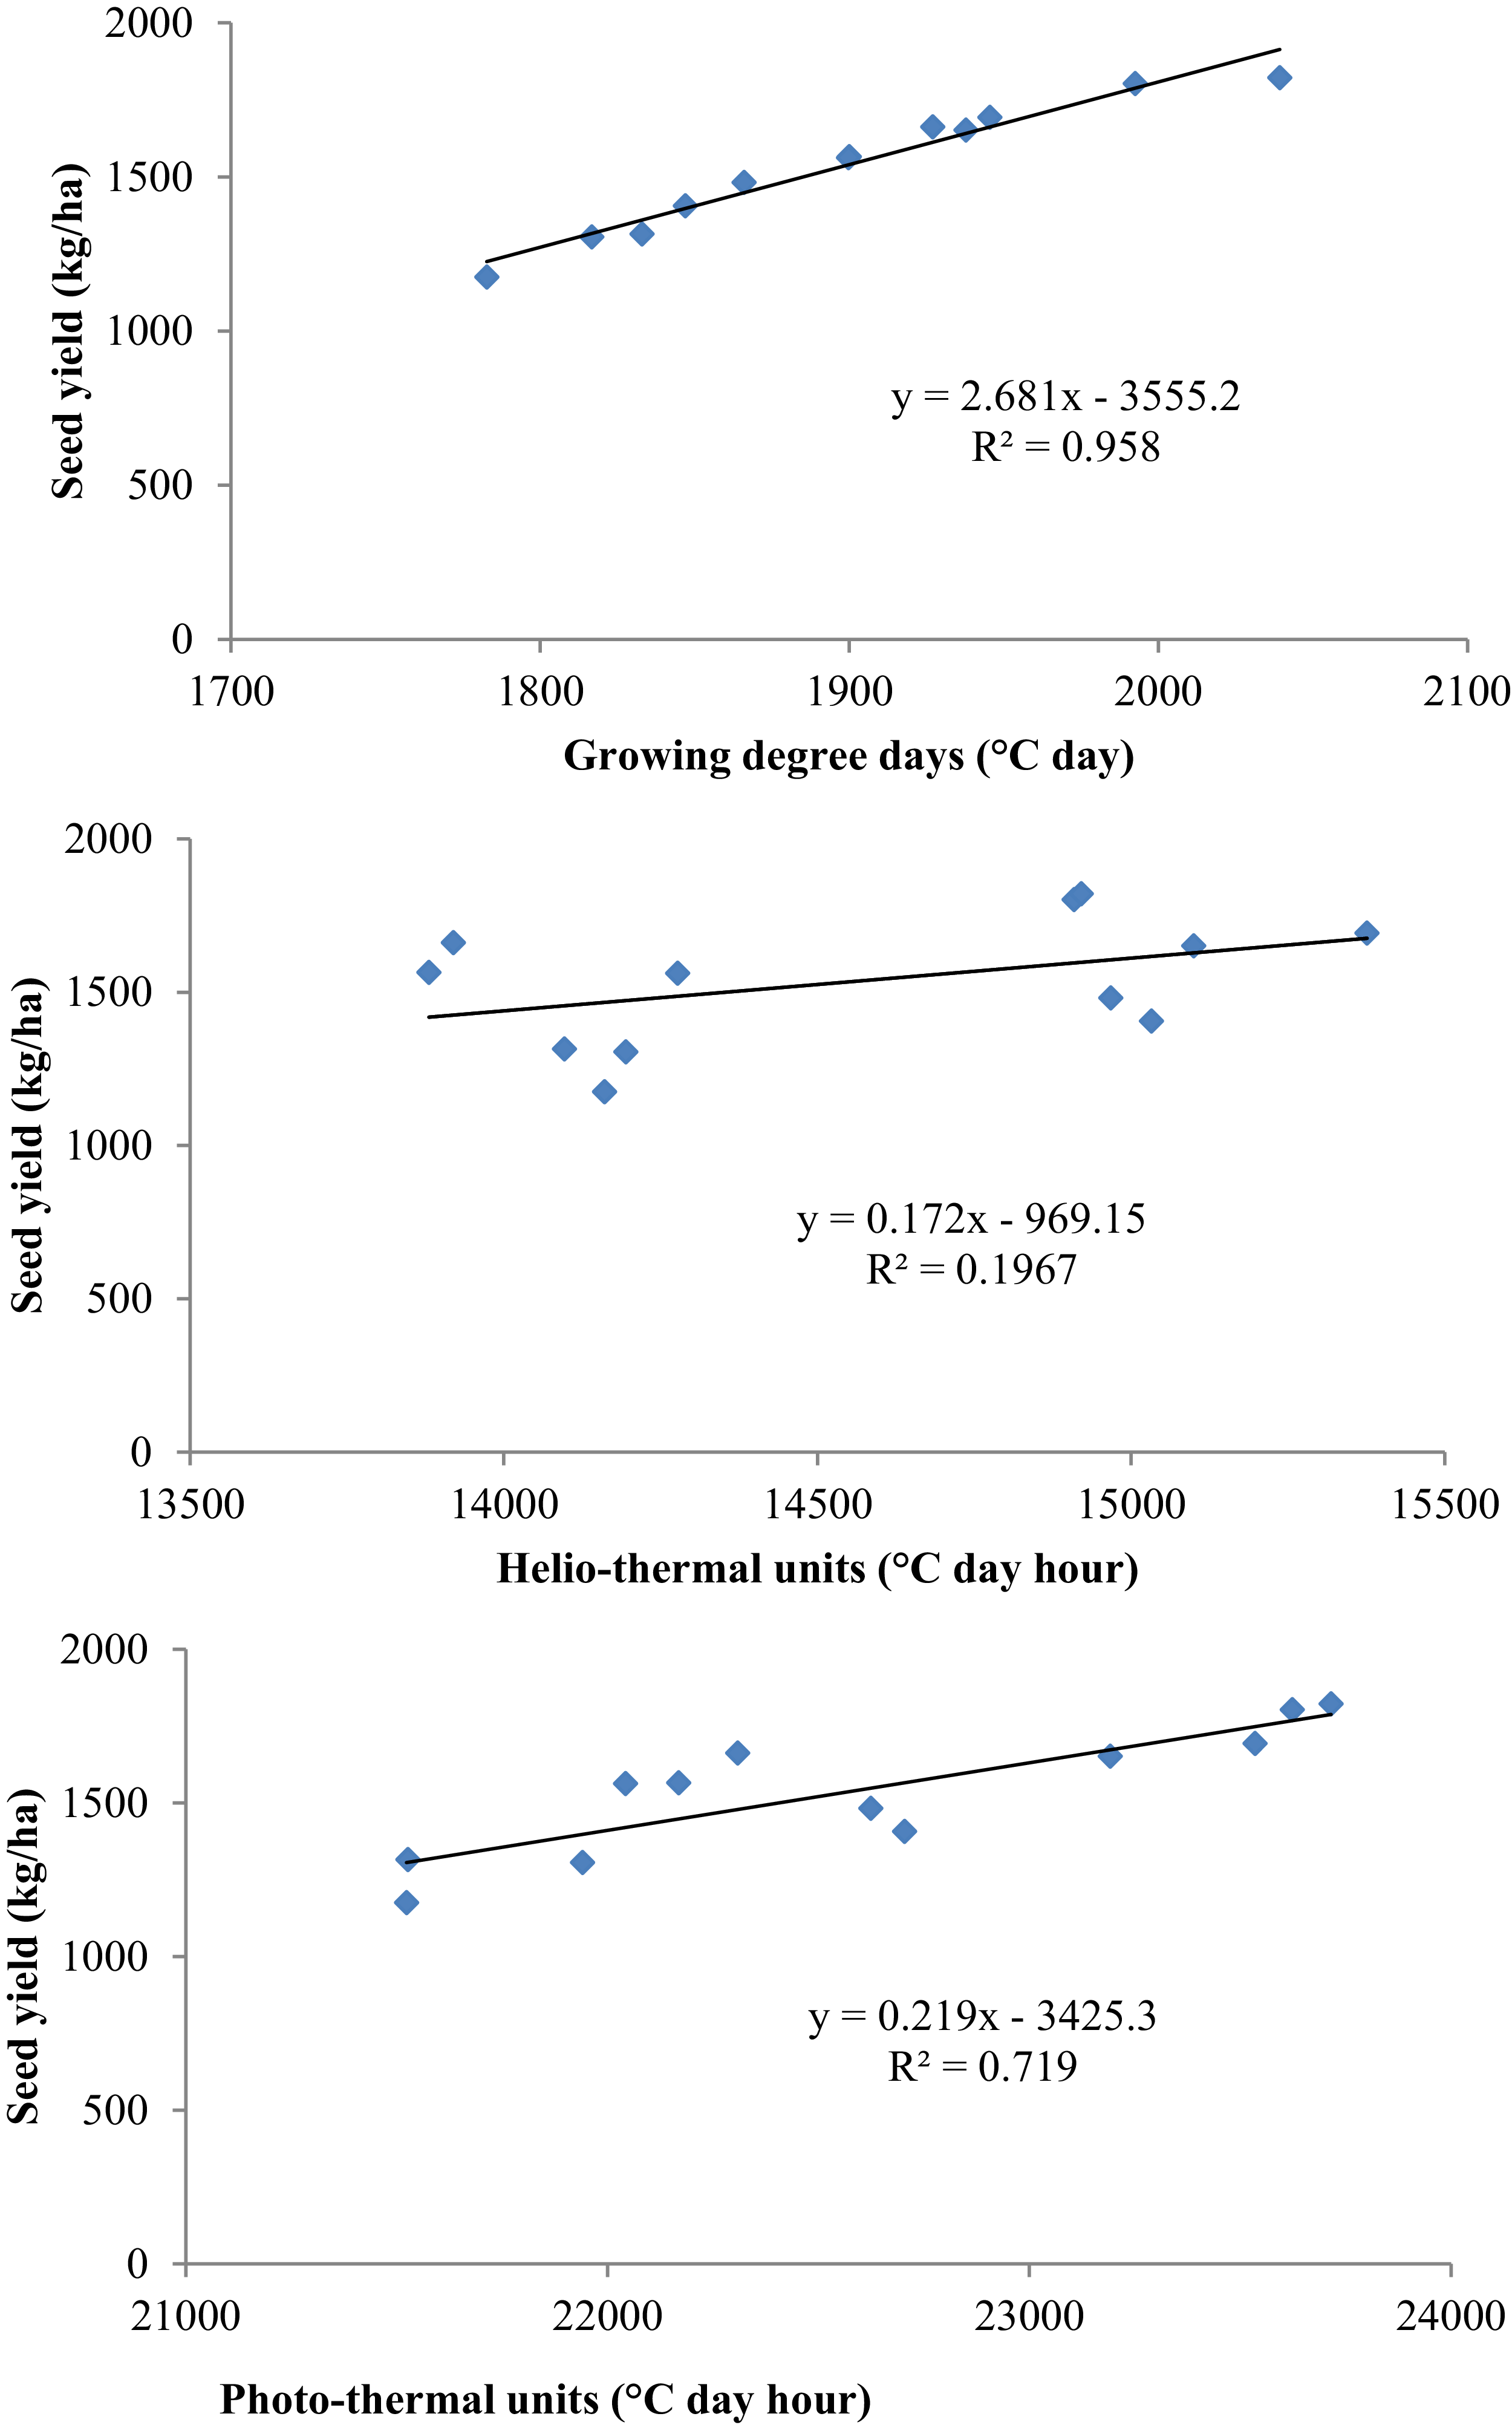
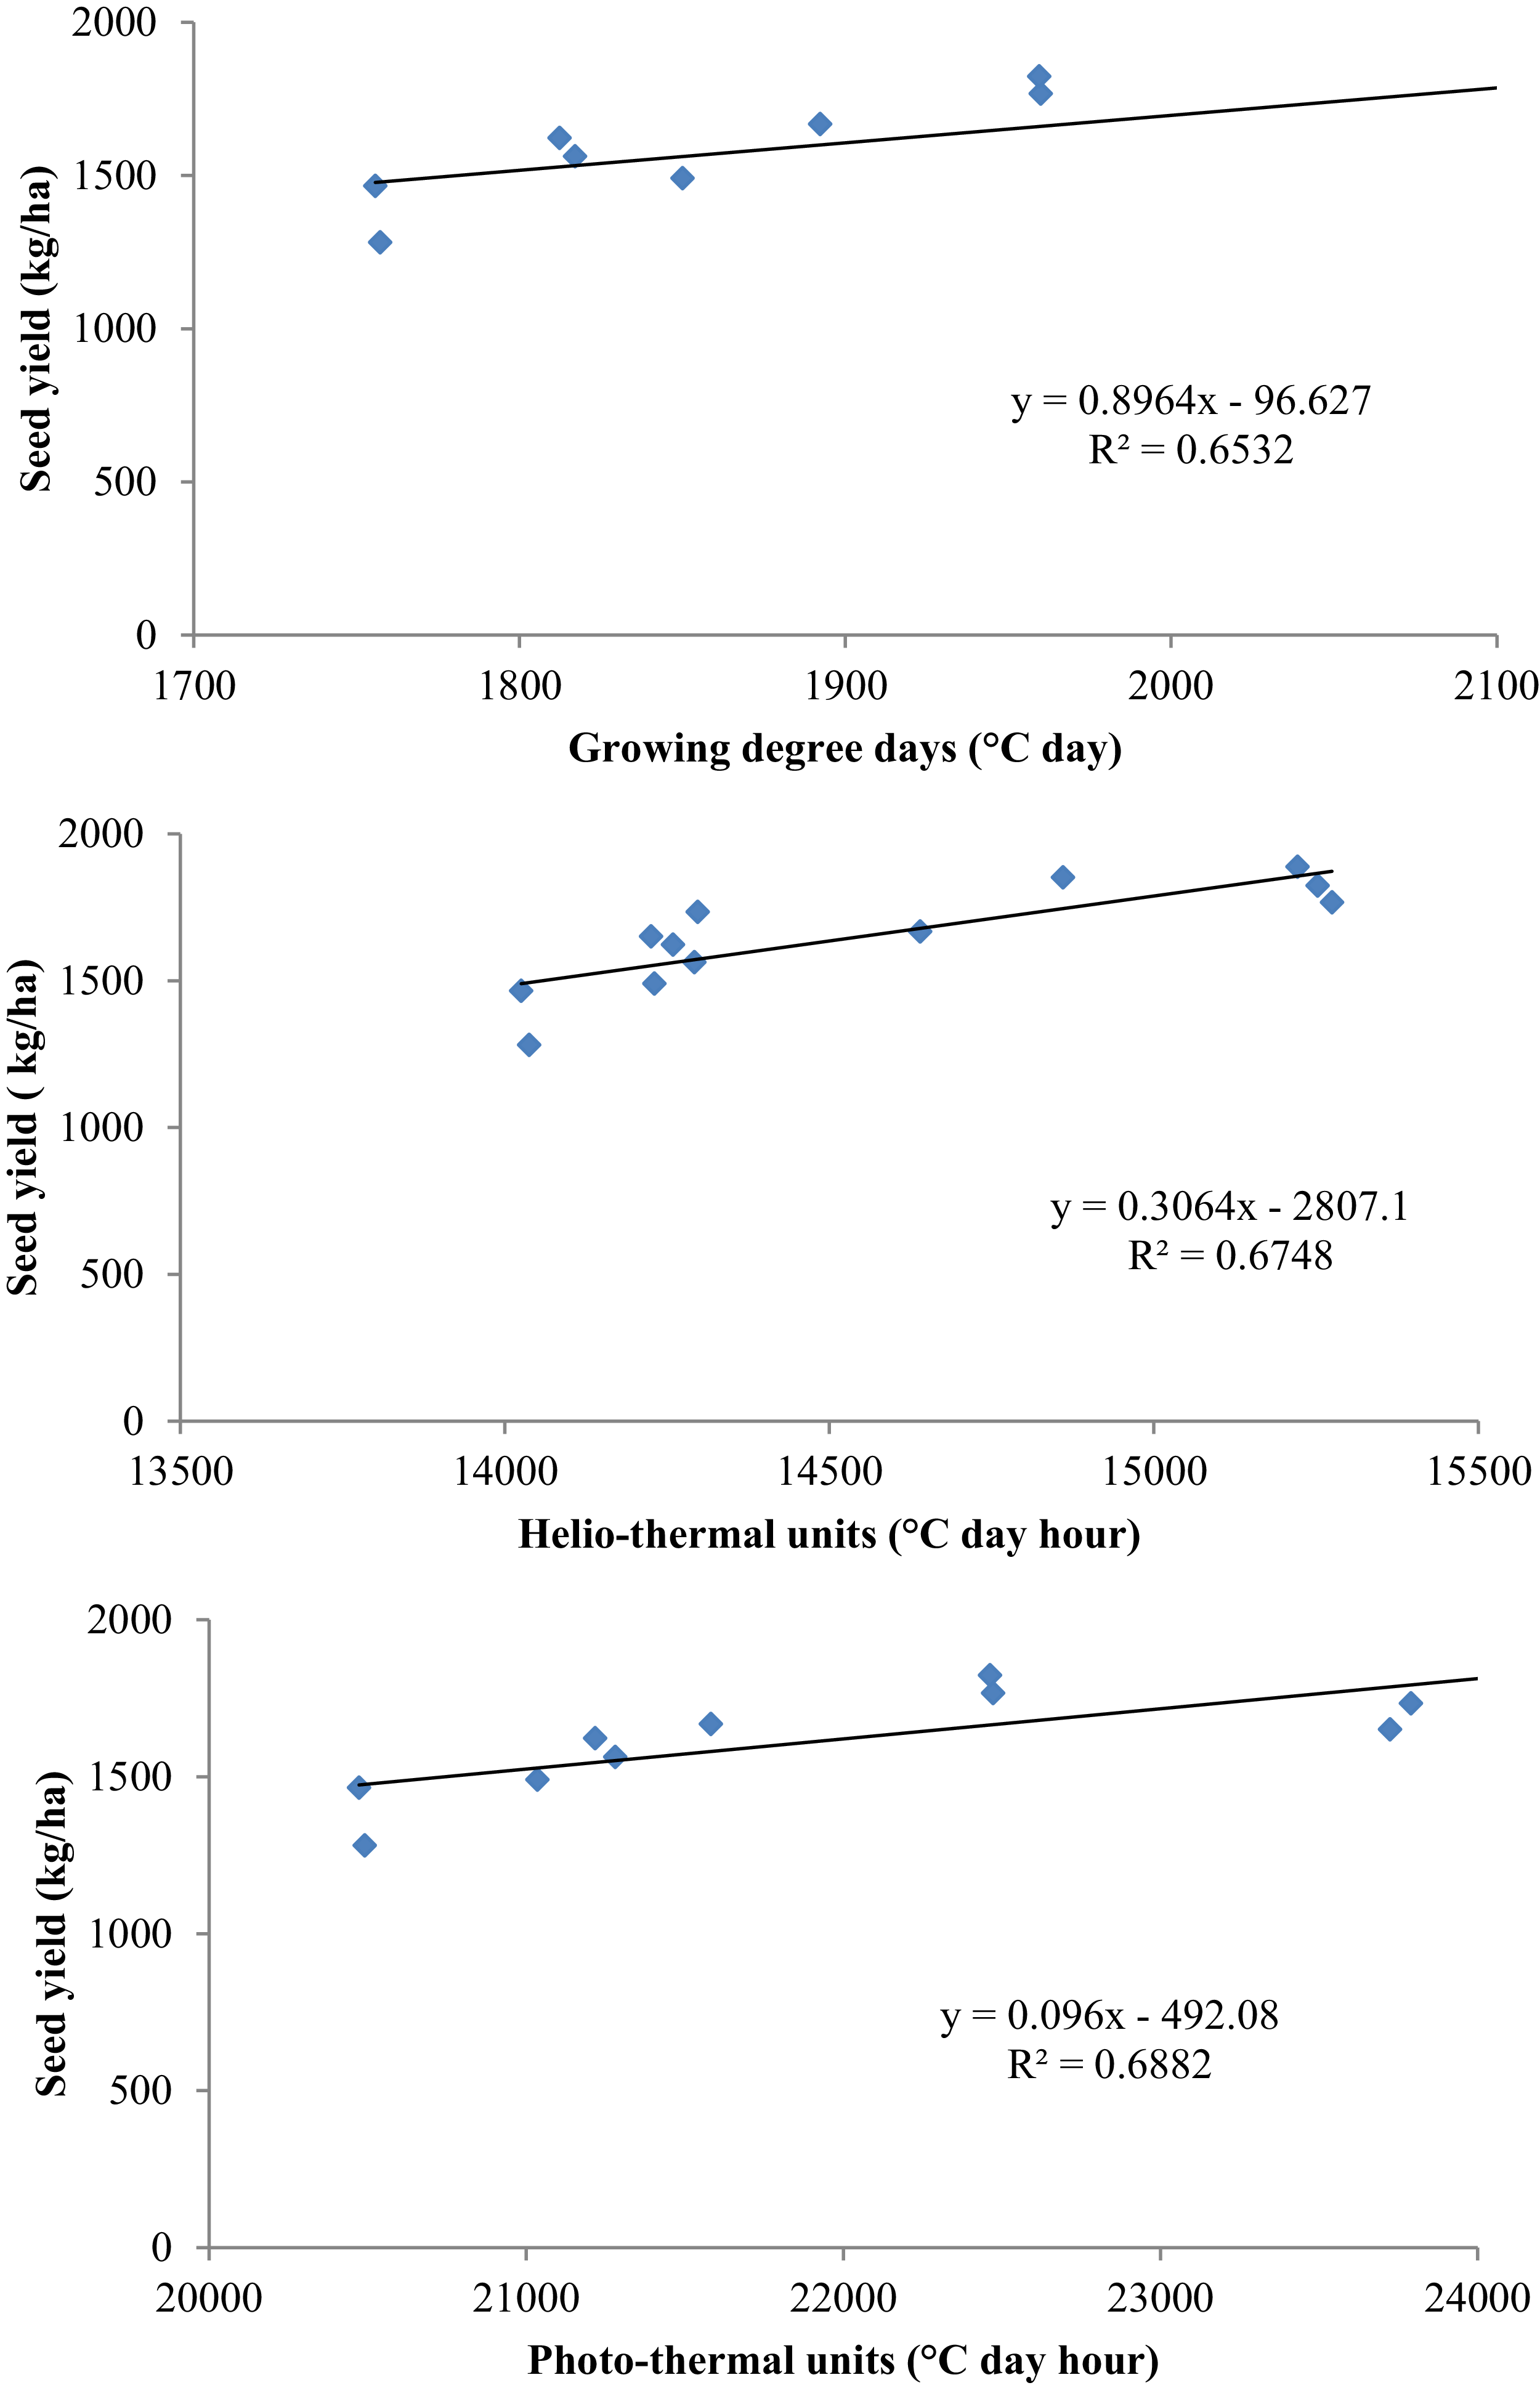
The regression analysis between chickpea seed yield and agroclimatic indices for 2021−2022 and 2022−2023 revealed strong relation, particularly with GDD (Figures 4 and 5). For 2021−2022, GDD exhibited a high R 2 value of 0.96, indicating a strong linear relationship with yield, while the relation of HTU with seed yield was weaker, with R 2 values of 0.19.
Relationship between agroclimatic indices and seed yield during 2021–2022.

Relationship between agroclimatic indices and seed yield during 2022–2023.

In the 2022−2023 season, the regression analysis for GDD, HTU and PTU showed moderate relationship with seed yield having R 2 value of 0.65, 0.67 and 0.69, respectively.
Correlation matrix among agroclimatic indices and seed yield of chickpea
The correlation matrix for the 2021−2022 and 2022−2023 growing seasons reveals relationships among agroclimatic indices and their impact on chickpea seed yield (Figure 6). In both years, GDD showed a strong positive correlation with seed yield (0.98 in 2021−2022 and 0.85 in 2022−2023). Further, PTU also exhibited a high correlation with seed yield (0.85 in 2021−2022 and 0.83 in 2022−2023). HTU and PTU were moderately correlated with each other, but their associations with seed yield differed. Additionally, PTI exhibited a negative correlation with seed yield in both years (−0.55 in 2021−2022 and −0.09 in 2022−2023).
Correlation heat map among various traits of chickpea, GDD (growing degree days); HTU (helio-thermal units); PTU (photo-thermal units); PTI (pheno-thermal index) and seed yield during 2021–2022 and 2022–2023. Green cells indicate positive correlations, with darker green shades representing stronger positive correlations (closer to +1) and lighter green shades representing weaker positive correlations; Pink cells represent negative correlations, where darker pink shades indicate stronger negative correlations (closer to −1) and lighter pink shades indicate weaker negative correlations.

Discussion
Effect of date of sowing on chickpea’s performance under terminal heat stress
Terminal heat stress in chickpea occurs when temperature exceeds 30°C during critical reproductive stages, particularly during pod formation and maturity. This stress accelerates phenological development, shortens flowering and pod-filling duration and triggers early senescence (Debnath et al., Reference Debnath, Ramakrishnan, Kumawat, Vengavasi, Kumar, Sharma and Samaiya2022). The date of sowing primarily determined exposure to terminal heat stress. Early sowing (1st November) allowed reproductive stages to occur under moderate temperature, supporting longer flowering and pod-filling durations. This resulted in significantly the highest pods/plant (43–44.7), seeds/pod (2.0–2.2) and seed yield (1713–1781 kg/ha). These findings are supported by Tiwari and Meena (Reference Tiwari and Meena2016), Ali et al. (Reference Ali, Biswas, Shahriar, Nasif and Raihan2018) and Ray et al. (Reference Ray, Roul, Kapoor, Yadav, Kumari and Mishra2025), who reported that early sowing mitigates terminal heat stress and enables better seed set and filling.
In contrast, late sowing, particularly 10th December, exposed the crop to elevated temperature early in the reproductive phase. Canopy temperatures at 50 % flowering reached 28.2°C compared to 21.1°C under early sowing, rising further to 37.1°C at 135 days after sowing in 2021–2022 (Supplementary Table 1). Such high thermal stress accelerated phenology, reduced flowering and pod-filling duration and lowered reproductive success, leading to reductions in pods, seeds/pod and seed yield. Intermediate stress was observed in the 20th November sowing, resulting in moderate yield reductions, consistent with findings reported by Richards et al. (Reference Richards, Preston, Napier, Jenkins and Maphosa2020) and Kaur et al. (Reference Kaur, Sandhu, Virk and Singh2023).
Although growing degree days (GDD) required to attain specific phenological stages are generally considered relatively stable for a given genotype under non-stress conditions, the present study showed variation in accumulated GDD across sowing dates and years. This variation occurred because exposure to elevated temperatures under late sowing accelerated phenological development and shortened the duration of flowering and pod filling. Consequently, crops reached flowering, podding and maturity with lower accumulated GDD despite higher daily temperatures.
The accumulation of agroclimatic indices – GDD, HTU, PTU and PTI – explains these phenological and yield responses. GDD were higher under early sowing due to longer crop duration, while late sowing reduced GDD because higher temperatures accelerated phenological progression (Kaur et al., Reference Kaur, Sandhu, Virk and Singh2023; Ray et al., Reference Ray, Roul, Kapoor, Yadav, Kumari and Mishra2025; Richards et al., Reference Richards, Preston, Napier, Jenkins and Maphosa2020). HTU, which integrates temperature and sunshine h, was highest under the 20th November sowing (39.9°C/21.5°C vs. 38.2°C/17.6°C for 1st November), reflecting increased solar radiation and warmer conditions. Similar studies have been reported in wheat (Triticum aestivum L.) (El-Shafey et al., Reference El-Shafey2020; Prasad et al., Reference Prasad, Agrawal, Kumar and Prakash2017; Ram and Gupta, Reference Ram and Gupta2016) and chickpea (Kumar et al., Reference Kumar, Khan, Sachan and Maurya2023, Ray et al., Reference Ray, Roul, Kapoor, Yadav, Kumari and Mishra2025), confirming that delayed sowing increases HTU due to higher ambient temperatures. PTU declined with delayed sowing, primarily due to accelerated phenological development under terminal heat stress (Bal et al., Reference Bal, Bhagat, Chowdhury, More, Suman, Singh, Bal, Mukherjee, Choudhury and Dhawan2018), whereas PTI increased, indicating exposure to higher temperatures over a shorter growth period (Mehta, Reference Mehta2020).
Collectively, the agroclimatic indices demonstrate that delayed sowing increases the risk of terminal heat stress by exposing the crop to elevated temperature and radiation during reproductive development, a relationship supported by Ray et al. (Reference Ray, Roul, Kapoor, Yadav, Kumari and Mishra2025). The extended crop duration under early sowing enabled more efficient assimilate partitioning and improved seed filling, contributing to enhanced productivity. During 2022–2023, seed yield differences between the 1st and 20th November sowings were statistically non-significant, reflecting similar temperature trends during the pod formation and maturity. These stable climatic conditions allowed both sowing dates to achieve comparable yield potential. However, 10th December sowing consistently recorded lower yield, highlighting the adverse impact of terminal heat stress during the reproductive phase. These results are corroborated by Kumar et al. (Reference Kumar, Khan, Sachan and Maurya2023), who observed a significant yield advantage in chickpea under earlier sowing due to reduced temperature variability during crop maturation.
Radiation interception (PAR) showed a decreasing trend with delayed sowing, limiting photosynthesis and biomass accumulation. These observations align with findings by Mubvuma et al. (Reference Mubvuma, Ogola and Mhizha2021) and Laelemariam and Worku (Reference Laekemariam and Worku2013), who reported similar trends in reduced PAR interception and biomass under delayed sowing in chickpea and mungbean (Vigna radiata L.), respectively.
Effect of straw mulch on chickpea under terminal heat stress
Straw mulch consistently improved microclimatic and physiological conditions, even though the interaction effect between sowing date and mulch was statistically non-significant. Higher mulch levels (4 and 6 t/ha) contributed to increased GDD, HTU and PTU by prolonged phenological development, allowing plants to accumulate more heat units over an extended growth period. The insulating effect of thicker mulch moderated daily temperature fluctuations, promoting a favourable microclimate that enhanced the plant’s capacity to efficiently utilise solar energy (Ray et al., Reference Ray, Roul, Kapoor, Yadav, Kumari and Mishra2025; Zheng et al., Reference Zheng, Fan, Zhou, Zhang, Liao, Lai and Xiang2022). Pramanik et al. (Reference Pramanik, Bandyopadhyay, Bhaduri, Bhattacharyya and Aggarwal2015), Sidhu et al. (Reference Sidhu, Kang and Kingra2020) and Singh et al. (Reference Singh, Paalli, Brar and Kaur2022) similarly reported that residue retention improved thermal use efficiency in crops by stabilising temperature extremes and extending growth phases.
The effect of mulch on yield components was particularly evident under delayed sowing. Supplementary Tables 2−4 show that under 20th November and 10th December sowings, 4 t/ha mulch increased pods/plant by 4–5 units and seeds/pod by 0.2–0.3 compared to unmulched plots, translating into a 10–15% increase in seed yield. This demonstrates that mulch plays a crucial role in mitigating the intensified terminal heat stress observed in late sowing by stabilising the microclimate and maintaining physiological processes essential for reproductive development. Although, 6 t/ha mulch showed slightly higher values, the differences were statistically non-significant, indicating that 4 t/ha is sufficient to achieve most of the physiological and yield benefits, making it practical and cost-effective. These findings are consistent with Sarkar and Sarkar (Reference Sarkar and Sarkar2018); Archana et al. (Reference Archana, Sampath, Devi and Ravi2021); Deka et al. (Reference Deka, Sheikh, Pathak and Praharaj2021); Dey et al. (Reference Dey, Saren, Debnath, Gudade, Singh, Kumar and Hossain2022), who reveal increases in yield and yield attributes under 5 t/ha paddy straw mulch in chickpea compared to no mulch.
Under late sowing conditions, mulching at 4–6 t/ha effectively lowered canopy temperatures by 2–4°C compared to bare soil by acting as an insulating layer by reducing soil water loss. These results are consistent with Zheng et al. (Reference Zheng, Fan, Zhou, Zhang, Liao, Lai and Xiang2022) and Ray et al. (Reference Ray, Roul, Kapoor, Yadav, Kumari and Mishra2025), who demonstrated the role of mulch in moderating soil and canopy temperatures. While mulch improved performance across all sowing dates, its beneficial effects were especially pronounced under late sowing conditions where ambient temperatures sharply increased. In these scenarios, the presence of mulch helped sustain physiological processes by maintaining a cooler canopy environment and sufficient water availability during critical stages like flowering and pod filling, thereby mitigating the severe yield losses observed in unmulched plots exposed to extreme temperatures. Improved canopy structure and soil surface reflectance further enhanced PAR utilisation, promoting efficient photosynthesis and better yield formation (Bag et al., Reference Bag, Bandyopadhyay, Sehgal, Sarangi and Krishnan2020).
Regression and correlation analysis of agroclimatic indices on seed yield
Regression and correlation analysis of agroclimatic indices on seed yield over two consecutive seasons (2021–2022 and 2022–2023) highlights their critical role in determining chickpea productivity. In 2021–2022, GDD showed a strong association with seed yield, indicating that accumulated heat units were a primary driver of crop maturation and development (Al-Karaki, Reference Al-Karaki2012). However, the relatively weaker correlation observed between HTU and seed yield implies that HTU alone may be a less reliable predictor of yield, potentially due to other interacting environmental variables or stress factors affecting crop development during critical stages.
In the 2022–2023 season, the relationships between GDD, HTU and PTU and seed yield were moderate, suggesting that while thermal units influenced yield, other environmental factors, such as soil moisture and fluctuating temperatures, likely played a role in limiting productivity. The interaction of temperature extremes during critical growth stages may have accelerated crop maturation, reducing time available for seed set and thus impacting yield potential. These findings align with Amrawat et al. (Reference Amrawat, Solanki, Sharma, Jajoria and Dotaniya2013), who reported a linear relationship between agroclimatic indices and seed yield.
The correlation matrix further reinforces these results, showing a strong positive correlation between GDD and seed yield, emphasising the importance of temperature in determining productivity. HTU and PTU were moderately correlated with each other but varied in their association with yield, indicating the combined but variable role of heat and solar radiation in influencing growth. Notably, PTI exhibited a negative correlation with seed yield, suggesting that higher PTI values – reflecting prolonged exposure to elevated temperatures – reduce yield due to accelerated development under terminal heat stress, shortening the time available for seed formation. As global temperatures rise, these indices will become increasingly important for predicting crop performance and optimising management practices to mitigate terminal heat stress effects (Dar et al., Reference Dar, Brar and Yousuf2018; Kaur et al., Reference Kaur, Sandhu, Virk and Singh2023; Ray et al., Reference Ray, Roul, Kapoor, Yadav, Kumari and Mishra2025).
In summary, the results indicate that the date of sowing governs exposure to terminal heat stress, while straw mulch at 4 t/ha effectively alleviates heat and moisture stress, promoting reproductive success and improving yield. The role of agroclimatic indices (GDD, HTU, PTU, PTI) and physiological mechanisms highlights how early sowing and mulching stabilise crop growth and productivity under challenging environmental conditions. These findings suggest practical agronomic strategies to mitigate terminal heat stress in chickpea cultivation, especially under scenarios of rising temperatures and fluctuating rainfall patterns.
Conclusion
Based on the study, it can be concluded that early sowing on 1st November and the application of 4 t/ha of straw mulch are effective strategies for mitigating terminal heat stress and enhancing chickpea yield. Early sowing significantly improved agroclimatic indices such as growing degree days (GDD), helio-thermal units (HTU) and photo-thermal units (PTU), which are critical for supporting sustained crop growth and development under rising temperatures. Furthermore, higher interception of photosynthetically active radiation (PAR), particularly during flowering and pod-filling stages, contributed to improved yield. Under late-sown conditions, the application of 4 t/ha of straw mulch effectively moderated canopy temperature and enhanced PAR utilisation, thereby compensating for the shortened growing period and intensified terminal heat stress. Regression and correlation analyses confirmed strong positive relationships between seed yield and agroclimatic indices – especially GDD and HTU – highlighting their role in heat stress adaptation. Overall, the findings emphasise that while early sowing remains the most effective approach for mitigating terminal heat stress, the use of 4 t/ha straw mulch provides a practical, agronomic intervention to sustain physiological processes and yield stability in chickpea under delayed sowing and adverse climatic conditions.
Supplementary material
The supplementary material for this article can be found at https://doi.org/10.1017/S0021859626100549.
Data availability statement
The data that support this study will be shared upon reasonable request to the first author.
Acknowledgements
The authors are thankful to the Punjab Agricultural University, Punjab, India, for providing necessary facilities during the research work.
Author contributions
Conceptualisation, G. S.; methodology, G. S., S. S.,; writing – original draft preparation, S. S.; writing – review and editing, S. S. and G. S.
Funding statement
This research received no specific grant from any funding agency, commercial or not-for-profit sectors.
Competing interests
The authors declare there are no conflict of interest.