INTRODUCTION
The ubiquitous nature and large population sizes of wild rodents have made them popular systems for studying the dynamics of helminth communities. Such studies have contributed to our understanding of the intrinsic and extrinsic factors shaping the composition of helminth communities, and the prevalence and abundance of the species comprising them. Important extrinsic factors shaping helminth communities include site of host capture (Montgomery and Montgomery, Reference Montgomery and Montgomery1990; Abu-Madi et al. Reference Abu-Madi, Behnke, Lewis and Gilbert2000; Behnke et al. Reference Behnke, Barnard, Bajer, Bray, Dinmore, Frake, Osmond, Race and Sinski2001; Barnard et al. Reference Barnard, Kulis, Behnke, Bajer, Gromadzka-Ostrowska, Stachon and Sinski2003) and year of study (Behnke et al. Reference Behnke, Bajer, Harris, Newington, Pidgeon, Rowlands, Sheriff, Kuliś-Malkowska, Siński, Gilbert and Barnard2008; Grzybek et al. Reference Grzybek, Bajer, Bednarsk, Al-Sarraf, Behnke-Borowczyk, Harris, Price, Brown, Osborne, Siński and Behnke2015). At the level of the host, studies have also revealed significant variation in helminth infracommunities, suggesting that once extrinsic factors have been taken into account, intrinsic host characteristics such as host age (Abu-Madi et al. Reference Abu-Madi, Behnke, Lewis and Gilbert1998; Behnke et al. Reference Behnke, Lewis, Zain and Gilbert1999), diet (Montgomery and Montgomery, Reference Montgomery and Montgomery1990) and sex (Eira et al. Reference Eira, Torres, Vingada and Miquel2006) play a role in structuring communities.
Another structuring force that may affect helminth dynamics is the diversity and nature of the species making up the free-living community of the target host. For example, helminth communities with invasive species may experience quite different helminth dynamics compared with uninvaded communities. Invasive species can impact on parasite dynamics in the native host in three main ways. Parasites that are introduced along with invasive hosts have the potential to spill-over and infect indigenous hosts. This spill-over of exotic diseases has had devastating and well-documented impacts on wildlife (Tompkins et al. Reference Tompkins, Draycott and Hudson2000, Reference Tompkins, Sainsbury, Nettleton, Buxton and Gurnell2002, Reference Tompkins, White and Boots2003; Van Riper et al. Reference Van Riper, Van Riper and Hansen2002).
Invasive hosts can acquire and actively transmit indigenous parasites or act as reservoirs for indigenous parasite species (Hurníková et al. Reference Hurníková, Kołodziej-Sobocińska, Dvorožňáková, Niemczynowicz and Zalewski2016). Spill-back of native parasites is likely an important and underestimated negative impact of species invasions (Kelly et al. Reference Kelly, Patterson, Townsand, Poulin and Tompkins2009). If the invader is a poor reservoir for the parasite, instead of increasing infection its presence could decrease infection prevalence in the native host population causing a dilution effect (Ostfeld and Keesing, Reference Ostfeld and Keesing2000; Keesing et al. Reference Keesing, Holt and Ostfeld2006).
In Ireland, the bank vole (Myodes glareolus formerly Clethrionomys glareolus) is an invasive species first recorded near Listowel, Co. Kerry, in 1964 (Claassens and O'Gorman, Reference Claassens and O'Gorman1965). A small population is thought to have been introduced from Germany in earth moving equipment used during the River Shannon hydroelectrical scheme around 1926 (Stuart et al. Reference Stuart, Mirimin, Cross, Sleeman, Buckley, Telfer, Birtles, Kotlik and Searle2007). The bank vole now occupies approximately one-third of the south-west island of Ireland and is continuing to expand its range at a rate of between 1·79 and 2·5 km year−1 (Montgomery et al. Reference Montgomery, Lundy and Reid2012; White et al. Reference White, Lundy, Montgomery, Montgomery, Perkins, Lawton, Meehan, Hayden, Heckel, Reid and Searle2012).
The rodent fauna of Ireland is relatively depauperate compared with Britain and mainland Europe. Rodents of the family Muridae in Ireland include the brown rat (Rattus norvegicus) and house mouse (Mus domesticus) and one native non-commensal woodland species, the wood mouse (Apodemus sylvaticus) (Marnell et al. Reference Marnell, Kingston and Looney2009). No Arvicolinae rodents occurred prior to the introduction of the bank vole. The wood mouse and, where it is present, the bank vole are the dominant woodland rodent species in Ireland.
This vole–mouse system in Ireland has several features, which make it a useful model for studying the effects of host species composition on parasite dynamics. The bank vole is unusual among the arvicoline rodents, showing ecological characteristics similar to mice (Muridae). Unlike other voles, which are found in open habitats, bank voles are strongly associated with areas of heavy vegetation and show food preferences that are intermediate between insectivorous/granivorous Muridae and herbivorous arvicoline rodents (Kikkawa, Reference Kikkawa1964; Butet and Delettre, Reference Butet and Delettre2011). They therefore have ecological similarities to the Irish wood mouse. Rodent species that share similar ecologies also have similar parasite communities (Begon et al. Reference Begon, Hazel, Baxby, Bown, Cavanagh, Chantrey, Jones and Bennett1999).
Using the vole–mouse system, we set out to compare parasite dynamics in an invaded and uninvaded host community. We investigated the helminth component and infracommunities of wood mice over 2 years and in four sites. In two of the sites, wood mice occurred sympatrically with the invasive bank vole, while the remaining two sites are outside of the present range of bank voles in Ireland. Both extrinsic (site and year) and intrinsic factors (host age and host sex) were included in our analyses.
MATERIALS AND METHODS
Four sites were chosen in Ireland, two located in bank vole invaded areas and two in uninvaded areas. Trapping was carried out in the autumn of 2011 and 2012. Invaded sites are within the present range of the bank vole in Ireland. These were Coole Nature Reserve (53°07·809′N; −8°85·771′W) and Unclin Wood, Merlin Park (53°27·836′N; −8°99·835′W), both located in County Galway. The bank vole was first recorded in County Galway in 1985 (Fairley, Reference Fairley1985) and within the Galway City area in 2003 (McHugh and Lawton, Reference McHugh and Lawton2005). Coole Nature Reserve is part of the Coole-Garryland complex special area of conservation. Vegetation comprises mixed deciduous forest, mainly oak (Quercus robur), ash (Fraxinus excelsior) and hazel (Corylus avellana) and a ground layer of ivy (Hedera helix). The woodland included patches of conifer stands where ground cover was scarce. Unclin Wood in Merlin Park is urban woodland situated on the eastern edge of Galway City. The woodland was similar to Coole Nature Reserve, consisting of native oak–ash–hazel broadleaved woodland and conifers.
Outside the present range of the bank vole is Knocksink Wood Nature Reserve (53°20·117′N; −6°.18·650′W) located in the Glencullen River Valley north of Enniskerry, Co. Wicklow. The woods consisted of mixed deciduous trees, oak being the most abundant with ground cover of bracken, brambles and herbaceous plants. The second site was Santry Woods (53°39·92N; −6°25·066W), a small patch of woodland in Santry, Co. Dublin, located on the periphery of Trinity College Dublin playing grounds and adjacent to a public park. The periphery of the wooded area was overgrown with nettles and brambles while the interior of the wooded area comprised mixed deciduous trees, mainly chestnut (Aesculus), and sycamore (Acer) with ground cover consisting mostly of brambles, ground ivy and nettles.
Longworth traps, baited with peanuts and bedded with hay, were placed in pairs 10 m apart along straight line transects and left in situ overnight. Sites were initially trapped for three consecutive nights and then revisited if needed until a minimum sample size of at least 15 wood mice per site were obtained, as recommended by Jovani and Tella (Reference Jovani and Tella2006). Sampling protocols were chosen to minimize animal stress and suffering. Traps were collected early morning and animals were euthanized as soon as possible. We deeply anaesthetized animals with 96% isoflorane prior to cervical dislocation to minimize handling of the animals and to reduce pain, suffering and distress in line with Directive 2010/63/EU. The entire intestinal tract from oesophagus to anus was removed and stored in 70% alcohol until examination. The surface of the liver and body cavity were checked and any adult or juvenile helminths were removed and stored. Helminths were identified from the published literature (Harvey and Channon, Reference Harvey and Channon1956; Tenora et al. Reference Tenora, Henttonen and Haukisalmi1983; Montgomery et al. Reference Montgomery, Montgomery and Dunn1987; Justine and de Roguin, Reference Justine and de Roguin1990; Khalil et al. Reference Khalil, Jones and Bray1994; Loos-Frank, Reference Loos-Frank2000). Molecular analysis of Aspiculuris sp. samples confirmed this species was Aspiculuris tianjinensis, as reported in Behnke et al. (Reference Behnke, Stewart, Bajer, Grzybek, Harris, Lowe, Ribas, Smales and Vandegrift2015).
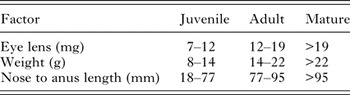
Eye lenses were dissected out and stored in 10% formalin for at least 3 months. After this, time lenses were removed from formalin, washed in deionized water and dried in a fan-assisted oven at 60 °C for 48 h. The weights of both lenses were recorded to the nearest 0·0001 g. Eye lens weight and the morphometric measures of body weight and nose-to-anus length were fitted to a principal component analysis. Principal component 1 was then used to order the mice and allocate them to three age classes: juvenile, adult and mature (Table 1). Visual assessments of maturity were used to help allocate mice at the limits at each category. To ensure that all the chosen morphometric measures increased through the age classes, two-way Generalized Linear Models (GLMs) were fitted with each parameter as the dependent variable and age class and sex as explanatory variables (Behnke et al. Reference Behnke, Barnard, Bajer, Bray, Dinmore, Frake, Osmond, Race and Sinski2001).
Approximate ranges of morphometric measures used to assign wood mice to three age classes

Relative population size for each year and site was calculated as the number of successful trappings during the first 3-day trapping session, divided by the number of traps laid out.
Helminth community structure was statistically analysed at two hierarchical levels: component community and the infracommunity (Bush et al. Reference Bush, Lafferty, Lotz and Shostak1997). Community structure was measured following methods described by Kennedy and Hartvigsen (Reference Kennedy and Hartvigsen2000) and Behnke et al. (Reference Behnke, Barnard, Bajer, Bray, Dinmore, Frake, Osmond, Race and Sinski2001). Measures of component community structure included:
-
• Total species richness
-
• The Berger–Parker Dominance Index. This index measures the proportion of the sample made up by the dominant species. The dominant species is the species showing the highest proportion in each dataset. The index is calculated as d = N max/N where N max is the number of individuals of the most abundant species and N is the total of all individuals in the sample.
-
• Simpson's Index of Diversity calculated as
 $D = 1 - {{\left( {\mathop \sum \nolimits in(n - 1)} \right)} / {N(N - 1)}}$
where n is the total number of individuals of a particular species and N = the total number of individuals of all species. Simpson's Index takes into account both the number of species present and the relative abundance of each species. As species richness and evenness increase, so diversity (D) increases.

Measures of infracommunity structure included:
-
• Mean species richness – the average number of parasite species per host (Montgomery and Montgomery, Reference Montgomery and Montgomery1989).
-
• Maximum number of species per host.
-
• Infracommunity diversity was measured by the mean and maximum Brillouin's Index, appropriate for fully censused communities (Pielou, Reference Pielou1966). The index was calculated per host (infected and uninfected) as
${\rm HB} = {{\left( {\ln (N!) - \mathop \sum \nolimits {\rm ln}(ni!)} \right)} / N}$
, where N is the total number of individuals in the sample, ni is the number of individuals of species i, ln(x) refers to the natural logarithm of x. -
• Prevalence (%) is defined as the number of hosts infected with one or more helminth species divided by all hosts examined (Bush et al. Reference Bush, Lafferty, Lotz and Shostak1997).

All statistical analyses were performed in the R statistical computing environment (R Development Core Team, 2010) version 3·0·2 with additional tools from statistical packages cited in text. Prevalence data were calculated with Clopper–Pearson exact 95% confidence intervals (%±CI) using the function ‘exactci’ in the R package PropCIs (Scherer, Reference Scherer2010). Abundance data were calculated with the standard error of the mean (±s.e.m.)
GLMs are recommended for the analyses of aggregated parasite data (Wilson and Grenfell, Reference Wilson and Grenfell1997; O'Hara and Kotze, Reference O'Hara and Kotze2010). Abundance was modelled with the modified negative binomial GLM from the MASS package (Venables and Ripley, Reference Venables and Ripley2002). Full factorial models incorporated all factors. For the purpose of analyses, sites were combined into uninvaded and invaded sites. Factors included measures of age class (three levels: juvenile, adult, mature); sex (two levels: female, male); site (two levels: uninvaded, invaded) and year (two levels: 2011, 2012). Models were simplified using the step procedure to derive the minimal sufficient model and the significance of remaining factors was determined by removing them from the model and testing for changes in deviance with χ 2 test for binomial and Poisson errors; likelihood ratio tests (LR) for negative binomial errors and F test for quasi-Poisson errors. Residual deviance of the simplified model was used to perform a goodness-of-fit test for the overall model. Models were said to fit reasonably well when the goodness-of-fit χ 2 test was not statistically significant. Where models could not be fitted satisfactorily, non-parametric tests were used to examine each of the main effects in turn. Mann–Whitney U test was used for two group comparisons and the Kruskal–Wallis test for comparisons with more than two groups.
RESULTS
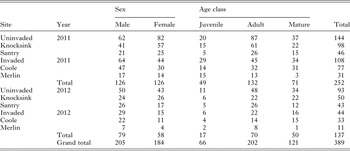
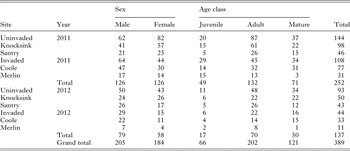
A total of 389 A. sylvaticus were collected and analysed over 2 years of sampling. In invaded sites, 177 bank voles were also collected, and no bank voles were found in uninvaded sites (Loxton et al. Reference Loxton, Lawton, Stafford and Holland2016). Table 2 summarizes the population structure by year, site, age class and sex. The sex ratio was 52·7% of wood mice male and 47·3% female. More wood mice were caught in 2011 (64·8% of the total sample) compared with 2012 (35·2%).
Number of wood mice sampled by site, year, sex and age class
Age classes
All models showed a highly significant main effect of host age, and in all cases, morphometric measures increased through the age classes: mean weight (F 2, 389 = 239·2 P < 0·001), mean body length (F 2, 389 = 38·1, P < 0·001) and eye lens (F 2, 389 = 431·73, P < 0·001). For body weight, there was also a significant main effect of sex (F 1, 389 = 21·6, P < 0·001), males (19·1 g±s.e.m. 0·26) being heavier than females (17·9 g±s.e.m. 0·25). Approximate range of values for each measure assigned to the age classes are given in Table 1.
Helminth community structure
Helminth fauna of wood mice in Ireland
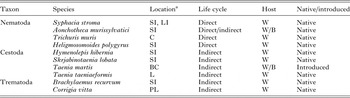
Ten helminth species were recovered from wood mice in Ireland (Table 3). These included eight adult intestinal helminths species; four nematodes, two cestodes and two trematodes. A further two species of larval cestode were recovered; the strobilocercus of Taenia taeniaeformis and the fimbriocercus of the cestode Taenia martis (see Chervy, Reference Chervy2002 for terminology). All the helminth species found in the present study have been recorded in wood mice in previous Irish studies except for T. martis (Langley and Fairley, Reference Langley and Fairley1982; O'Sullivan et al. Reference O'Sullivan, Small and Fairley1984; Montgomery and Montgomery, Reference Montgomery and Montgomery1988, Reference Montgomery and Montgomery1989, Reference Montgomery and Montgomery1990). The number of helminth species recorded at sites ranged from 4 to 9 species.
Helminth species recovered from wood mice by taxon, location within the host, life cycle, host species and native or introduced status

a Locations within the host are indicated by SI, small intestine; LI, large intestine; C, caecum; BC, body cavity; PL, pancreatic lobes and L, liver.
W, wood mouse; B, bank vole.
The helminth species composition at each site was very similar between years. Differences were the appearance of Aonchotheca murissylvatici in Santry and Knocksink in 2012 and the disappearance of A. murissylvatici and Hymenolepis hibernia from Merlin in 2012 (see Supplementary Materials).
Component community structure of helminths of wood mice
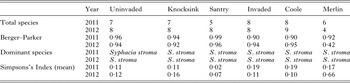
Syphacia stroma was the dominant helminth species recovered at all sites in both years. The Berger–Parker Dominance Index was 0·90 or above for all sites in both years except Merlin in 2012 where S. stroma only made up 42% of the total helminths recovered (Table 4). The dominance of S. stroma was reflected in the low values of the Simpson's Index of Diversity. Simpson's Index of Diversity was highest in Merlin in 2012 where S. stroma was least dominant (Table 4).
Helminth component community measures in wood mice by year and site

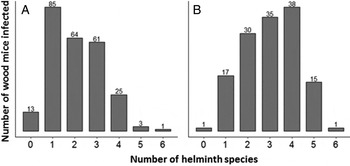
There was a marked increase in the number of species carried by wood mice in 2012, as shown by the change in the shape of the frequency distribution of species richness (Fig. 1). The majority of wood mice in both years were infected with more than one helminth species with co-infections increasing from 60·7% in 2011 to 86·7% in 2012. The number of wood mice from which no helminths were recovered decreased from 5·2% (13) to only a single wood mouse (0·75%) in 2012.
Frequency distribution of helminth species richness in wood mice in 2011 (A) and 2012 (B). Host number is indicated above the bars.

Infracommunity structure of helminths of wood mice
Nematodes made up the bulk of infracommunities overall (276·6±24·3), followed by trematodes (6·07±0·60) and cestodes (0·25±0·01). The mean number of helminths recovered from wood mice increased in 2012 by 101·4%. The increase occurred at all sites except Merlin. The biggest increase in mean abundance was in the cestodes, which increased by 866·7% in 2012.
Species richness
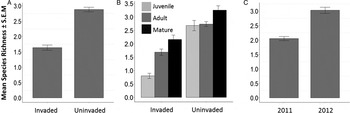
Over the 2 years of the study, mean species richness in wood mice was 2·40 (±0·07) (see also Supplementary Table S2). Site was the most important factor determining differences in mean species richness, with species richness greater in uninvaded sites (GLM, family = Poisson, site: χ 2 1 = 21·0, P < 0·001, Fig. 2A). There was increase in species richness in 2012 (GLM, family = Poisson, year: χ 2 1 = 20·7, P < 0·001, Fig. 2C). Intrinsic factors also had an influence on species richness (GLM, family = Poisson, age class: χ 2 2 = 4·23, P < 0·001, Fig. 2B) with species richness increasing through the age classes. A site:age class interaction showed juveniles carried proportionally more helminth species in uninvaded than invaded sites (GLM, family = Poisson, site:age class: χ 2 2 = 11·1, P < 0·05, Fig. 2B).
Mean species richness (±s.e.m.) of helminths in wood mice. Species richness by site (A), site and age class (B) and year (C).

Brillouin's Index of Diversity
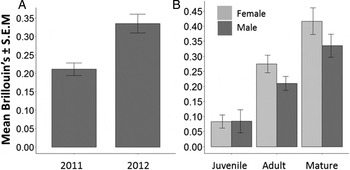
Brillouin's Index of Diversity increased in 2012 (GLM, family = Gaussian, year: χ 2 1 = 9·45, P < 0·01, Fig. 3A). There was also a significant influence of host age with Brillouin's Index increasing from juveniles to mature wood mice (GLM, family = Gaussian, age class: χ 2 2 = 14·8, P < 0·001) with a more rapid rate of increase from juveniles to older age classes in female wood mice (GLM, family = Gaussian, sex:age class: χ 2 2 = 6·79, P < 0·05, Fig. 3B). There was also a significant three-way interaction between site, sex and age class (GLM, family = Gaussian site:sex:age class χ 2 2 = 8·58, P < 0·5).
Mean Brillouin's Index of Diversity (±s.e.m.) of helminths in wood mice. Mean Brillouin's Index by year (A) and age class and sex (B).

PREVALENCE AND ABUNDANCE
Syphacia stroma
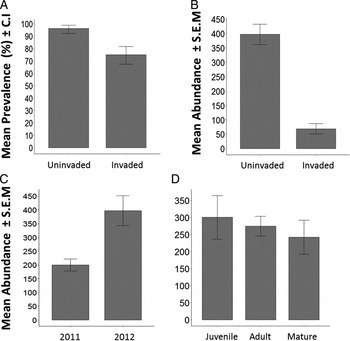
Syphacia stroma was the most prevalent and abundant helminth at all sites. Overall, 342 (87·9%, CI: 84·3–91·0) wood mice were infected. Site affected prevalence (GLM family = binomial, site: χ 2 1 = 36·4, P < 0·001, Fig. 4A) with the combined uninvaded sites having greater mean prevalence.
Mean prevalence (% ±CI) and mean abundance (±s.e.m.) of Syphacia stroma in wood mice. Prevalence by site (A). Abundance by site (B), year (C) and age class (D).

Full factorial abundance models could not be fitted for S. stroma, nor could simpler models without interaction terms; therefore, non-parametric tests were used. Mean abundance was significantly higher in the combined uninvaded site (Mann–Whitney U test, site: z = −11·4, P < 0·001, Fig. 4B). Mean abundance increased from 2011 to 2012 (Mann–Whitney U test, year: z = −4·16, P < 0·001, Fig. 4C). The effect of age class was also significant (Kruskal–Wallis test, age class: χ 2 2 = 9·11, P < 0·05, Fig. 4D), mean abundance highest in juveniles and decreasing in adult and mature wood mice.
Aonchotheca murissylvatici
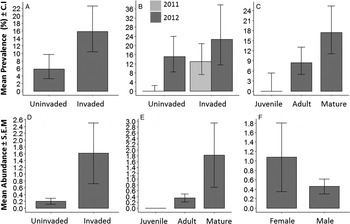
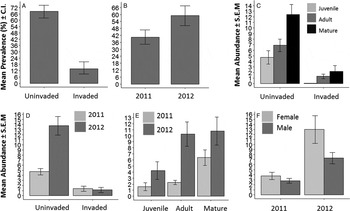
Of the nematodes, A. murissylvatici had the lowest prevalence in wood mice with 38 wood mice infected (9·77%, CI: 7·01–13·2). Wood mice in the combined invaded site had a higher prevalence (GLM family =binomial, site: χ 2 1 = 26·6, P < 0·001, Fig. 5A). Modelling revealed a significant interaction between site and year. Aonchotheca murissylvatici was absent from uninvaded sites in 2011, appearing in wood mice in 2012 (GLM family = binomial, site:year: χ 2 1 =12·9, P < 0·01, Fig. 5B). No juvenile wood mice were found with infections and prevalence increased from adult to mature wood mice (GLM family = binomial, age class: χ 2 2 = 20·0, P < 0·001, Fig. 5C).
Mean prevalence (%±CI) and mean abundance (±s.e.m.) of Aonchotheca murissylvatici in wood mice. Prevalence by site (A), site and year (B) and age class (C). Abundance by site (D), age class (E) and sex (F).

Wood mice carried heavier mean infections in invaded sites (negative binomial GLM, site: LR 1 = 26·0, P < 0·001, Fig. 5D) and burdens increased from juvenile to mature wood mice (negative binomial GLM, age class: LR 2 = 24·7, P < 0·001, Fig. 5D). Mean abundance increased overall in 2012 (negative binomial GLM, year: LR 1 = 15·7, P < 0·001) and was greatest in female wood mice (negative binomial GLM, sex: LR 1 = 4·45, P < 0·05, Fig. 5E).
Trichuris muris
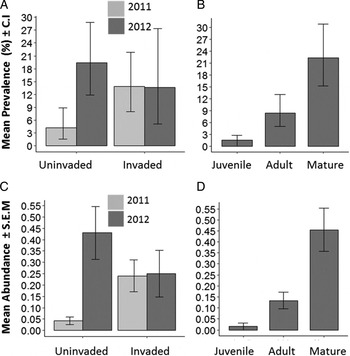
There were 45 wood mice infected with T. muris (11·6%, CI: 8·56–15·2). Mean abundance overall was 0·21 (±0·04). Site significantly affected both prevalence (GLM family = binomial, site: χ 2 1 = 8·17, P < 0·01) and abundance (negative binomial GLM, site: LR 1 = 11·2, P < 0·001) with more wood mice in combined invaded sites carrying T. muris at higher mean abundances. A significant site:year interaction revealed a large increase in mean prevalence (GLM family = binomial, site:year: χ 2 1 = 6·63, P < 0·05, Fig. 6A) and abundance (negative binomial GLM, site:year: LR 1 = 11·2, P < 0·001, Fig. 6C) occurred in combined uninvaded sites in 2012.
Mean prevalence (%±CI) and mean abundance (±s.e.m.) for Trichuris muris in wood mice. Prevalence by site and year (A) and age class (B). Abundance by site and year (C) and age class (D).

The intrinsic factor age class accounted for most of the deviance in both prevalence (GLM family = binomial, age class: χ 2 2 = 21·7, P < 0·001, Fig. 6B) and abundance (negative binomial GLM, age class: LR 2 = 25·9, P < 0·001, Fig. 6D), increasing significantly from juvenile to mature wood mice.
Heligmosomoides polygyrus
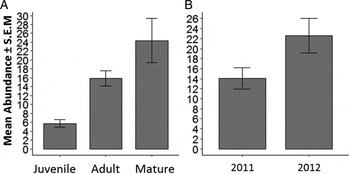
Heligmosomoides polygyrus was found only at Knocksink and analyses are limited to this site. Out of 148 wood mice sampled at Knocksink, 138 (93%, CI: 87·9–96·7) were infected. No significant differences in mean prevalence were found. Mean abundance of H. polygyrus increased through the age classes (negative binomial GLM, age class: LR 2 = 22·9, P < 0·001, Fig. 7A) and there were significantly more H. polygyrus recovered in 2012 (negative binomial GLM, year: LR 1 = 5·23, P < 0·05, Fig. 7B)
Mean abundance (±s.e.m.) for Heligmosomoides polygyrus in wood mice for the uninvaded site Knocksink. Abundance by age class (A) and year (B).

Hymenolepis hibernia
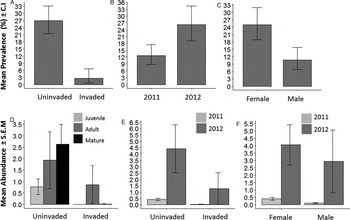
Sixty-eight wood mice (17·5%, CI: 13·8–21·6) were infected with H. hibernia. Wood mice in combined uninvaded sites had a significantly higher mean prevalence (GLM family = binomial, site: χ 2 1 = 39·1, P < 0·001, Fig. 8A). Prevalence increased in 2012 (GLM family = binomial, year: χ 2 1 = 10·1, P < 0·01, Fig. 8B) and was highest in female mice (GLM family = binomial, sex: χ 2 1 = 11·6, P < 0·001, Fig. 8C).
Mean prevalence (%±CI) and mean abundance (±s.e.m.) of Hymenolepis hibernia in wood mice. Prevalence by site (A), year (B) and sex (C). Abundance by site and age class (D), site and year (E) and sex and year (F).

The model for abundance was complicated by a number of significant interactions and main effects. In combined uninvaded sites, mature wood mice had the highest mean abundance (negative binomial GLM, site:age class: LR 2 = 7·32, P < 0·05, Fig. 8D). Mean abundance increased in overall in 2012 (negative binomial GLM, year: LR 1 = 12·8, P < 0·001) with a significant increase in combined uninvaded sites in 2012 (negative binomial GLM, site:year: LR 1 = 4·96, P < 0·05, Fig. 8E). In 2012, female mice had a proportionally greater increase in mean abundance compared with males (negative binomial GLM, sex:age class: LR 1 = 9·78, P < 0·01, Fig. 8F). There was also a significant interaction between site, year and sex (negative binomial GLM, site:year:sex LR 1 = 12·14, P < 0·001).
Skrjabinotaenia lobata (basionym Catenotaenia lobata)
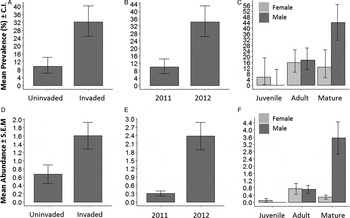
Of the two cestodes species found in wood mice, S. lobata was the more prevalent with 72 wood mice infected (18·5%, CI: 14·8–22·7). Prevalence was greatest in combined invaded sites (GLM family = binomial, site: χ 2 1 = 10·3, P < 0·01, Fig. 9A) and increased significantly in 2012 (GLM family = binomial, year: χ 2 1 = 34·1, P < 0·001, Fig. 9B). Prevalence also increased from juvenile to mature wood mice (GLM family = binomial, age class: χ 2 2 = 6·7, P < 0·05, Fig. 9C). There was a significant difference in the prevalence of infection in males and females when the analyses were broken down by age class. There were no infected juvenile males and significantly more mature male mice were infected than mature female mice (GLM family = binomial, age class:sex: χ 2 2 = 7·64, P < 0·05, Fig. 9C).
Mean prevalence (%±CI) and mean abundance (±s.e.m.) of Skrjabinotaenia lobata in wood mice. Prevalence by site (A), year (B) and age class and sex (C). Abundance by site (D), year (E) and age class and sex (F).

Mean abundance was also greatest in the combined invaded sites (negative binomial GLM, site: LR 1 = 7·13, P < 0·001, Fig. 9D) and increased in 2012 (negative binomial GLM, year: LR 1 = 33·8, P < 0·001, Fig. 9E). Mean abundance increased through the age classes (negative binomial GLM, age class: LR 2 = 7·21, P < 0·05, Fig. 9F), and mature male mice were the more heavily infected host subset (negative binomial GLM, age class:sex: LR 2 = 11·6, P < 0·01, Fig. 9E).
Taenia taeniaeformis
The larval strobilocerus of T. taeniaeformis was found in four wood mice (1·03%, CI: 0·28–2·61). It was only found in 2012 in uninvaded site Santry and the invaded site Coole. Due to the small sample size, no further analyses were done.
Taenia martis
The larval form (fimbriocercus) of the cestode T. martis was found in three wood mice (0·77%, CI: 0·16–2·24) from the invaded site Coole in 2011 and 2012. Due to the small sample size, no further analyses were done.
Brachylaemus recurvum
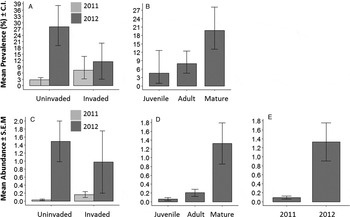
The trematode B. recurvum was recovered from 43 wood mice (11·1%, CI: 8·12–14·6). While site was not significant overall (GLM family = binomial, site: χ 2 2 = 2·74, P > 0·05), there was a significant site:year interaction in prevalence models. Prevalence increased significantly in combined uninvaded sites in 2012 with a much lower rate of increase in combined invaded sites (GLM family = binomial, site:year: χ 2 1 = 7·46, P < 0·01, Fig. 10A). Mean prevalence was affected by age class with prevalence greatest in mature wood mice, increasing at a slower rate between juveniles and adults (GLM family = binomial, age class: χ 2 2 = 10·9, P < 0·01, Fig. 10B).
Mean prevalence (%±CI) and mean abundance (±s.e.m.) of Brachylaemus recurvum in wood mice. Prevalence by site and year (A) and age class (B). Abundance by site and year (C), age class (D) and year (E).

There was also a significant site:year interaction for mean abundance with combined uninvaded sites having a greater rate of increase in 2012 (negative binomial GLM, site:year: LR 1 = 4·64, P < 0·05, Fig. 10C). Mean abundance of B. recurvum was significantly higher in mature wood mice (negative binomial GLM, age class: LR 2 = 19·5, P < 0·001, Fig. 10D) and increased in 2012 (negative binomial GLM, year: LR 1 = 5·00, P < 0·05, Fig. 10E).
Corrigia vitta
Corrigia vitta was the more prevalent trematode found in wood mice with 183 mice infected overall (47%, CI: 42·0–52·1). Mean prevalence was highest in the combined uninvaded sites (GLM family = binomial, site: χ 2 1 = 115·6, P < 0·001, Fig. 11A) and increased in 2012 (GLM family = binomial, year: χ 2 1 = 8·13, P < 0·01, Fig. 11B).
Mean prevalence (%±CI) and mean abundance (±s.e.m.) of Corrigia vitta in wood mice. Prevalence by site (A) and year (B). Abundance by site and age class (C), site and year (D), age class and year (E) and year and sex (F).

Mean abundance models were complicated by several significant main effects, two-way and three-way interactions. Significant main effects included site, with highest mean abundances in combined uninvaded sites (negative binomial GLM: site: LR 1 = 5·45, P < 0·05, Fig. 11C). Mean abundance increased through the age classes (negative binomial GLM: age class: LR 2 = 35·6, P < 0·001, Fig. 11C).
There was a significant site:age class interaction (negative binomial GLM: site:age class: LR 2 = 15·7, P < 0·001, Fig. 11C); site:year (negative binomial GLM: site:year: LR 1 = 7·22, P < 0·01, Fig. 11D); age class:year interaction (negative binomial GLM: age class:year LR 2 = 19·5, P < 0·001, Fig. 11E) and year:sex (negative binomial GLM: year:sex: LR 1 = 4·43, P < 0·05, Fig. 11F). There were also three-way interactions between site, year and sex (negative binomial GLM: site:year:sex: LR 1 = 5·46, P < 0·05) and year, site and age class (negative binomial GLM: year:site:age class: LR 2 = 10·7, P < 0·05).
DISCUSSION
Species invasions provide natural perturbation experiments across spatial and temporal scales that can be useful for exploring a wide range of questions in ecology and evolution, including the role of parasites in natural communities. The aim of this study was to take advantage of such a natural experiment and investigate the spatiotemporal dynamics of helminth communities in wood mice in the context of a biological invasion.
Local factors appear to play a large role in structuring helminth communities (Haukisalmi and Henttonen, Reference Haukisalmi and Henttonen1990; Abu-Madi et al. Reference Abu-Madi, Behnke, Lewis and Gilbert1998). This was evident in our models, with site a major cause of variation, along with the number of intrinsic and extrinsic factors that interacted with site. A numerous site-specific conditions can affect helminth dynamics in hosts, and it is not possible to measure or even identify these. In the present study, a major difference between our sites was the presence or absence of an invasive species. Following our analyses, we identified three helminth parasites of wood mice that may be affected by the presence of the invasive bank vole.
Wood mice in uninvaded sites carried heavier S. stroma burdens than wood mice in invaded sites. Several different mechanisms are thought to result in dilution (Keesing et al. Reference Keesing, Holt and Ostfeld2006), but most empirical studies suggest dilution results from a decrease in encounter rates between susceptible hosts and parasites. Reduced encounter rates can occur directly by density-independent means (encounter reduction) (Keesing et al. Reference Keesing, Holt and Ostfeld2006; Johnson and Thieltges, Reference Johnson and Thieltges2010). Telfer et al. (Reference Telfer, Bown, Sekules, Begon, Hayden and Birtles2005) found that the presence of the invasive bank vole in Ireland was correlated with a reduction in infection of two species of the flea-transmitted pathogen Bartonella in native wood mice. Bank voles in Ireland appear to be resistant to native Bartonella strains. By diverting fleas away from wood mice, bank voles have caused a dilution effect by reducing the encounter rate between the flea vector and the more competent parasite host.
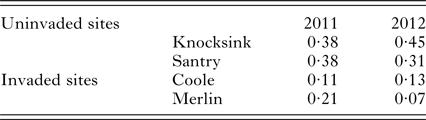
The dilution effect can also occur if the density of susceptible hosts is reduced (susceptible host regulation) (Keesing et al. Reference Keesing, Holt and Ostfeld2006). When parasite transmission is density-dependent, increasing biodiversity will decrease disease risk if added species reduce the abundance of the main host, and so long as intraspecific transmission is greater than interspecific transmission (Dobson, Reference Dobson2004; Rudolf and Antonovics, Reference Rudolf and Antonovics2005). According to the findings of Montgomery et al. (Reference Montgomery, Lundy and Reid2012), the bank vole in Ireland is having a negative effect on the population of wood mice. There was some support for this finding in the present study – both invaded sites had lower relative population sizes of wood mice than uninvaded sites (Table 5). If bank voles are contributing to a reduction in wood mice density, this will have an indirect effect on helminths with density-dependent transmission, such as S. stroma. This nematode is transmitted by host-to-host contact as well as by infected bedding and food and should therefore track host density closely (Lewis, Reference Lewis1968; Taffs, Reference Taffs1976). The life expectancy of both adults and free-living stages is short and eggs are not very resistant to environmental conditions (Müller-Graf et al. Reference Müller-Graf, Durand, Feliu, Hugot, O'Callaghan, Renaud, Santalla and Morand1999), so that frequent infections and reinfections are needed to maintain the high infrapopulations seen in this study. In Ireland, Montgomery and Montgomery (Reference Montgomery and Montgomery1988) found S. stroma to be particularly sensitive to low wood mice densities, and therefore this parasite may be a good indicator of relative population size. Thus, by negatively impacting on the wood mice population, bank voles may have reduced the mean abundance (dilution) of S. stroma in wood mice via susceptible host regulation.
Relative population size of wood mice (per trapping period) in all study sites by year

A second parasite potentially affected by the presence of the invasive bank vole was A. murissylvatici. This is a common nematode of both murid and arvicolid rodents having a wide host range in these groups (Montgomery and Montgomery, Reference Montgomery and Montgomery1988; Justine and de Roguin, Reference Justine and de Roguin1990; Milazzo et al. Reference Milazzo, Gouy de Belloq, Cagnin, Casanova, Feliu, Fons, Morand and Santalla2003; Bjelić-Čabrilo et al. Reference Bjelić-Čabrilo, Popović, Šimić and Kostić2009) as well as in more distantly related rodents (Pisanu et al. Reference Pisanu, Lebailleux and Chapuis2009). The intermediate host is likely a non-arthropod invertebrate (Anderson, Reference Anderson2000). Parasitological surveys in Europe and Ireland record A. murissylvatici as having a lower prevalence and intensity in wood mice than in bank voles, suggesting bank voles are the more competent host (O'Sullivan et al. Reference O'Sullivan, Small and Fairley1984; Pisanu et al. Reference Pisanu, Lebailleux and Chapuis2009). For an indigenous parasite with density-dependent transmission, introduced species with higher than zero competence are likely to increase transmission rates and prevalence (Telfer and Bown, Reference Telfer and Bown2012).
Prevalence and abundance of A. murissylvatici in wood mice was greater overall in invaded sites, though it was not found in the vole–mouse site in Merlin in 2012. The very low relative population size of mice at this site may account for the disappearance. Aonchotheca murissylvatici was also found in bank voles in invaded sites (Loxton et al. Reference Loxton, Lawton, Stafford and Holland2016). The higher prevalence and abundance of A. murissylvatici in wood mice in invaded sites could indicate that bank voles are amplifying infection in wood mice through the process of spill-back (Kelly et al. Reference Kelly, Patterson, Townsand, Poulin and Tompkins2009).
Finally, the parasite T. martis was recovered from wood mice in one invaded site (Coole). This cestode was also recovered from bank voles at both invaded sites (Loxton et al. Reference Loxton, Lawton, Stafford and Holland2016). Taenia martis has not been recorded in wood mice in Ireland prior to the present study (Langley and Fairley, Reference Langley and Fairley1982; Montgomery and Montgomery, Reference Montgomery and Montgomery1988, Reference Montgomery and Montgomery1989, Reference Montgomery and Montgomery1990). Sites studied by these authors included the west of Ireland and Northern Ireland. O'Sullivan et al. (Reference O'Sullivan, Small and Fairley1984) surveying wood mice and bank voles simultaneously in the west of Ireland did not find the cestode in either rodent. We did not find T. martis at the second invaded site (Merlin), but the low overall prevalence of the parasite (2·7%, CI: 0·6–7·8) and the small wood mice sample size in Merlin are likely to have lowered the probabilities of detecting it. Taenia martis is regularly recorded in bank voles in Europe (Behnke et al. Reference Behnke, Bajer, Harris, Newington, Pidgeon, Rowlands, Sheriff, Kuliś-Malkowska, Siński, Gilbert and Barnard2008; Grzybek et al. Reference Grzybek, Bajer, Bednarsk, Al-Sarraf, Behnke-Borowczyk, Harris, Price, Brown, Osborne, Siński and Behnke2015) and may well represent a co-invading helminth (as defined by Lymbery et al. Reference Lymbery, Morine, Kanani, Beatty and Morgan2014) that has spilled over to native wood mice.
Site was also an important factor in the distribution of other helminths, regardless of whether bank voles were present or not. Heligmosomoides polygyrus, while one of the dominant helminths where it is present, has a patchy distribution in Ireland (Montgomery and Montgomery, Reference Montgomery and Montgomery1990) and was only found at one site, Knocksink. The L3 larvae are free-living and feed on bacteria in the fecal material (Fahmy, Reference Fahmy1956; Bryant, Reference Bryant1973). This stage is therefore particularly vulnerable to extrinsic factors such as soil acidity, which has been shown to affect larval survival (Abu-Madi et al. Reference Abu-Madi, Behnke, Lewis and Gilbert1998). Heligmosomoides polygyrus can reappear at sites where it was previously recorded as absent, so may also be subject to extinction at low host densities (Montgomery and Montgomery, Reference Montgomery and Montgomery1989). Conditions at the invaded site Coole do not appear to be conducive to the transmission of C. vitta. Of the two trematodes recovered, C. vitta is typically the more common in wood mice in the UK and Ireland, B. recurvum occurring more rarely (Montgomery and Montgomery, Reference Montgomery and Montgomery1990; Behnke et al. Reference Behnke, Lewis, Zain and Gilbert1999; Abu-Madi et al. Reference Abu-Madi, Behnke, Lewis and Gilbert2000). In all sites except Coole, C. vitta reached an overall prevalence over 20%. The life cycle of C. vitta is unknown but other dicrocoeliid trematodes have two intermediate hosts, a snail as first intermediate and arthropods as second intermediate hosts (Manga-González et al. Reference Manga-González, González -Lanza, Cabanas and Campo2001; Morley and Lewis, Reference Morley and Lewis2008). There is the possibility that some environmental factor at Coole is unsuitable for one or both intermediate hosts.
Many other factors had a role in shaping the helminth dynamics in wood mice over the course of this study. One of the strongest patterns to emerge from the data was an increase in helminth species richness and mean abundance in 2012. The transmission of helminths is positively associated with increased average rainfall in the summer months; additionally, snail populations will benefit from wetter habitats (Patz et al. Reference Patz, Graczyk, Geller and Vittor2000). Trematode sporocyst infections have been found to increase after wet summers (Morley and Lewis, Reference Morley and Lewis2008), and high summer rainfall also resulted in high levels of infection of the cestode Catenotaenia sp. in a vole population during the autumn (Haukisalmi and Henttonen, Reference Haukisalmi and Henttonen1990). Summer rainfall levels was also found to explain much of the year-to-year variation in nematode egg counts from grouse, likely due to increased recruitment in wetter summer months (Moss et al. Reference Moss, Watson, Trenholm and Parr1993). Average summer rain fall was higher in 2012 across the country (Table 6), which may have contributed to the increase in mean helminth species diversity and overall increases in helminth prevalence and mean abundance seen in 2012.
Climatic data for uninvaded sites and invaded sites in 2011 and 2011
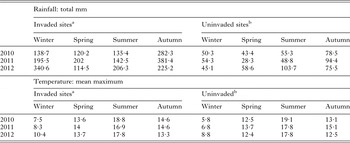
a Invaded – weather station Culliagh Beg is situated in the Maam valley, 53°34′36″N Longitude 09°39′53″W.
b Uninvaded – weather station is situated at Dublin Airport, 53°25′17″N 06°17′52″W.
Winter (December, January, February); Spring (March, April, May); Summer (June, July, August); Autumn (September, October, November).
Mean species richness increased through wood mice age classes, which is common in studies of wood mice (Montgomery and Montgomery, Reference Montgomery and Montgomery1989; Behnke et al. Reference Behnke, Lewis, Zain and Gilbert1999; Fuentes et al. Reference Fuentes, Sáez, Trelis, Galán-Puchades and Esteban2004). Species richness will increase simply as a function of enhanced exposure as wood mice increase exploration and home range with age. Other factors include developmental time and life cycles of helminths. Trichuris muris has a very low prevalence and abundance in younger age classes because it takes 5 weeks to become an adult (Behnke et al. Reference Behnke, Ali and Jenkins1984). Older wood mice also consume more animal material than younger cohorts; therefore, they will also be exposed to more species with indirect life cycles (Watts, Reference Watts1968).
It is clear from this and other studies of wood mice helminth dynamics that the factors shaping the helminth communities of wood mice are largely context-dependent, which must be taken into consideration when searching for generalizations in parasite community ecology. There were also significant differences in the helminth communities between the 2 years surveyed, which highlights the need for parasitological surveys that examine several sites over more than 1 year.
A central goal of host–parasite community ecology is to identify the causes of parasite aggregation and variation in parasite abundance within and between host populations (Barnard et al. Reference Barnard, Kulis, Behnke, Bajer, Gromadzka-Ostrowska, Stachon and Sinski2003). In this study, site was one of the most important factors explaining differences in helminth prevalence and abundance between wood mice populations. This is in agreement with similar studies examining the factors shaping helminth communities in wood mice (Montgomery and Montgomery, Reference Montgomery and Montgomery1990; Abu-Madi et al. Reference Abu-Madi, Behnke, Lewis and Gilbert2000; Behnke et al. Reference Behnke, Barnard, Bajer, Bray, Dinmore, Frake, Osmond, Race and Sinski2001). A major difference between our sites was the presence or absence of the bank vole, which may be the cause of some of the variation between sites. We suggest that there is evidence of dilution, spill-back and spill-over for three helminths of wood mice. These helminth species have been highlighted as they are shared by wood mice and bank voles (A. murissylvatici and T. martis) or are susceptible to reduced wood mouse population size due to the presence of bank vole (S. stroma).
SUPPLEMENTARY MATERIAL
The supplementary material for this article can be found at https://doi.org/10.1017/S0031182017000981.
ACKNOWLEDGEMENTS
Our deepest thanks go to Kim Lawlor, Rory Conniffe, Margret Mary Sinnott, Clare Singleton and Jonathan Flynn for all their help in the field and long hours in the laboratory. Author K.C.L was supported by a Postgraduate Research Studentship from Trinity College Dublin and subsequently by an award from the School of Natural Sciences, without which this work could not have been undertaken. The authors would also like to thank three anonymous reviewers for their helpful and constructive comments that greatly contributed to improving the final version of the paper.
FINANCIAL SUPPORT
Author K.C.L was supported by a Postgraduate Research Studentship from Trinity College Dublin and an award from the School of Natural Sciences, Trinity College Dublin.