The role of traders in the interregional movement is one of the enduring subjects of the literature on American slavery and its aftermath. Emerging in the indictment of slavery during the abolitionist campaign of the 1830s and 1840s, and later adopted by historians as a consequential issue, the question is important for understanding the effectiveness of the slave family in protecting children and transmitting culture, the harshness of slave life, and the cohesiveness of the extended black family during and after slavery (Weld 1841; Stampp 1956; Fogel and Engerman 1974; Tadman 1989).
To what extent were husbands separated from their partners, and children from their mothers? This subject is the focus of numerous articles and monographs and enters every book that attempts a comprehensive treatment of American slavery (Phillips 1918; Gray 1933; Stampp 1956; Fogel and Engerman 1974; Genovese 1974; Fogel 1989). Traders who were satisfying demands for labor in the West usually preferred individuals who were physically mature enough for work but also sufficiently young to justify an investment in transportation, roughly age 11 to 30 years (Freudenberger and Pritchett 1991). Although mothers could have been separated from their young children, the practice appears to have been infrequent, and was illegal in Louisiana after 1806 (Calomiris and Pritchett 2009). Nevertheless, the age preferences of traders must have led to separations of many older children from family members, and because their younger siblings eventually became older and subject to sale, this probably weakened their anticipation of a stable family life. Some researchers connect the answers to these questions to the state of the black family during the twentieth century (Moynihan 1965).
The literature on the slave trade includes numerous estimates of the share of slaves transported by traders in the westward movement. Most of these have significant shortcomings, whether meager empirical foundations or methods unclear to the point that duplication or extension of the work is impossible. As noted by F. Bancroft, the leading expert in the field who was evaluating his own and others' work, the results are at best informed guesses. We provide a brief overview of prior methods and results, and then describe an approach that brings a large amount of new evidence to the table—cargo manifests housed at the National Archives that described slaves transported by ship along the Atlantic and Gulf coasts. This source has limitations for understanding the overall dimensions of the westward movement because it excludes slaves transported overland and by internal waterways, and because the manifest collection probably omits some coastwise shipments. Yet every investigator of the topic has called for more information, and we believe our data, methods, and estimates clarify an important aspect of American slavery and its aftermath.
ESTIMATES
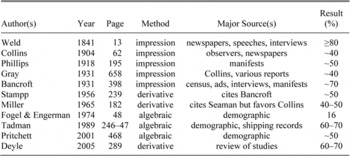
Table 1 gives prior estimates of the share of slaves transported by traders. All of those published prior to 1974 rely on sources such as newspapers, interviews, testimony, census data, and small samples of slave manifests. Precisely how they interpreted these data is unclear from the sources. Somehow the researchers distilled an impression of the evidence, but even the dominant scholar in the field (Bancroft 1931) admits shortcomings in a process that collectively placed the share at 40 to 80 percent. The upper limit (80%+) by Theodore Weld, one of the architects of the abolitionist movement, may have been inflated by an attempt to propagandize the horrors of slavery.
ESTIMATES OF THE SHARE SHIPPED BY TRADERS IN THE INTERREGIONAL MOVEMENT

Sources:
Author, date, and pages given in the table. All references are in the bibliography.
Winfield Collins' 1904 work, which was based on newspaper accounts and reports by contemporary observers, influenced the discussion for many years, including that of William Miller as late as 1965 (Collins 1904; Miller 1965). Both Collins and Robert Gudmestad maintain that the commercial side of the westward movement grew over time, especially after 1830 (Gudmestad 2003). U.B. Phillips agreed with Collins that the trade was a minor activity supplementing the westward flow of labor (Phillips 1918, p. 158), although in other work based on manifests he suggested that perhaps one half of the slaves in the westward movement were carried by traders (Phillips 1929, p. 195). Lewis Cecil Gray cited Collins but discussed evidence that the trade may have been more important than Collins suggested (Gray 1933, p. 658).
In the early 1930s Frederick Bancroft succeeded Winfield Collins as the authority on the slave trade, basing his conclusions on an extensive search of advertisements supplemented by census survival methods, personal interviews with elderly people who were contemporaries of the trade, and data from slave manifests (Bancroft 1931). He noted that Collins failed to recognize purchases by southern planters who traveled north to the Border States to purchase slaves for their own use, and argued that these purchases should be included as part of the trade (Bancroft 1931, p. 397). Bancroft's views continued to influence the thought of subsequent scholars, including Kenneth Stampp's major work published 25 years later (Stampp 1956).
Robert Fogel and Stanley Engerman addressed the problem that confined prior estimates by meager data and vague methods (Fogel and Engerman 1974). Their approach utilized a linear identity that relied on three parameters to estimate the share of sales in interregional migration (γ). By definition, the male share of all migrants (δ) equals a weighted average of the male share of interregional sales (δs) and the male share of planter migration (δm):
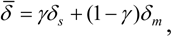
which implies that

Fogel and Engerman used values of = 0.511; δm = 0.5; and δs = 0.57, which gives= 0.157.
S. Lebergott and later V. Carstensen and S. E. Goodman observed that calculated values of were very sensitive to plausible differences in parameter estimates (Lebergott 1975; Carstensen and Goodman 1977). If δs declines from 0.57 to 0.54, then becomes 0.275; and if also rises to 0.52, then γ equals 0.5. Other critics noted that Fogel and Engerman estimated parameters in the equation using sales data from a single county (Ann Arundel County, Maryland), a locality proximate to the interregional slave trade (Gutman and Sutch 1977).
About 15 years later, Fogel's research team confirmed that the dilemma remained unsolved by concluding that “no alternative sources of data or estimating procedures have as yet been developed that are sufficiently reliable to resolve the issue” (Fogel, Galantine et al. 1992, p. 196).
Following the revelation of sensitivities in the linear equation, scholars continued work on the problem. In an extensive study of census data and shipping records for South Carolina, Michael Tadman concluded that traders conveyed 60 to 70 percent of the slaves (Tadman 1989). Jonathan Pritchett demonstrated the equivalence of the estimating equations used by Tadman and by Fogel and Engerman, but they arrived at different conclusions because unlike Fogel and Engerman, Tadman assumed that traders refused to purchase older men (Pritchett 2001, pp. 470–71). Pritchett recognized that the demographic data used by Tadman and by Fogel and Engerman were measured with error, and he corrects for this using an errors-in-variables model, from which he concluded that sales accounted for about one-half of the interregional movement. As author of the latest book to evaluate earlier work, Steven Deyle argues that between 60 and 70 percent of the slaves shipped from the Upper to the Lower South were transported by traders (Deyle 2005, p. 289).
SOURCES
The article combines two major sources of evidence: slave manifests and the names of traders obtained from various sources. As noted above, several researchers have used the manifests but we are the first to analyze the entire collection housed at the National Archives, about 24,400 documents that report the movement of some 135,000 individuals.
Our search for names began with the two major studies of the trade by Bancroft and by Tadman, to which we added names obtained from ads in antebellum newspapers of southern coastal states.Footnote 1 Not all traders advertised and copies of some newspapers fail to survive, however, and this method alone would underestimate the volume of the trade, so we also identified traders by frequent appearances of their names in the shipping manifests, an approach endorsed by Phillips and by Tadman. Our second method utilizes knowledge that traders preferred to purchase individuals in their prime ages, i.e., they were of an age ready to work and had a future work life that justified an investment in shipment. In a third method, we employ the model developed by Pritchett and H. Freudenberger from New Orleans sales records that identified traders, which they matched with names on slave manifests, to estimate the probability that a shipment pertained to a trader based on the manifest's demographic characteristics.
Slave Manifests
The law for the abolition of the Atlantic slave trade, effective January 1, 1808, created a large quantity of manifests that ship captains used to prove that slaves transported in the American coastwise trade were not smuggled from Africa (Wesley 1942). The captains typically wrote on printed forms where entries gave the name, sex, age, height (in feet, inches, and sometimes fractions), color, and name and residence of the shipper or owner, ports of origin and destination, and date. One copy of the manifest was retained at the port of origin and the other carried on the ship and delivered by the captain to the collector at the port of destination, for comparison with the cargo. The information recorded on the manifests was used purely for identification at the port of destination, and there is no reason to believe it may have been distorted for other purposes. This does not mean, however, that the documents are free of bias relative to the entire slave population or even that of all interregional migrants, a topic discussed below and in more detail in other papers in progress.
The manifests are Treasury records stored by collection district at the National Archives as part of RG 36, Records of the U.S. Customs Service.Footnote 2 We have no reliable way of knowing the completeness of these records relative to all shipments, nor of evaluating the extent of the records for traders relative to non-traders. Plausibly some records were lost or otherwise failed to arrive at the National Archives, a point made by C. H. Wesley (1942) and by Tadman (1989).Footnote 3
We edited the coded data prior to analysis. First, we eliminated all manifests lacking a date, which was essential for constructing many of the statistics, and for undertaking the second step, eliminating duplicates. Third, we removed shipments to or from all non-slave states as well as a small number originating on the Mississippi and its tributaries. The final data set includes 24,406 manifests that list 135,312 individuals.
The records are not entirely complete; sometimes age, sex, or height is missing, or month and day of shipment and occasionally port or origin or destination. One may infer that the missing ages, sexes, and heights (denoted on the document by a blank or by a “-”) are concentrated among children, based on two types of demographic organization: adults listed first followed by children, or women of childbearing age followed by children. Donald Sweig noted this pattern on shipments by Franklin and Armfield from Alexandria, and in some calculations, we assign the age of “under 10” to the 303 observations that we infer were children (Sweig 1980). Therefore the sample sizes may differ depending upon the data required for the analysis.
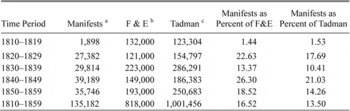
Two studies provide estimates of the interstate slave trade (Fogel and Engerman and Tadman). Both rely on the census-survivor technique, which assumes that the slave population was closed and that birth and death rates were equal across states. A state population that grew faster than anticipated under these conditions would have done so through in-migration, and vice versa. The procedure is somewhat more complicated than described here because allowances may or may not be made for manumissions, exports to Liberia, smuggling after 1807, movement of slaves into Florida or Texas prior to statehood, and so forth.
The figures reported in Table 2 show that Tadman's estimates of the movement exceed those of Fogel and Engerman by approximately 22 percent. The major explanation for the difference rests on treatment of children born during the decade in question, which Fogel and Engerman ignore in their calculations. They acknowledge that some children born within the decade did move, and recognize the downward bias on the estimate of migration, but argue it was probably small. Tadman includes these children as migrants but recognizes that his method overstates the number of children who moved. Therefore, the two estimates plausibly bracket the actual rate of the interstate trade. Note as well that the estimates in the last two columns of Table 2 are too low because the manifest numbers we use are based on 24,400 of approximately 27,000 unedited documents. We deleted 5,148 slaves on manifests that lacked a year or a port of origin, thereby understating the importance of shipments relative to total volume reported in Table 2 by roughly 0.6 percentage points.Footnote 4 Given there were almost certainly some manifests that never reached the National Archives, our data and procedures provide only a lower-bound estimate on the importance of coastwise shipments relative to the entire interregional trade.
MANIFEST SHIPMENTS IN THE INTERSTATE MOVEMENT

a We drop manifests lacking year of shipment, or having non-coastal ports, non-southern ports, or if ports are missing.
b Fogel and Engerman (1974, pg. 46).
c Tadman (1989, p. 12), average of exportations and importations.
Sources:
Slave manifests. See the text.
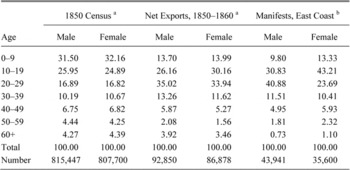
Most large migrations inspired by economic gain, including that of American slaves, had discernibly more men and markedly more people of working age. The second and third columns of Table 3 shows the age and sex distribution of slaves in the Atlantic coast states in 1850, which itself was shaped somewhat by outflows, and in the third and fourth columns, estimates of the age and sex distribution of slaves in the interregional movement from the Atlantic coast states of Maryland to Georgia in 1850–1860, as estimated by Richard Sutch (Sutch 1975). Relative to the net migration from these Atlantic coast states, the 1850 Census from the same states had fewer males (50.24 vs. 51.66 percent), considerably more children under age 10 (31.83 vs. 13.84 percent), and more people aged 40+ (15.46 vs. 11.11 percent). The manifests were slightly more skewed than the interregional estimates, having 11.38 percent under age 10; 8.32 percent aged 40+; and 55.23 percent males.
Geographic Pattern
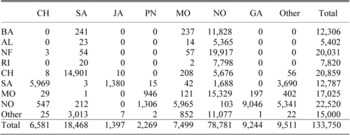
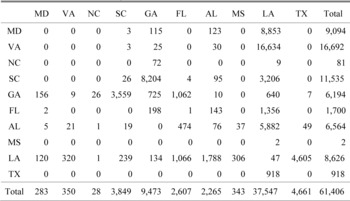
Studies of the slave trade have long recognized New Orleans as a major destination, especially for cargo carried by professional traders. Being “sold down the river” is a cliché in the literature, but perhaps it applies mainly to the watershed of the Mississippi River. Was this the case for the manifests? Table 4 gives a shipping matrix for the major ports of origin and destination, which confirms the reputation. About 58.9 percent of all slaves were destined for the Crescent City, and at 13.8 percent, Savannah was a very distant second.
AGE DISTRIBUTION OF SLAVES: 1850 CENSUS, INTERREGIONAL MOVEMENT, AND MANIFESTS

a Maryland, Virginia, North Carolina, South Carolina, and Georgia.
b From ports in Maryland, Virginia, North Carolina, South Carolina, or Georgia.
Note:
We assigned an age under 10 to 303 individuals whose age was missing or indicated by a “-.” See the text.
Sources:
DeBow 1854, pp. 8–89; Sutch 1975, Appendix table 4; slave manifests.
SHIPPING MATRIX BY NUMBER OF SLAVES AND PORT

Notes:
The table includes all observations that have non-missing ports of origin and destination. Columns are destinations and rows are origins. Abbreviations are as follows: AL – Alexandria, VA; BA – Baltimore, MD; CH – Charleston, SC; GA – Galveston, TX; MO – Mobile, AL; NF – Norfolk, VA; NO – New Orleans, LA; PA – Pensacola, FL; RI – Richmond, VA; SA – Savannah, GA; and JA – Jacksonville, FL.
Notes:
Slave manifests. See the text.
Most large population movements involve some return migration. To what extent did backhauling exist in the manifests? Excluding the “other” ports in Table 4, only 14,983 slaves out of 118,750 (12.62 percent) went to a port east of the place of origin. Shipments from Savannah to Charleston (5,969 individuals) and from New Orleans to Mobile (5,965 individuals) dominated this pattern of apparent reverse movement. One may question, however, whether these shipments were true reverse migration; some planters or traders from inland localities may have used New Orleans as the least-cost route to the rich lands of Alabama. Out of 7,364 slaves shipped from Charleston or Savannah to New Orleans, 77.08 percent originated in Charleston, but Savannah was by far the most important destination for slaves shipped from Charleston (14,901 out of 20,859 exports). These statistics confirm this South Carolina city was the most important slave market in the lower Atlantic states, and while deliveries received from Savannah were west-to-east in a technical sense, Charleston may simply have been an efficient collection point for area traffic to the Gulf coast.
IDENTIFYING TRADERS
We considered three methods to determine whether a shipper was a trader: fuzzy matching; frequency of shipments; and the Pritchett-Freudenberg probability model. The first step in fuzzy matching was to prepare a list of trader names, for which we used three sources: major books on the subject by Bancroft and by Tadman, who collectively identify 584 traders. In addition, we searched for ads in newspapers from coastal states placed by people who sought to purchase Negroes in the 1820s through the 1850s, a procedure that provided an additional 465 names. The second step required a process to match names from these sources with the names of traders or shippers listed on the manifests. We chose the “fuzzy matching” procedure available in STATA, followed by a manual review of the results.
The procedure operates through the reclink (short for record linkage) command.Footnote 5 The method matches records in two data sets where no perfect key fields exist. It allows user defined matching and non-matching weights for each variable employed in the linkage. We attempted to match the manifests to the list of traders on name, state, and a range of years.Footnote 6 The command returns a proposed match and a numerical match score that ranges from 0 to 1.Footnote 7 So name and state were given disproportionately large weight in determining those matches. The code is available upon request and displays our weighting scheme for matching the various variables. Results were insensitive to the choice of weights beyond requiring that name and state received a large weight.
The question is whether to consider a “proposed” match as a true match in the case of match scores less than 1. The distribution of match scores is rather lumpy, meaning there are concentrations and gaps as one moves away from perfect matches. This feature aids in the process of distinguishing between groups. In the end, we considered anyone with a match score greater than 0.98 a trader. In terms of what that means for differences between the manifest and trader list, this usually amounted to something like a letter or two difference in the name (“Snyder” vs. “Snider”) with perfect matches for the rest of the variables (state and time period). The algorithm was not perfect in identifying all traders. There were certain instances such as “MacDonald” and “Donald,” which from the viewpoint of the algorithm looks like a big difference, but we strongly suspect otherwise based on port and time period. This led us to do further hand coding of the small number of initially unmatched manifests.
Bancroft, Tadman, and others, have noted that some traders did not advertise. Moreover, some antebellum newspapers perished, were never preserved or copied, or otherwise are unavailable for study. Therefore, identifying traders by this procedure alone understates the volume of the trade. To help address this problem, we manually inspected an alphabetical list of shipper last names, which revealed over 120 names of people who had frequent shipments from the same port, or ports in the same state during a span of years that were roughly contiguous. We surmised that the vast majority of these people were traders. We defined traders as those people whose names appeared 5 or more times on the manifests, a procedure that consolidates opposing tensions or biases and on which we conduct sensitivity tests.Footnote 8 Names identified by the two procedures described above we label method A.Footnote 9
According to this method, the median size of shipment was 19 individuals by traders and 12 individuals by non-traders.Footnote 10
Probit Model
We also calculated the probability of being a trader based on the probit model estimated by Pritchett and Freudenberger (1992). They identified traders as individuals who both imported slaves, as documented in inward manifests, and sold slaves in the same year, as documented in the New Orleans conveyance records. Out of 506 manifests, they found 155 shipments made by traders. They then estimated a probit model of the probability of being a trader based on manifest characteristics of percent prime age, log of manifest size, and the share male. We simply took the parameter estimates directly from that paper (Table 5) and calculated what we call the PF probability based on the normal cumulative density function using characteristics of each manifest in our sample. We label this method B.
RESULTS
Matching Names
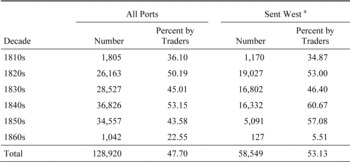
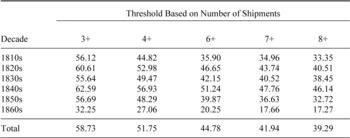
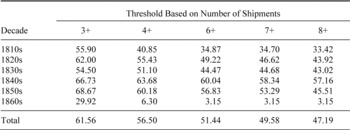
Table 5 displays the results using method A. One may debate the appropriate sample on which to calculate the share of slaves sent by traders, so we present two options. The first considers all manifests, regardless of origin or destination. Of 128,920 slaves on all manifests that met this criterion and included name of owner or shipper, about 47.70 percent were sent by traders. The debate over the consequences of the trade for the slave family, however, emphasizes the westward movement, and in particular shipments from the Atlantic to Gulf coast ports as the wedge driving family members apart. In this subsample, about 53.13 percent of slaves were shipped by traders. In Tables 6 and 7, one can see that the percent shipped by traders rises (falls) with a lower (higher) threshold. At a threshold as high as eight voyages, however, nearly a majority (47.2 percent) of slaves sent west were shipped traders. The share sent to all ports by traders is more sensitive to the threshold, varying from 39.3 percent (8+ voyages) to 59.7 percent (3+ voyages). Under any reasonable threshold a large share, if not a majority, of slaves were delivered by traders.
NUMBER AND PERCENT OF SLAVES SHIPPED BY TRADERS BASED ON METHOD A

a Atlantic to Gulf coast ports.
Sources:
Slave manifests. See the text.
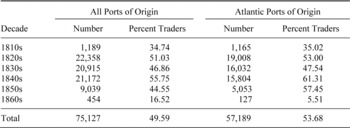
Shipments to New Orleans, long considered a major destination for professional traders, is the third option (Table 8). Here, the share sent by traders is 49.6 percent, or 1.9 percentage points higher than for the corresponding sample in Table 5. For slaves sent from Atlantic ports to New Orleans, the number is only 0.55 percentage points higher than found in the east-west sample. This is not surprising because the vast majority of slaves sent west from Atlantic ports went to New Orleans.
In what areas of the South were traders most active? Table 9 gives a matrix of trader shipments (defined by method A) arranged by state of origin and destination. At 27.18 and 18.78 percent, respectively of all trader shipments, Virginia and South Carolina were the major suppliers. Maryland (14.80), Louisiana (14.05), Alabama (10.69), and Georgia (10.09) were also heavily involved in providing slaves for commercial transportation. About 61.15 percent of all slaves sent by traders were destined for Louisiana.
Several observations are in order. First, these numbers fall in the middle range of estimates made by earlier studies (Table 1). That said, almost surely our numbers are underestimates because some, especially small, traders escaped notice by method A. Second, the pattern of slave migration changed over time and according to Robert Gudmestad, became more commercial (Gudmestad 2003). The second portion of Table 5 bears out this argument; the share sent west by traders rose nearly 7 percentage points from 1820–1839 to 1840–1859. Third, for this reason estimates of the commercial trade based mainly on documents from the 1840s and 1850s may overstate the importance of commercial transactions relative to the entire antebellum period.Footnote 11 On this basis, some estimates in Table 1 may be too high. If correct, the data for shipments from all ports to New Orleans (first part of Table 8) are a puzzle that documents a declining share by shipments by traders after the 1840s. This may be explained by our search for traders mainly along the Atlantic coast, the areas emphasized by Bancroft and Tadman and by our search for trader names in antebellum newspapers. By the late antebellum period, migration shifted increasingly toward departures from Gulf coast ports in western Florida, Alabama, and Mississippi, where we have less documentation of traders. For these reasons, we believe that the second portion of Table 5 provides the best (but still downward biased; see below) representation of trader involvement in the westward movement based on matching of names.
SENSITIVITY TESTS ON PERCENT OF SLAVES SENT BY TRADERS TO ALL PORTS BASED ON METHOD A

Notes:
5+ is not included since this is our baseline threshold.
Notes:
Slave manifests. See the text.
SENSITIVITY TESTS ON PERCENT OF SLAVES SENT WEST BY TRADERS BASED ON METHOD Aa

a Atlantic to Gulf coast ports.
Notes:
5+ is not included since this is our baseline threshold.
Sources:
Slave manifests. See the text.
SLAVES SENT TO NEW ORLEANS BY TRADERS BASED ON METHOD A

Sources:
Slave manifests. See the text.
SHIPPING MATRIX BY FREQUENCY AND STATE FOR SLAVES SHIPPED BY TRADERS

Note:
Columns are destinations and rows are origins.
Sources:
Slave manifests. See the text.
Trader Probability
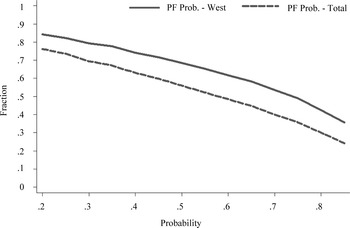
An advantage of method A is that it gives a precise (yes or no) answer to whether a shipper was a trader. The other method is based on a probability distribution and requires more judgment in estimating the share of slaves delivered by traders. This section compares methods A and B. Figure 1 displays the Pritchett-Freudenberger (PF) estimate of the fraction of slaves delivered by traders as a function of alternative cut-off probability points for defining who is a trader. Probabilities in the range of 0.5 to 0.6 suggest that roughly 59 to 67 percent of slaves sent west, and 46 to 56 percent of slaves in all shipments were delivered by traders. These numbers fall close to the middle if not the upper-middle range found in Table 1.
PERCENTAGE OF SLAVES SHIPPED BY TRADERS BASED ON THE PF METHOD, THE VARIABLE ON THE X-AXIS IS A CUTOFF VALUE OF THE PF VARIABLE FOR DEFINING WHO IS A TRADER

CONCLUSIONS
Bancroft is no longer correct that no one has ever suggested a method for estimating the share of slaves transported by traders. We now have four methods: the Fogel-Engerman equation; Tadman's interpretation of that equation; Pritchett's errors in variables approach; and here a study of some 24,400 slave manifests.
What have we learned? First, all successive studies to the first algebraic method agree that the Fogel-Engerman estimate of 16 percent is far too low. Second, estimates in this article vary widely, from 39.3 to 61.6 percent, but there are good reasons to discount the lower and upper figures, which are based on extreme values in sensitivity tests. The lower number includes relatively more shipments by owners traveling with their servants, which were not part of the trade, and also reverse migration, which to some extent was not part of the interregional movement that stressed the slave family. For these reasons, we discount the figure of 39.3 percent in favor the estimate of 53.1 percent for Atlantic to Gulf port shipments given in the second part of Table 5. Still, this figure is based on a method of matching names that inevitably misses some traders, even after corrections for frequent shipments by people with the same name. Therefore, 53.1 percent might be taken as a lower bound.
Is the upper end of 61.6 percent too high? Tadman would not think so, but that number applies to a special case of defining traders, in part, using a cutoff of only three or more shipments about the same time by a person with the same last name in a particular state. Most likely this cutoff includes some planters who simply made several voyages to transport their human property, or from the coincidence of different people with the same name.
A final parting observation concerns the increasing role of traders as the antebellum period progressed, rising by 9.9 percentage points from 1820–1839 to 1840–1859. Therefore pressure created by the trade on the family was at its height in the two decades before the Civil War. Relative to estimates of the trade over the entire chronological span of the manifests, this further dampened the cohesiveness of the extended family immediately following emancipation.