INTRODUCTION
Species-rich communities of vascular epiphytes usually show a pronounced vertical stratification within forests (Johansson Reference JOHANSSON1974, Krömer et al. Reference KRÖMER, KESSLER and GRADSTEIN2007, ter Steege & Cornelissen Reference TER STEEGE and CORNELISSEN1989, Zotz Reference ZOTZ2007), paralleling gradients in environmental conditions. For one, solar radiation declines by about two orders of magnitude from outer canopy to forest floor (Walsh Reference WALSH and Richards1996), which led Pittendrigh (Reference PITTENDRIGH1948) and Fischer & Araujo (Reference FISCHER and ARAUJO1995) to propose that this light gradient is the primary driver behind the vertical segregation. Humidity is another microclimatic factor that is believed to be of major importance (Graham & Andrade Reference GRAHAM and ANDRADE2004, Hietz & Briones Reference HIETZ and BRIONES1998) since it is much more constant in the understorey than in the canopy, although, due to interception, epiphytes may receive less precipitation in the understorey than in the outer canopy (Graham & Andrade Reference GRAHAM and ANDRADE2004).
Species differences in regeneration requirements, the regeneration niche (Grubb Reference GRUBB1977), may play a major role in plant species coexistence. Germination and establishment success of vascular epiphytes in the field is generally low (see Toledo-Aceves & Wolf Reference TOLEDO-ACEVES and WOLF2008 and references therein) and seedlings are often more vulnerable to abiotic stressors than larger plants (Lorenzo et al. Reference LORENZO, MANTUANO and MANTOVANI2010, Zotz et al. Reference ZOTZ, HIETZ and SCHMIDT2001) making the very first life stages a potential bottleneck for the spatial distribution of a species. Therefore, we focus on the role of germination and establishment of small seedlings in this study.
Surprisingly, it has rarely been explicitly investigated whether the heights at which different species occur within a forest (and, thus, the average microclimatic conditions they experience) actually coincide with their autecological optima (but see Graham & Andrade Reference GRAHAM and ANDRADE2004, Griffiths & Maxwell Reference GRIFFITHS and MAXWELL1999, Hietz & Briones Reference HIETZ and BRIONES1998, Zotz et al. Reference ZOTZ, PATIÑO and TYREE1997). For unambiguous conclusions, both detailed information on vertical distributions at a given locality as well as pertinent experimental ecophysiological data are needed. Our study meets this requirement. We possess spatial distribution data of our study species (12 spp.), belonging to the important vascular epiphyte families Bromeliaceae and Araceae, in the San Lorenzo protected area, Panama (Mendieta-Leiva, Wagner & Zotz unpubl. data) where we also quantified microclimatic variation at different heights within the forest. Virtually all existing work on the role of the regeneration niche for the spatial distribution of epiphytes has been conducted with bromeliads (Bader et al. Reference BADER, MENKE and ZOTZ2009, Toledo-Aceves et al. Reference TOLEDO-ACEVES, GARCÍA-FRANCO, LANDERO LOZADA, LEÓN MATEOS and MACMILLAN2012, Winkler et al. Reference WINKLER, HÜLBER and HIETZ2005). Thus, a study focusing on other taxa such as Anthurium allows more generalizable conclusions. We related height distributions of our study species to the results of ex situ experiments, which examined the germination response of all of them and of seedling growth of four of the Araceae species to recurrent drought. Additionally, we transplanted seedlings of six of the Araceae species to different heights in trees and monitored their survival. We hypothesized that species with a lower median attachment height, when submitted to long recurrent drought periods, would have a more strongly reduced (1) germination rate and/or final germination success and (2) seedling growth rate than those with a higher median attachment height. Accordingly, we expected that species with a lower median attachment height would have a lower seedling survival if transplanted to exposed sites (3).
METHODS
Field site and study species
The field work for this study was conducted at the San Lorenzo Canopy Crane Site (located within the 12 000-ha San Lorenzo protected area) at the Atlantic coast of Panama (9°17′N, 79°58′W, 130 m asl) (Wright et al. Reference WRIGHT, HORLYCK, BASSET, BARRIOS, BETHANCOURT, BOHLMAN, GILBERT, GOLDSTEIN, GRAHAM, KITAJIMA, LERDAU, MEINZER, ØDEGAARD, REYNOLDS, ROUBIK, SAKAI, SAMANIEGO, SPARKS, BAEL, WINTER, ZOTZ, Basset, Horlyck and Wright2003). At this site, the use of a small gondola grants access to all strata of a 0.9-ha forest plot. Mean annual air temperature is 25.8 °C; mean annual rainfall amounts to 3150 mm. The dry season lasts from January to April. Average monthly precipitation in February, March, July and August – the months in which we measured microclimate – is 46 mm, 63 mm, 350 mm and 385 mm, respectively (9-y precipitation measurements on the top of the crane by STRI's physical monitoring program: http://biogeodb.stri.si.edu/physical_monitoring). Canopy height of this undisturbed rain forest is quite variable, a few emergent trees reaching a maximum of c. 45 m. The studied plot is crossed by a small creek (c. 2 m wide) and covers the two slopes towards this creek.
As study species we chose all locally abundant bromeliads (Catopsis sessiliflora (R. & P.) Mez, Guzmania subcorymbosa L.B. Sm., Tillandsia anceps Lodd., T. bulbosa Hook. and Werauhia gladioliflora (H. Wendl.) J.R. Grant) and all locally abundant Anthurium species in the aroid family (Anthurium acutangulum Engl., A. brownii Mast., A. clavigerum Poepp., A. durandii Engl., A. friedrichsthalii Schott, A. hacumense Engl. and A. scandens (Aubl.) Engl.). All studied bromeliad seeds have plumose appendages and are wind-dispersed (Benzing Reference BENZING2000) during the dry season (Croat Reference CROAT1978), whereas the colourful berries of the Anthurium species are presumably dispersed by birds (Snow Reference SNOW1981) during the wet season (Croat Reference CROAT1978). All studied species are C3 plants with the exception of Tillandsia bulbosa that uses the CAM photosynthetic pathway (Zotz Reference ZOTZ2004). Werauhia gladioliflora is quite massive when reaching its adult size (longest leaf length (LL) measured in the census being 120 cm), while the remaining bromeliads are much smaller (LL of Tillandsia anceps, Guzmania subcorymbosa, Tillandsia bulbosa and Catopsis sessiliflora are 66, 56, 43 and 16 cm, respectively). With the exception of the atmospheric Tillandsia bulbosa, all studied bromeliads possess water-impounding tanks. Anthurium hacumense, A. clavigerum and A. brownii (LL 80, 86 and 89 cm, respectively) are by far the largest local members of this genus, while the remaining species are considerably smaller (LL of A. friedrichsthalii, A. acutangulum, A. durandii and A. scandens are 48, 39, 31 and 12 cm, respectively).
Microclimate measurements
We measured relative humidity (RH), temperature (T) and illuminance at 5-min intervals. Vapour pressure deficit (VPD) was calculated from relative humidity and temperature data as es − ea, where the saturation vapour pressure  ${e}_{s} = {6}{.112}{e}\frac{{{17}{.62}{T}}}{{({T}{\rm + }{243}{.12}{\rm)}}}$ (World Meteorological Organization 2008) and the actual vapour pressure
 ${e}_{a} = \frac{{{R}{H}}}{{{100}{e}_{s} }}$. Temperature and relative humidity were measured with HOBO U23–001 data loggers (Onset Computer Corporation, Cape Cod, USA). Sensor accuracy for T is ±0.2 °C. Sensor accuracy for RH is typically ±2.5% below 90% RH and increases to ±4.5% close to 100%. Illuminance was measured with HOBO UA-002–64 data loggers. The right skewed response curve of the logger's sensors goes from c. 200–1200 nm and peaks at about 900 nm (see product specifications on the Onset webpage: http://www.onsetcomp.com/products/data-loggers/ua-002–64) whereas the standard PPFD sensors are designed to respond uniformly to wavelengths between 400–700 nm. Although the ‘HOBO lux units’ and PPFD are thus not directly convertible, values are closely correlated (r2 = 0.88, Wagner et al. Reference WAGNER, BADER and ZOTZ2013) and our measurements provide a reliable proxy for PPFD. (Note that the loggers do not measure illuminance in the narrow sense, since the sensor's wavelength sensitivity does not match the luminosity function.) Custom-made open shelters protected the T/RH loggers from direct sunlight and rain. The light loggers were placed upon the roof (measuring 20 × 10 cm) and received full light at the spot of attachment. Loggers were attached to the trees facing south (or south-east, if strict adjustment to the south was not feasible). Measurements were taken at three different heights per tree: 0.5, 10 and 20 m above the ground. If a tree did not reach 20 m, the data loggers were attached as high up as possible (not < 17 m). Additionally, one logger set was attached to the crane above the canopy (52 m high). In the following, we will refer to these height levels as understorey, midstorey, canopy and above canopy, although actual canopy height varied substantially within the plot. Microclimatic measurements were taken in 2010 and 2011 with slightly different measurement designs. In 2010, we attached data loggers along the trunk of only one tree at a time (trees were chosen randomly out of all trees inside the crane plot with a dbh ≥ 20 cm). Measurements were taken on 5 days in the dry season (21, 24 and 26 February, 9 and 20 March, due to logger failure, no illuminance data are available for 20 March). In 2011, we attached data loggers along the trunks of three trees at a time. We selected three tree species (Brosimum utile (Kunth) Oken, Marila laxiflora Rusby and Tapirira guianensis Aubl.), which had a sufficient number of large trees in the crane plot and regularly hosted the study species. Five trees per species were chosen randomly out of all individuals inside the crane plot with a dbh ≥ 25 cm and, per measurement day, one tree of each species was armed with loggers. Measurements were taken during 5 days in the early rainy season (8 and 29 July, 5, 11 and 13 August).
Height distributions
We used the data of a complete census of vascular epiphytes within an area of c. 0.9 ha (Mendieta-Leiva et al. unpubl. data): Between September 2009 and March 2012 more than 3000 trees were inspected and almost 22 000 epiphytic individuals were censused. Collected information relevant in the context of the present study was attachment height and plant size. Only individuals large enough to allow unambiguous determination (i.e. > 2 cm longest leaf length) were considered for the analysis of the height distribution of our study species.
Germination experiment
The bromeliad germination experiment was conducted in 2010 at the University of Oldenburg. Seed material for each species was obtained from a single individual. After coma hairs of dry bromeliad seeds were cut, seeds were sterilized as follows: they were submerged in 70% ethanol for 2 min, rinsed with distilled water, kept in commercial bleach (Clorox®; 5–10% NaClO) for 45 min, rinsed again three times and then left to imbibe for 10 min in distilled water. Afterwards, they were placed in Petri dishes lined with filter paper (20 seeds per dish) and 1 ml water was added. Petri dishes were kept in a climate chamber (12 h d, PPFD c. 95 μmol m−2 s−1, T = 25 °C; Snijders Scientific, Tilburg, the Netherlands; model no. ECD01E). Four treatment levels represented increasing periods of intermittent drought (Bader et al. Reference BADER, MENKE and ZOTZ2009): filter paper constantly moist (W) or dry for 2 h/24 h (D-1), 6 h/24 h (D-2) and 22 h/48 h (D-3). We established that it takes filter paper about 2 h to dry out. Hence, the D-1 treatment level was achieved by daily removal of the Petri dishes lid for 4 h, then seeds were moistened again and the lid kept closed until the following day. The other treatment levels were achieved accordingly. Each treatment was replicated three times with the exception of Tillandsia bulbosa (only two replicates). Up to a maximum of 28 d, seeds were checked on a daily basis for germination (defined as visible emergence of the hypocotyl), infection by fungus and colour change (indicating the death of the seed).
The germination experiment with Anthurium seeds was conducted in 2011 in a shade house in Gamboa, Panama. Seeds of three individuals per species were used and each of three replicates held seeds from a different individual. The pericarp of the Anthurium berries was removed; the seeds were washed and sterilized as described above, placed in Petri dishes (20 seeds per dish) and assigned to four treatments. Opening times of Petri dishes and amount of water added were chosen to reach similar dry periods as in the bromeliad experiment. However, as in the shade house relative humidity and temperature could not be kept constant, a certain day-to-day variation in the length of dry periods was unavoidable but this variability does not change the overall rank of the dry-period lengths. As in the bromeliads, seeds were checked daily (germination being defined as visible emergence of the radicle) up to 28 d. All seeds that had not germinated within this period were subsequently kept constantly wet to test their viability. As ripe fruits were not available simultaneously and cannot be stored for long periods, the experiments were started whenever infructescences could be collected in the field but different starting times should not affect our results, since we found no temporal trend in climatic conditions (correlation between max. daily VPD and day after start of experiment: r70 = −0.01, P = 0.92).
Vapour pressure deficits were much higher in the shade house than at the natural growing site of the plants: whereas minimum daily VPDs differed only occasionally from zero during the experimental period, maximal daily VPDs in the shade house (mean ± SD = 1.75 ± 0.55 kPa, n = 72) were significantly higher (Welch's t-test; t16.26 = −6.26, P < 0.001) than maximal daily VPDs at the exposed measuring location above the canopy (0.89 ± 0.40 kPa, n = 11).
Growth experiment
The growth experiment was conducted with four Anthurium species (A. acutangulum, A. brownii, A. durandii and A. hacumense) in the shade house in Gamboa parallel to the germination experiments with Anthurium at the beginning of the 2011 rainy season. Seedlings used for this experiment were grown from seeds on cotton wool, which was routinely allowed to dry out to harden the seedlings. All seedlings of a species stemmed from the same mother plant. Approximately 5-wk-old seedlings were weighed (balance: Sartorius Handy H110, precision: 0.1 mg, minimal measured weight of a seedling: 1.3 mg) and placed into small plastic containers lined with filter paper (five seedlings per container). Average fresh weight ± SD (n = 100) of the seedlings was: 7.7 ± 2.3 mg (A. acutangulum), 25.7 ± 7.1 mg (A. brownii), 27.2 ± 5.8 mg (A. durandii) and 18.3 ± 3.4 mg (A. hacumense). The desiccation treatments were identical to those of the germination experiment. Of each species, 25 seedlings were assigned to each treatment. After 58 d, the experiment was ended and the seedlings were reweighed. For practical reasons the start of the experiment was out of phase: the experiment was started with A. durandii and A. brownii and 2 wk later A. hacumense and A. acutangulum were added. Mean daily vapour pressure deficit did not differ significantly between the non-overlapping weeks (t22.06 = −1.23, P = 0.23). In order to establish fresh weight to dry weight relationships, 20 seedlings per species, representing the whole size range, were selected. After determining fresh weight, the seedlings were dried for more than 72 h at 70 °C and weighed again (balance: A&D ER-182A, precision: 0.02 mg, minimal measured dry weight of a seedling: 0.4 mg).
Relative growth rates were calculated after Hunt (Reference HUNT1982) as  ${\it RGR} = \frac{{({\rm In}\,DW_{{\it end}} - {\rm In}\,DW_{{\it start}} ) \times 100}}{{\Delta t}}$. DWend and DWstart are the (calculated) dry weights at the beginning and at the end of the experiment and Δt is the duration of the experiment. In order to correct for seed remains, we subtracted the average species-specific dry weights of the attached seeds at the beginning and at the end of the experiment from the dry weights of the seedlings when calculating relative growth rates.
Transplantation experiment
We transplanted seedlings of six Anthurium species (A. acutangulum, A. brownii, A. clavigerum, A. durandii, A. friedrichsthalii and A. hacumense) during the rainy season in August 2011. Infructescences were collected at the field site and seeds were grown as described for the growth experiment. The 1–3-mo-old seedlings had at most two leaves ranging 0.4–2.1 cm in length. They were transplanted to nine trees (a subset of those at which microclimate measurements were taken in 2011; three individuals of each of the three species; height: 18–29 m; dbh: 27–64 cm). Seedlings were attached to three heights per tree: 0.5, 10 and 20 m (three trees did not reach a total height of 20 m; here the highest attachment height was > 17 m). Per height and tree, three seedlings of each species were attached in a random order facing south by putting them below an elastic band, which was attached with drawing pins to the tree. At lower heights, seedlings were attached to the trunk; at maximum height, seedlings were mostly attached to branches with a diameter of about 5 cm. Survival was recorded after 5 mo (at the beginning of the dry season in January 2012) and after 14 mo (in October 2012).
Data analysis
For statistical analyses and graphs we used the program R version 2.15.0. Add-on libraries used are specified below. Plots of diel courses of microclimatic patterns were generated using the ggplot2 package (Wickham Reference WICKHAM2009). To analyse the effect of season and height on microclimatic parameters (T, VPD and illuminance), minimal adequate models for daily minimum (only T), average and maximum of the microclimatic parameters were obtained via backward selection from a full model (including season, attachment height and their interaction) using linear modelling, allowing variances to differ by stratum (gls function, nlme package) if this improved the model fit (Zuur et al. Reference ZUUR, IENO, WALKER, SAVELIEV and SMITH2009). For illuminance, we did not run the analyses with the absolute measured values but with relative values calculated as the percentage of the highest value (331 klx) observed in the measurement campaigns. From the 2011 data, measurements of only one tree d−1 were included. Differences between height levels were tested for significance using multiple comparisons of means with Tukey contrasts using the glht function, multcomp package (Hothorn et al. Reference HOTHORN, BRETZ and WESTFALL2008).
Differences of attachment height between species were analysed with an ANOVA followed by the DTK test (DTK package), allowing for unequal sample sizes. We considered trees as independent sampling units and averaged the height of all individuals of a species growing on the same tree. To improve the model fit, a power transformation was applied prior to analysis. The optimal power transformation was determined with aid of the Box-Cox function in the MASS package (Venables & Ripley Reference VENABLES and RIPLEY2002).
Germination curves were fitted using the grofit package (Kahm et al. Reference KAHM, HASENBRINK, LICHTENBERG-FRATÉ, LUDWIG and KSCHISCHO2010) that fits four parametric models to the data and returns the most suitable one. After visual inspection of the curves we decided whether the parametric model or a model-free fit should be applied. In most cases all seeds in a Petri dish germinated. Thus, we chose a response variable for the ANCOVA that represents both final germination success and germination rate as treatment effects: the area under the fitted germination curve (it is < 28 d (the duration of the experiment) if (1) not all seeds germinate the first day and/or (2) if final germination success is less than 100%). Reduced germination velocity should ultimately lead to reduced germination success as seeds fall off the substrate much more easily than seedlings. We fitted the data to a non-parametric ANCOVA model using the fANCOVA package.
The growth experiment data were analysed with an ANOVA using generalized least squares (variances were allowed to differ by stratum). Significance of differences between species and between treatments within species was tested using Tukey contrasts.
The effects of species-specific median attachment height and transplantation height on seedling survival were analysed with generalized linear mixed-effect models with a binomial error distribution and a logit link function using the lme4 package. Transplantation height and tree were included as random effects (transplantation height nested within tree). The minimal adequate model was obtained via backward selection from the full model (including transplantation height, median attachment height and their interaction).
RESULTS
Microclimate measurements
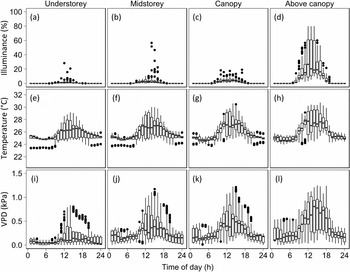
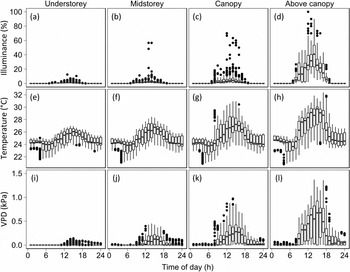
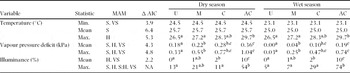
While height gradients of microclimatic parameters were pronounced during daytime, they almost disappeared at night (Figures 1 and 2). The maximal daily temperature difference between strata ranged between 0.6 °C and 5.0 °C (mean ± SD = 2.7 °C ± 1.5 °C, n = 10). For relative humidity these figures ranged between 5% and 18% (12% ± 4%, n = 10). For comparison, the maximal difference between different measuring days (n = 10) at the same time of day and measuring height was 3.6 °C (T) and 12% (RH). Night temperature (daily minimum) and daily mean temperature were significantly lower during the wet season as compared with the dry season; daily maximum temperature increased with height but did not depend on season (Table 1). Daily mean and maximum VPD were significantly lower in the wet season and increased with height. In the wet season, minimum VPD was invariably 0 kPa at all heights while in the dry season it was significantly higher (albeit not influenced by height). Daily mean illuminance did not depend on season but decreased strongly inside the vegetation. Even at 20 m (canopy) only 22% of the above-canopy mean daily illuminance was reached and in the understorey this value dropped to 6%.
Diel courses of microclimatic variables during the dry season at different heights in the forest. Microclimatic variables are illuminance given in per cent of the maximum measured value (a–d), temperature (e–h) and vapour pressure deficit (i–l); measurements were taken every 5 min on 5 (in the case of illuminance 4) d in February and March 2010. Boxplots are based on hourly means. For better comparison between dry and wet season, y-axes have the same scales in Figures 1 and 2.

Diel courses of microclimatic variables during the wet season at different heights in the forest. Microclimatic variables are illuminance given in per cent of the maximum measured value (a–d), temperature (e–h) and vapour pressure deficit (i–l); measurements were taken every 5 min on 5 d in July and August 2011, with three replicates per height and day. Measurements above the canopy were not replicated. Boxplots are based on hourly means. For better comparison between dry and wet season, y-axes have the same scales in Figures 1 and 2.

Microclimatic variables in relation to season and height in the forest. Dry-season data were determined on 5 (in the case of illuminance 4) days in February and March 2010; wet-season data were determined on 5 days in July and August 2011. We analysed the effect of season (S), measurement height (H) and their interaction (S : H) on daily minima, means and maxima of the microclimatic variables. (Illuminance is given in per cent of the maximum measured value.) Minimal adequate models (MAM) were obtained via backward selection from a full model (FM) using linear modelling (Δ AIC = AICFM – AICMAM); given are the included model terms and whether variances were allowed to differ by stratum to improve model fit (variance structure, VS). Also presented are parameter estimates of the MAMs for the microclimatic variables by season and measurement height (U: understorey, M: midstorey, C: canopy, AC: above canopy). Differences between heights within season were tested using Tukey contrasts, different superscript letters indicate significant differences. Daily minimum VPD was 0.05 ± 0.08 kPa (mean ± SD) in the dry season and invariably 0 kPa in the wet season. Height differences in the dry season were not significant. A Wilcoxon rank sum test was performed to test for seasonal differences (P < 0.001).

Height distributions
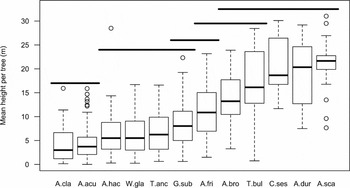
Significant differences in observed growing heights between groups of study species were found, although species generally showed a rather broad height distribution and some species, e.g. Anthurium friedrichsthalii and Tillandsia bulbosa, were found at almost any height (Figure 3).
Height distributions of study species in the forest. To ensure independence of the data, height distributions were calculated using the mean height of all individuals growing on a given tree. Sample sizes: Anthurium clavigerum (A.cla): 79, A. acutangulum (A.acu): 120, A. hacumense (A.hac): 70, Werauhia gladioliflora (W.gla): 89, Tillandsia anceps (T.anc): 52, Guzmania subcorymbosa (G.sub): 29, A. friedrichsthalii (A.fri): 65, A. brownii (A.bro): 16, T. bulbosa (T.bul): 28, Catopsis sessiliflora (C.ses): 11, A. durandii (A.dur): 21, A. scandens (A.sca): 17. To improve model fit height data were transformed by raising to the power of 0.43 (Box-Cox transformation, depicted data are untransformed). The horizontal lines join species that do not significantly differ in their mean height distribution following the DTK pairwise multiple comparison tests.

Germination experiment
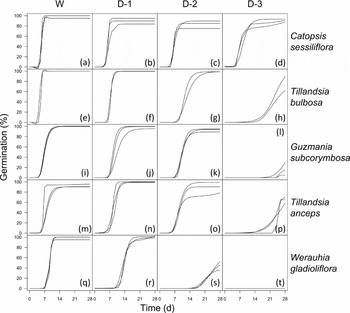
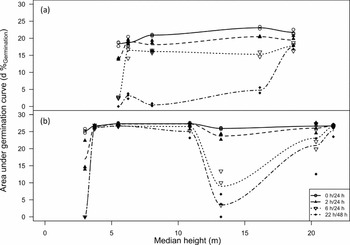
Intermittent drought hardly affected germination in C. sessiliflora. This species, which grows in the upper canopy at San Lorenzo, showed no reduction in final germination success and only slight retardation even under the most severe conditions (Figure 4). All other bromeliads, particularly those from understorey sites, showed substantially reduced germination rates with longer drought periods. In W. gladioliflora not a single seed germinated within 28 d in the most severe treatment (D-3) and in Guzmania subcorymbosa germination success was reduced to < 20%. This supports our hypothesis that germination is more strongly reduced by recurrent drought in species that grow (on average) lower in the forest as compared with species that grow more exposed (Figure 5a).
Cumulative germination of bromeliad species over the course of 28 d in response to varying water supply. Shown are the germination curves that were fitted to the data. Each curve represents cumulative germination in one of three replicate Petri dishes with 20 seeds each (in the case of Tillandsia bulbosa only two dishes). The studied species, Catopsis sessiliflora (a–d), Tillandsia bulbosa (e–h), Guzmania subcorymbosa (i–l), T. anceps (m–p) and Werauhia gladioliflora (q–t), are sorted from top to bottom according to their median attachment height in the forest (highest to lowest). Duration of dehydration periods: 0 h/24 h (W), 2 h/24 h (D-1), 6 h/24 h (D-2), and 22 h/48 h (D-3).

Integrated germination response in the bromeliad (a) and aroid (b) germination experiments in relation to median height and recurrent drought treatment. The response variable is equal to the area under the fitted germination curves (d %) in Figures 4 and 6. Experiments were run for 28 d. Treatments: different duration of dehydration period. Non-parametric curves were fitted using the fANCOVA package.

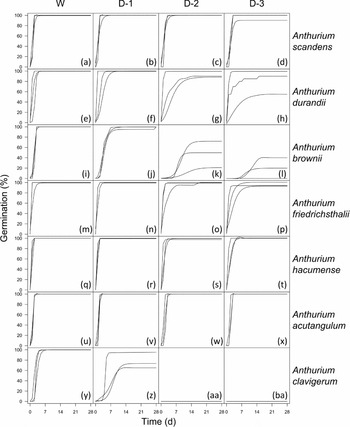
Substantial variation in the sensitivity of germination to intermittent drought intervals was also observed among Anthurium species (Figure 6), but it was not correlated with mean attachment height in the forest (Figure 5b). While the strong response of Anthurium clavigerum (no germination in the D-2 and D-3 treatment) was expected because of its low average attachment height, other understorey epiphytes (A. acutangulum and A. hacumense) showed almost no treatment effect. However, these species germinated so rapidly that treatments could hardly be effective after the initial soaking during sterilization.
Cumulative germination of aroid species over the course of 28 d in response to varying water supply. Shown are the germination curves that were fitted to the data. Each curve represents cumulative germination in one of three replicate Petri dishes with 20 seeds each. The studied species, Anthurium scandens (a–d), A. durandii (e–h), A. brownii (i–l), A. friedrichsthalii (m–p), A. hacumense (q–t), A. acutangulum (u–x) and A. clavigerum (y–ba), are sorted from top to bottom according to their median attachment height in the forest (highest to lowest). Duration of dehydration periods: 0 h/24 h (W), 2 h/24 h (D-1), 6 h/24 h (D-2), and 22 h/48 h (D-3).

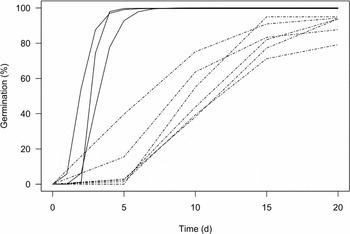
Almost all Anthurium seeds that had not germinated during the experiment remained viable: 87% of these seeds germinated when sufficient water was supplied in the aftermath. For A. clavigerum, enough ungerminated seeds were available to compare the areas under the post-experimental germination curves of seeds pretreated with the D-2 and D-3 treatments to those of the fresh seeds that were submitted to the W treatment in the first place. We found that pretreated seeds germinated more slowly (t6.55 = 9.09, P < 0.001; Figure 7).
Cumulative germination curves of pretreated and control A. clavigerum seeds in the constantly wet treatment. Dashed lines: seeds pretreated for 28 d by recurrent drought treatments (duration of dehydration periods: 6 h/24 h or 22 h/48 h respectively), solid lines: fresh seeds (control). Each line represents one replicate Petri dish with 20 seeds.

Generally, bromeliad seeds germinated more slowly than Anthurium seeds (t20.35 = −8.19, P < 0.001). Bromeliad seeds needed, on average, 9 d until all seeds had germinated in the constantly wet treatment, while Anthurium seeds needed only 3 d.
Growth experiment
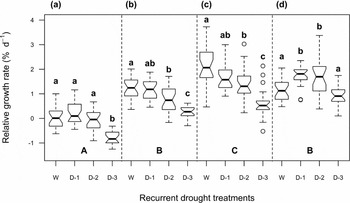
Seedling growth in the studied aroids varied significantly with species (F3,361 = 295, P < 0.001) and treatment (F3,361 = 97.6, P < 0.001), with a significant interaction (F9,361 = 5.41, P < 0.001). Anthurium acutangulum, A. hacumense and A. brownii seedlings showed a similar pattern in their response to the recurrent drought treatments: they performed best in the two mildest treatments and worst in the harshest treatment (Figure 8). A different response pattern was exhibited by A. durandii, which grows most exposed: relative growth rates were highest in the D-1 and D-2 treatments, while they were reduced in both the W and the D-3 treatment.
Relative growth rates of Anthurium acutangulum (a), A. hacumense (b), A. brownii (c) and A. durandii (d) in response to dehydration treatments. Duration of dehydration periods: 0 h/24 h (W), 2 h/24 h (D-1), 6 h/24 h (D-2), and 22 h/48 h (D-3). Different letters indicate significant differences between species (uppercase letters) and between treatments within species (lowercase letters). Species are ordered from left to right according to their median attachment heights in the forest (4, 6, 13 and 20 m).

The most vigorous growth was found in A. brownii (highest observed RGR: 3.7% d−1). Seedlings of the understorey species A. acutangulum hardly increased in mass at all (highest observed RGR: 1.2% d−1) (Figure 8); even in the constantly wet treatment, RGR did not differ significantly from zero in A. acutangulum (t21 = 0.39, P = 0.70).
Transplantation experiment
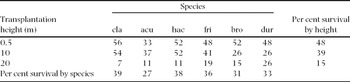
In January 2012, 5 mo after starting the experiment, about a third (34%) of 485 transplants were still alive (Table 2). In October 2012, 14 mo after starting the experiment, 9% of the seedlings were still alive. (We could relocate 23 of 27 transplantation patches with, originally, 408 seedlings.) Survival depended heavily on the specific patch to which a seedling had been transplanted: After 14 mo, in seven out of eight relocated understorey patches (originally 18 transplants per patch) the number of surviving seedlings ranged from 0–3 (median = 1), while in one single patch 13 seedlings survived. In the canopy, not a single seedling survived in five out of six relocated patches, while in the sixth patch seven seedlings were still alive.
Seedling survival after transplantation. Given is the percentage survival per study species and transplantation height 5 mo after transplantation. Species are ordered according to the median height at which they were found in the forest. cla: Anthurium clavigerum, acu: A. acutangulum, hac: A. hacumense, fri: A. friedrichsthalii, bro: A. brownii, dur: A. durandii.

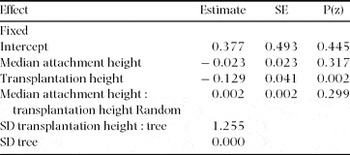
Survival probability of transplants decreased from the understorey to the canopy (Table 2) but, contrary to our expectation, survival probability at different transplantation heights did not interact with the median attachment height of a species in the census (Table 3). The best model included only transplantation height as a fixed factor. The second census 9 mo later, after the dry season, yielded consistent survival patterns: transplants had a higher survival probability in the understorey as compared with the midstorey (canopy data were not considered due to low sample sizes) but an influence of species-specific attachment height was absent (results not shown).
Survival probability of seedlings 5 mo after transplantation in relation to median attachment height and transplantation height and their interaction. Generalized linear mixed-effect model, binomial, fitted with the Laplace approximation. Given are the specifications for the full model: Median attachment height and transplantation height were treated as fixed factors, trees and transplantation height within tree as random factors. Number of transplants: 485, number of trees: 9, number of heights per tree: 27.

DISCUSSION
We quantified vertical microclimatic gradients at our field site, which coincided with significantly different height distributions of our study species within the forest. As a working hypothesis, we expected to find a simple relationship between the height distributions of the species and their sensitivity to recurrent drought treatments during germination and the seedling stage. Our results do not show such a simple relationship. However, our data do not invalidate the notion of a link between microclimatic gradients and vertical species distribution, but rather paint a more complex picture of species-specific differences in the early ontogeny.
There are clear microclimatic height gradients at our study site during daytime, their strengths depending on prevailing weather conditions. However, documenting gradients at a coarse scale conceals that height is actually a rather poor proxy for the microclimatic conditions at a specific growing site. For example, there are pronounced rather local horizontal temperature and humidity gradients within tree crowns (Freiberg Reference FREIBERG1997). Besides height, there are many other factors that may influence the microclimate an epiphyte experiences. Some of these factors, such as the proximity of the forest edge (Davies-Colley et al. Reference DAVIES-COLLEY, PAYNE and ELSWIJK2000), of a gap or stream (Rambo & North Reference RAMBO and NORTH2008) or the situation on a ridge or in a valley (Werner et al. Reference WERNER, HOMEIER, OESKER and BOY2012), relate to the location of the host in the forest. Other factors, such as deciduousness (Andrade & Nobel Reference ANDRADE and NOBEL1997) and canopy architecture, depend on the actual host species. And still other factors, such as distance to the (forest's) canopy, substrate angle and diameter, cardinal direction and presence of bryophytes (Zotz & Vollrath Reference ZOTZ and VOLLRATH2003), lianas and other vascular epiphytes (Stuntz et al. Reference STUNTZ, SIMON and ZOTZ2002), relate to the growing site of the epiphyte on the host.
In view of this plethora of factors influencing microclimatic conditions, in addition to direct effects of the host trees such as bark structure and chemistry (Callaway et al. Reference CALLAWAY, REINHART, MOORE, MOORE and PENNINGS2002), the vertical zonation of our study species seems almost surprising. However, all existent additional information for our study species from other sites indicates consistent height distribution arguing against accidental patterns: Pittendrigh (Reference PITTENDRIGH1948), in his classic study of bromeliads on Trinidad, placed Catopsis sessiliflora into the exposure group, Tillandsia bulbosa into the sun group and Tillandsia anceps into the shade-tolerant group. Similarly, in a montane forest in Mexico, Catopsis sessiliflora grows exposed on small-diameter branches (Hietz et al. Reference HIETZ, AUSSERER and SCHINDLER2002). Anthurium clavigerum and Werauhia gladioliflora were growing significantly more often along the trunk or on understorey trees and shrubs while A. scandens was growing more often in the canopy in Bolivian submontane and montane forest (Krömer et al. Reference KRÖMER, KESSLER and GRADSTEIN2007). Finally, A. clavigerum was found to have a mean attachment height of 4.5 m on Barro Colorado Island, Panama (Meyer & Zotz Reference MEYER and ZOTZ2004), which is identical to the median attachment height in San Lorenzo.
To understand the importance of the regeneration phase for the spatial distribution, germination and seedling performance should be considered together since the treatment response during only one of these phases does not permit conclusions about the ability of a species to thrive under stressful conditions. For example, a species may be able to grow in the outer canopy if it (1) readily germinates under recurrent drought conditions and has physiological adaptations to these conditions (stress tolerance) or (2) delays germination until the onset of the wet season and, thus, ensures that seedlings experience favourable conditions (stress avoidance) (Hegarty Reference HEGARTY1978). Conversely, a species is excluded from the outer canopy by recurrent drought if it (1) never germinates under the prevailing conditions or (2) shows no germination response but fails to establish during the seedling phase. With regard to these considerations, our ex situ results (although incomplete) suggest that the regeneration phase is decisive for the vertical segregation pattern. For bromeliads, germination alone might be sufficient to explain the absence of understorey species in the canopy (understorey species were more affected than canopy species by the most severe recurrent drought treatment). For Anthurium, such a simple relationship was not found. While insensitivity of germination to recurrent drought seems to be a necessary, albeit not sufficient, feature for those species that grow at the most exposed sites in the forest (neither A. durandii nor A. scandens were sensitive to recurrent drought), the absence of some understorey species (A. acutangulum and A. hacumense) from exposed growing sites has to be explained by drought sensitivity at later life stages or different environmental factors like radiation, which could cause photodamage. Anthurium acutangulum is arguably excluded from higher forest strata at the seedling stage since it is very sensitive to stressful conditions: In the seedling growth experiment, RGRs were statistically indistinguishable from zero even in the constantly wet treatment because, obviously, either solar radiation or temperature were too high to permit any biomass gain. One of the aroid understorey species (Anthurium clavigerum) may indeed be excluded from exposed growing sites at the germination stage but even this species has the potential to persist a while ungerminated awaiting more favourable conditions for seedling survival. The response of seedling growth to recurrent drought reflects the vertical distributions of the four studied Anthurium species quite well. Most species (A. acutangulum, A. hacumense and A. brownii) showed a negative correlation between longer drought phases and RGR, whereas the species that grows under the most exposed conditions (A. durandii) showed a deviating pattern: growth was highest when seedlings experienced drought phases of moderate length (D-1 and D-2 treatment) and was reduced by both continuous moisture and long drought phases. Thus, A. durandii is potentially excluded from understorey sites by continuous moisture. In a very similar experiment, seedlings of Tillandsia flexuosa, a bromeliad species occurring in even drier habitats than the canopy position at our study site showed an analogous behaviour (Bader et al. Reference BADER, MENKE and ZOTZ2009).
The difference between aroids and bromeliads in the number of days until the onset of germination might reflect differences in the timing of seed dispersal. Whereas the studied aroids disperse their seeds during the rainy season, the studied bromeliads disperse them during the dry season, when conditions promote wind dispersal. If bromeliad seeds germinated immediately after an occasional dry season downpour, the newly emerged seedlings would run the risk of dying during a subsequent drought. It is certainly adaptive to delay germination until water supply is more reliable. Analogously, Garwood (Reference GARWOOD1983) grouped terrestrial plants in the nearby forest on BCI into those that disperse their diaspores before the onset of the wet season but delay germination until the wet season starts (as our bromeliads) and those that disperse their diaspores close to the beginning of the wet season (as our aroids).
The ex situ experiments suggest that germination and seedling performance, taken together, are sufficient to explain the vertical segregation of our study epiphytes to a large degree. But, as a caveat, it should be noted that experimental conditions differed substantially from the conditions epiphytes actually experience in the forest. We are also still ignorant of the actual temporal pattern of water availability at different heights in the forest and, therefore, cannot align our intermittent drought treatment with the natural conditions. To test the significance of ex situ experiments, it is thus indispensable to conduct complementary in situ experiments. Unfortunately, our transplantation experiment did not yield unambiguous results. This is not ruling out that vertical ranges are attributable to species-specific responses but certainly indicates that possible effects are small and easily concealed by much unexplained variance and strong microclimatic idiosyncrasies of specific sites. This is even more strongly underlined by the fact that ours was not the first study that failed to link differential species distributions within the vegetation to differential performance of early life stages in the field: Winkler et al. (Reference WINKLER, HÜLBER and HIETZ2005) could not find germination or survival differences between five bromeliad species in different canopy zones. Similarly, Zotz & Vollrath (Reference ZOTZ and VOLLRATH2002) conducted a seedling transplantation experiment with three bromeliad species having differential distributions within their host tree species and could not find differential survival in different canopy zones. Therefore, it is essential for future experiments to include a very high number of growing sites to ensure sufficient statistical power.
To conclude, we documented vertical microclimatic gradients and vertical segregation of groups of epiphytic species. Our experimental results suggest that differential species responses to moisture conditions during the regeneration phase play an important role in linking these patterns. To date, a crucial part of the chain of evidence is still missing, namely the confirmation of differential species performances at the regeneration stage under field conditions. Future studies investing a greater effort in such field experiments to obtain unambiguous results will show whether our notion is correct or whether later life stages or even differential dispersal patterns play a more important role for the vertical stratification pattern.
ACKNOWLEDGEMENTS
We thank the Republic of Panama for making its natural resources available for science (research permits: SE/P-32-09, SE/P-14-10, SC/P-26-10, and SE/P-3-11). Thanks to Dr S. J. Wright (STRI, Panama) for the opportunity to work at the crane, to Argelis Ruiz and Mirna Sarmaniego for organizing crane work and to Edwin Andrade and José Herrera for manoeuvring us through the canopy. Many thanks to Catherine Brunton for laboratory assistance, to Eduardo Sanchez for assistance in the field and to Juliano Sarmento Cabral and Gunnar Petter for rechecking the transplants in October 2012. The bromeliad experiments were part of Wiebke Bogusch's master's thesis. This work was funded by the DFG (Zo 94/5-1).