Implications
Results of this study can be used to determine the most appropriate body energy trait for selection that would contribute to the improvement of fertility in dairy cattle. Validated fertility records are still needed for this matter, but including body energy in a selection index will enhance the genetic progress of fertility. In this respect, the most useful traits are body condition score (BCS) and energy content measured in early lactation (circa 50 days post-calving). From a practical point of view, this implies scoring the body condition of dairy cows at the time of the second monthly milk test.
Introduction
Lactating cows require sufficient body energy to support important physiological functions such as milk production, growth, general activity and maintenance, and to provide correct metabolic signals to the reproductive and immune response systems. When energy taken in from feed is not sufficient to cover these requirements, cows enter a negative energy balance state and have to mobilise their own body lipid and protein reserves. Sutter and Beever (Reference Sutter and Beever2000) described the energy metabolism profile of high-producing Holstein cows especially in the crucial early stages of lactation.
Prolonged periods of negative energy balance have been associated with digestive and locomotive problems (Collard et al., Reference Collard, Boettcher, Dekkers, Peticlerc and Schaeffer2000), metabolic disorders (Goff and Horst, Reference Goff and Horst1997), udder-health issues (Banos et al., Reference Banos, Coffey, Wall and Brotherstone2006) and reduced reproductive performance (Reist et al., Reference Reist, Erdin, von Euw, Tschümperlin, Leuenberger, Hammon, Morel, Philipona, Zbinden, Künzi and Blum2003; Dechow et al., Reference Dechow, Rogers, Klei, Lawlor and VanRaden2004; Oikonomou et al., Reference Oikonomou, Arsenos, Valergakis, Tsiaras, Zygoyiannis and Banos2008).
At present, there is no universal agreement on a definition of body energy and different studies usually consider different traits. Direct measures of body energy have been proposed that are chiefly based on individual cow feed intake and milk yield (Veerkamp et al., Reference Veerkamp, Oldenbroek, van der Gaast and van der Werf2000; Coffey et al., Reference Coffey, Emmans and Brotherstone2001; Hüttmann et al., Reference Hüttmann, Stamer, Junge, Thaller and Kalm2009). Such measures, however, are mostly available in research herds because recording individual cow feed intake is practically unfeasible in a commercial population. Therefore, a number of indirect measures have been developed, mainly based on body condition (Collard et al., Reference Collard, Boettcher, Dekkers, Peticlerc and Schaeffer2000; Berry et al., Reference Berry, Buckley, Dillon, Evans, Rath and Veerkamp2002) or a combination of body condition and live weight (Coffey et al., Reference Coffey, Emmans and Brotherstone2001; Banos et al., Reference Banos, Coffey, Wall and Brotherstone2006).
Regardless of definition, the profile of body energy changes throughout lactation following changes in milk production and feeding patterns. Banos et al. (Reference Banos, Coffey and Brotherstone2005) proposed models to describe such profile changes in both direct and indirect body energy traits. Documented differences in body energy throughout lactation warrant further investigation of its genetic characterisation at different stages of lactation. Heritability estimates of indirect body energy traits have been shown to fluctuate across lactation (Berry et al., Reference Berry, Buckley, Dillon, Evans, Rath and Veerkamp2002; Coffey et al., Reference Coffey, Simm, Hill and Brotherstone2003), while genetic studies of direct body energy measured throughout the entire lactation, including the correlation with reproductive traits are largely missing.
The objective of this study was to quantify the genetic association of various direct and indirect body energy traits measured across lactation with dairy cow fertility.
Material and methods
Animals
This study was based on a cow resource population raised on the Scottish Agricultural College research station at Langhill, Scotland; in 2002, the herd moved to Dumfries, Scotland (55°02′N, 3°34′W, 40 m altitude), where it has been kept since. A total of 1325 Holstein cows that calved between 1990 and 2008 are included in the database. These cows have been participating in feed and genetic selection experiments conducted on the farm throughout this period. Briefly, cows are divided into equally sized control and selection lines, sired by UK average and high genetic merit bulls, respectively. Furthermore, each genetic line is split into two distinct groups that are fed high- and low-concentrate diets, respectively, in a total mixed ration; otherwise, all cows are kept and managed together.
Data
Individual cow records for milk yield and composition (fat and protein percentage), dry matter intake, live weight and body condition score were extracted from the farm database. Milk yield records were available almost daily (5 to 7 days/week) and were the sum of two milkings. Dry matter intake was recorded three times/week, whereas milk composition, live weight and BCS were available once a week for each cow. Live weight and BCS were recorded after the morning milking. Body condition was scored on a 0 to 5 scale in increments of one-fourth of a unit, with larger score indicating fatter animals.
A maximum of four lactations per cow were kept. Furthermore, cows were required to have a minimum lactation duration of 100 days and a minimum of two tests per lactation for each of milk yield and composition, dry matter intake, live weight and BCS. Recording started on the 4th day of lactation and records until day 311 post partum were kept in the data set.
The above data set consisted of longitudinal cow data recorded repeatedly throughout lactation. This data set was matched with a second data set obtained from the same farm including cow fertility records from the routine monitoring of their reproductive performance by farm staff. Fertility traits included interval (in days) between calving and first observed oestrus (DH), interval (in days) between calving and conception (DC) and number of services per conception (NS). Furthermore, the interval (in days) from calving to commencement of luteal activity (DLA) was determined based on daily milk progesterone levels in a subset of cows. This was defined as the interval between calving and the day of the first of two consecutive milk progesterone concentrations exceeding the value of 3 ng/ml (Pollott and Coffey, Reference Pollott and Coffey2008).
An additional edit required cows to be present in both data sets. After all edits, a total of 593 208 records of 1926 lactations of 957 cows were left for further analysis. However, DLA was available in just 327 lactations.
Calculation of daily phenotypes of longitudinal traits
Longitudinal traits (milk yield and composition, dry matter intake, BCS and live weight) did not have observations on every single day of lactation. Therefore, daily phenotypic records were calculated using the following model
(1):

where Y = individual trait record, mu = overall mean, F = fixed effect of feeding group (i = 1 or 2), G = fixed effect of genetic group (j = 1 or 2), YMR = fixed effect of year-by-month of record interaction (k = 1 to 240), YSC = fixed effect of year-by-season of calving interaction (l = 1 to 40), A = fixed effect of age at calving class (m = 1 to 3 for early, mid- and late- calving cows, respectively), pol(DIM) = fourth-order orthogonal polynomial of days in milk (n = 4 to 311) describing the overall fixed lactation curve, pol(DIM)xCOW = random effect of pol(DIM)-by-cow interaction describing the individual cow deviation from the lactation curve, e = random residual defined by different measurement error classes depending on stage of lactation.
Preliminary analyses were conducted using various models with regards to polynomial order and number of measurement error classes. Criteria for model evaluation included the log-likelihood (high values desirable), magnitude of residuals and residual variance, and mean square prediction error defined by the average ratio of residual squared over observation squared (low values desirable). Following these preliminary analyses, a model with a fourth-order polynomial and six measurement error classes was chosen. The latter were defined as 4 to 10, 11 to 17, 18 to 24, 25 to 31, 32 to 45 and ⩾46 days in milk, respectively.
Model (1) was fitted separately to each trait and lactation (1 to 4). Solutions for the fixed and random effects were used to predict daily records for each cow, day of lactation and trait analysed. Model (1) is a non-genetic model as no pedigree relationships were included and so combinations of model solutions essentially yield predicted phenotypic records for each day of lactation. At the end of this exercise, all cows had predicted records of milk yield and composition, dry matter intake, BCS and live weight for each day between the 4th and 311th day of lactation, and for a maximum of four lactations.
Calculation of body energy traits
In addition to BCS, three different traits describing the body energy status of a cow on each day of lactation were developed using daily phenotypic records of milk yield and composition, dry matter intake, BCS and live weight derived with model (1).
The first body energy trait was chiefly based on milk yield and content, dry matter intake and data on the chemical composition of feed. The latter was determined by monthly laboratory analyses of total mixed ration samples and comprised estimates of the metabolisable energy content, proportion of organic matter, in vitro organic matter digestibility and crude protein concentration. The methodology used to calculate this trait was based on the effective energy system of Emmans (Reference Emmans1994) as implemented by Coffey et al. (Reference Coffey, Emmans and Brotherstone2001). Briefly, effective energy intake was calculated from dry matter intake and feed analysis data, and compared to effective energy required for milk production (calculated from milk yield and composition), maintenance and activity. These measures of energy taken in v. energy expended on a daily basis yield estimates of the actual energy balance of an animal on each day of lactation, which is considered a direct body energy trait. A detailed description of energy balance calculation is provided in Appendix I.
The other two body energy traits were based on the profile of body lipid and protein weights across lactation, predicted from live weight and BCS changes, using formulae proposed by the United States National Research Council as per the Cornell Nutrient Management Planning System (National Research Council, 2001). One of these traits measures the actual energy content of a cow on a certain day of lactation and the other the cumulative effective energy (CEE) as it accrues since the onset of lactation. These traits are very similar to those described by Banos et al. (Reference Banos, Coffey, Wall and Brotherstone2006). Detail description of energy content and CEE calculations are provided in Appendix I.
In addition to the four longitudinal body energy traits (energy balance, energy content, CEE and BCS), five traits with a single observation per cow per lactation were defined. Three were based on energy balance and included duration (in days) of negative energy balance (DNEB), rate of recovery of energy balance during DNEB (RNEB) and sum of daily energy balance during DNEB (SNEB). These traits effectively describe the period of negative energy balance, which is observed at the onset of lactation. The other two traits were based on energy content and included its nadir (NEC) and interval (in days) from calving to NEC (DNEC).
Univariate genetic analysis
The four longitudinal body energy traits (energy balance, energy content, CEE and BCS) were analysed with the random regression model shown below; for comparison purposes, daily milk yield was also analysed with model
(2):

where Y = daily phenotypic record, spl(DIM) × COW = a cubic spline fitted at five knot points across days of lactation describing the random cow genetic effect (including pedigree relationships), spl(DIM) × PEW = a similar cubic spline describing the within lactation random permanent environmental effect, PE = random permanent environmental effect associated with each cow; all other effects were as defined in model (1). Effects in model
(2)were nested within lactation number (p = 1 to 4), effectively fitting an interaction of each fixed effect with parity and a between-lactation PE.
Cubic splines were preferred for this analysis because of their reported robustness, smoothness and capability of picking up features of the lactation curve that may be missed by orthogonal polynomials (White et al., Reference White, Thompson and Brotherstone1999). Such features may pertain to variance partitioning at either end of the lactation curve. Banos et al. (Reference Banos, Coffey and Brotherstone2005) showed that cubic splines were at least as good as, if not better than, orthogonal polynomials at modelling body energy across a cow’s lifetime. However, orthogonal polynomials had to be of a relatively high order (>6), implying high model complexity, in order to provide as good a fit as cubic splines (Banos et al., Reference Banos, Coffey and Brotherstone2005).
Cubic splines are functions whose values remain continuous between specific points on the lactation curve, known as knot points. In this study, five knot points were defined at 4, 81, 158, 235 and 311 days in milk, respectively, for the analysis of all traits except energy balance. For the latter, four knot points at 4, 81, 158 and 311 days in milk were defined. This was based on several preliminary analyses of models with different number (2 to 8) and positions of the knot points. The same criteria as for model (1) were used to evaluate these models, in addition to convergence issues. The knot points chosen largely reflect inflection points throughout lactation.
Each longitudinal trait (energy balance, energy content, CEE, BCS and milk yield) was analysed separately with model (2). Random effect solutions were used to calculate estimates of variance components (genetic, permanent environmental and residual) and heritability for each day of lactation and trait, pooled across the four lactations.
Multivariate genetic analysis
Model (2) was extended to accommodate bivariate analyses between longitudinal body energy traits (energy balance, energy content, CEE and BCS) or milk yield and fertility traits (DH, DC, NS and DLA) measured once per cow per lactation. The basic principle for extending a longitudinal trait model of analysis to include a trait with a single observation was the same as described by Veerkamp et al. (Reference Veerkamp, Koenen and de Jong2001) and Berry et al. (Reference Berry, Buckley, Dillon, Evans, Rath and Veerkamp2003b). Fertility traits were log-transformed to improve the properties of their distribution and were modelled by the same effects shown in model (2) barring the year-by-month of record effect and functions describing the lactation curve. Covariance components and genetic correlations were calculated for each day of lactation. These were pooled estimates across four lactations.
In addition, a series of multivariate analyses were conducted considering all traits with a single observation per cow per lactation. These included lactation milk yield (sum of all daily records), five body energy traits (DNEB, RNEB, SNEB, NEC and DNEC) and four fertility traits (DH, DC, NS and DLA). Similar to fertility, these body energy traits were also log-transformed to approximate a normal distribution. The model of analysis included the same effects as model (2) except for the year-by-month of record effect and functions describing the lactation curve. Cow (including pedigree relationships) and between lactation permanent environment were fitted as random effects. A maximum of five traits were analysed each time, because convergence problems arose with a higher number of traits. Each analysis considered lactation milk yield, two body energy and two fertility traits. Random effect solutions were used to calculate covariance components and genetic correlations between traits. When repeat analyses yielded multiple estimates for the same pair of traits, an average correlation was computed as the final result.
All statistical analyses described above were conducted using the software package ASREML (Gilmour et al., Reference Gilmour, Gogel, Cullis, Welham and Thompson2002).
Results
Calculation of phenotypic values
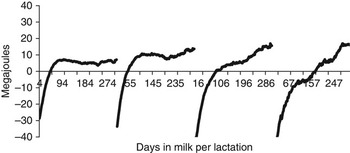
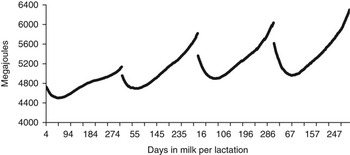
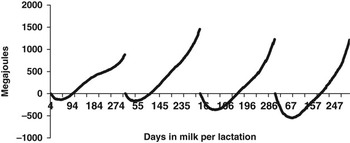
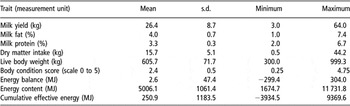
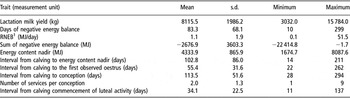
Figures 1, 2 and 3 illustrate the average energy balance, energy content and CEE, respectively, calculated throughout lactation for the four lactations of cows with data. Although based on somewhat newer equations, energy balance curves (Figure 1) were very similar to those presented by Coffey et al. (Reference Coffey, Emmans and Brotherstone2001), and clearly demonstrate the negative energy balance of a cow at the onset of lactation. Profile of energy content (Figure 2) and CEE (Figure 3) was consistent with Banos et al. (Reference Banos, Coffey, Wall and Brotherstone2006). Curves obtained for BCS (not shown) were very similar to those reported in the literature (e.g. Coffey et al., Reference Coffey, Emmans and Brotherstone2001; Hüttmann et al., Reference Hüttmann, Stamer, Junge, Thaller and Kalm2009). A description of all longitudinal traits considered in this study is given in Table 1. Trait statistics shown in Table 1 pertain to daily phenotypic values calculated with model (1) and are pooled estimates of four lactations.
Energy balance curves per lactation across four lactations.

Energy content curves per lactation across four lactations.

Cumulative effective energy curves per lactation across four lactations.

Summary of daily records of traits measured throughout lactation, derived from random regression models

Table 2 summarises traits measured once per lactation. Similar to the longitudinal traits, these statistics are pooled estimates across four lactations of the cow data.
Summary of traits measured once per cow per lactation

1Rate of recovery of energy balance during the post partum period of negative energy balance.
Genetic parameters
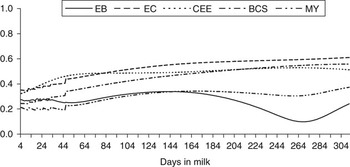
Daily heritability estimates of the four longitudinal body energy traits (energy balance, energy content, CEE and BCS) and milk yield are shown in Figure 4. These are overall heritability estimates pooled across four lactations. Estimate ranges were 0.10 to 0.34, 0.35 to 0.61, 0.32 to 0.53, 0.24 to 0.56 and 0.19 to 0.37 for energy balance, energy content, CEE, BCS and milk yield, respectively, and, for most traits, were lower in early lactation, tended to increase towards the middle of lactation and remain relatively constant thereafter. For energy balance, however, the initial slight increase of heritability was followed by a decrease towards the late stages of lactation. All estimates were statistically different from 0 (P < 0.05).
Heritability estimates of daily energy balance (EB), energy content (EC), cumulative effective energy (CEE), body condition score (BCS) and milk yield (MY) by day of lactation; standard errors ranged from 0.02 to 0.06, and all estimates were statistically greater than zero (P < 0.05).

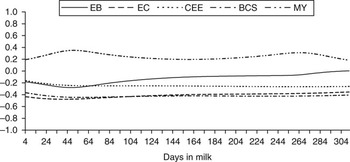
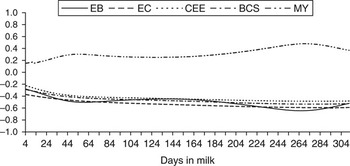
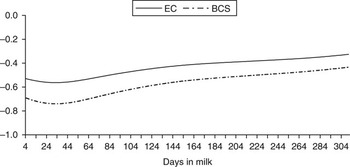
Genetic correlation estimates of longitudinal body energy traits and milk yield with fertility traits are shown in Figures 5 to 7. Correlation estimates pertain to each day of lactation and are pooled across four lactations. Figure 5 illustrates the genetic correlation profile of body energy with DH, Figure 6 with DC and Figure 7 with DLA as manifested by the changes in milk progesterone levels.
Genetic correlation between interval from calving to the first observed oestrus and daily energy balance (EB), energy content (EC), cumulative effective energy (CEE), body condition score (BCS) and milk yield (MY) by day of lactation; standard errors ranged from 0.08 to 0.19 and all estimates, except for EB after day 105, were statistically different from zero (P < 0.05).

Genetic correlation between interval from calving to conception and daily energy balance (EB), energy content (EC), cumulative effective energy (CEE), body condition score (BCS) and milk yield (MY) by day of lactation; standard errors ranged from 0.09 to 0.17, and all estimates were statistically different from zero (P < 0.05).

Genetic correlation of interval from calving to commencement of luteal activity with daily energy content (EC) and body condition score (BCS) by day of lactation; standard errors ranged from 0.23 to 0.26, and estimates were statistically different from zero (P < 0.05) in the first 107 and 222 days, respectively.

Only traits with statistically significant results (P < 0.05) were included in Figures 5 to 7. Thus, all five longitudinal traits had significant correlations with DH (Figure 5). For energy balance, this was true only for the first 105 days of lactation, whereas for the other traits, all daily estimates were significant. Significant estimates ranged from −0.16 to −0.28, −0.35 to −0.48, −0.16 to −0.26, −0.37 to −0.44 and 0.19 to 0.34 for energy balance, energy content, CEE, BCS and milk yield, respectively.
Similarly, all five longitudinal traits had significant (P < 0.05) correlation estimates with DC (Figure 6) ranging from −0.28 to −0.64, −0.37 to −0.60, −0.30 to −0.48, −0.29 to −0.53 and 0.18 to 0.39 for energy balance, energy content, CEE, BCS and milk yield, respectively.
Significant (P < 0.05) correlations with DLA were found only for the first 107 days of energy content and the first 222 days of BCS (Figure 7); significant estimates ranged from −0.47 to −0.56 and −0.50 to −0.74, respectively. Genetic correlations were also negative for the other two body energy traits (energy balance and CEE) and positive for milk yield, but these estimates did not attain statistical significance (P > 0.05).
Genetic correlations between longitudinal body energy traits or milk yield and number of services per conception were statistically not different from 0 (P > 0.05) throughout lactation but were consistently negative for all body energy traits.
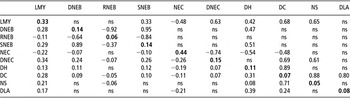
Genetic parameters of traits measured once per lactation are shown in Table 3. These were results from a series of five-variate analyses, and, for multiple estimates of the same parameter, an average was calculated. It should be noted that repeated estimates were very robust. For example, there were 12 estimates of the genetic correlation between NEC and DH ranging from −0.52 to −0.55 with an average of −0.54 shown in Table 3.
Genetic parameters of traits measured once per lactation; heritability estimates on, genetic correlations above and phenotypic correlations below the diagonal; estimates were significant (P < 0.05) unless otherwise statedFootnote 1

LMY = lactation milk yield; DNEB = days of negative energy balance; RNEB = rate of recovery of energy balance during the post partum period of negative energy balance; SNEB = sum of negative energy balance; NEC = nadir of energy content; DNEC = days from calving to NEC; DH = interval from calving to the first observed oestrus; DC = interval from calving to conception, NS = number of services per conception; DLA = interval from calving to commencement of luteal activity.
1 ns = not statistically different from zero (P > 0.05).
Bold values indicate heritability estimates.
Significance levels are described in the Table.
Relative correlated response to selection
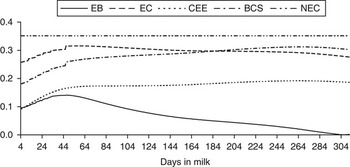
In order to evaluate the usefulness of the various body energy traits as potential genetic predictors of fertility, the relative correlated response in the latter to selection for the former was calculated. According to the selection index theory, correlated response in fertility would be the product of selection intensity in the predictor trait (body energy), the square root of heritability of the predictor, the genetic correlation between fertility and body energy and the standard deviation of fertility. Holding selection intensity and standard deviation of fertility constant, the two parameters that vary are heritability of body energy and its genetic correlation with fertility. The product of these two parameters would determine the relative correlated response in a particular fertility trait following selection of the same intensity for the various body energy traits.
Figure 8 shows the product of the square root of heritability of the four longitudinal body energy traits (energy balance, energy content, CEE and BCS) and the absolute value of their genetic correlation with DH, plotted across lactation. Figure 8 essentially combines results from Figures 4 and 5. The product of the square root of heritability of the energy content nadir and the absolute value of its genetic correlation with DH was included for comparison. In fact, the latter had the highest value suggesting that selection on nadir of energy content (NEC) would be more efficient than any longitudinal trait at improving the post partum interval until a cow exhibits her first oestrus.
Product of the square root of the heritability of daily energy balance (EB), daily energy content (EC), daily cumulative effective energy (CEE), daily body condition score (BCS) and nadir EC (NEC) with the absolute value of their genetic correlation with interval from calving to the first observed oestrus.

The same statistics were calculated for the other fertility traits (results not shown). Interval from calving to conception was best predicted by mid- to late-lactation (post-day 150) energy content. Early lactation (days 46 to 56) BCS was the best predictor of DLA.
Discussion
This study set out to investigate the genetic relationship between body energy and fertility. The former was defined by four longitudinal traits, describing direct and indirect measures of body energy throughout lactation, and five additional traits measured once per lactation, associated with certain key features of the body energy profile. Fertility was defined as the capacity of a cow to resume cycling post partum (intervals from calving to commencement of luteal activity and the first observed oestrus) and conceive (interval from calving to conception and number of services per conception).
Body energy profile
Of the four longitudinal body energy traits, energy balance was directly associated with the amount of energy taken in by a cow and the amount of energy expended to cover milk production, maintenance and activity needs. Examination of the lactation curves of this trait revealed that cows started lactation in negative energy balance (Figure 1), probably as a result of parturition stress combined with reduced feed and, therefore, energy intake by the animal in the early stages of lactation. The latter was corroborated by an examination of the average daily dry matter intake, which was 13.8 kg during the first week of lactation before gradually increasing to a maximum of 17.2 kg during peak milk production. Corresponding mean values for daily milk yield were 29.4 and 32.0 kg. Thus, during the first week of lactation, cows consumed only about 80% of their maximum dry matter intake despite already producing 92% of their peak daily yield.
Energy balance increased as lactation progressed and then levelled off, similarly to previous reports by de Vries and Veerkamp (Reference de Vries and Veerkamp2000), Coffey et al. (Reference Coffey, Emmans and Brotherstone2001) and Hüttmann et al. (Reference Hüttmann, Stamer, Junge, Thaller and Kalm2009). In each one of these studies, energy balance was defined differently, but conceptually related to the difference between energy taken in and used by the cow on a daily basis. In this study, the same energy balance profile was observed in the first and second lactations, but the levelling off was not quite as pronounced in the third and fourth lactations (Figure 1). Possibly, early sexually maturing Holsteins enter the reproductive process at a young age but keep growing in the first two lactations, and these growth requirements negatively affect energy balance. In later lactations, growth has been completed meaning that cows do not need to expend more energy to cover this function.
In this study, the period of negative energy balance was approximately 83 days. During this period, cows gradually recovered lost energy at a rate of 1.1 MJ/day (Table 2). This rate of recovery is very similar to that reported by Reist et al. (Reference Reist, Erdin, von Euw, Tschümperlin, Leuenberger, Hammon, Morel, Philipona, Zbinden, Künzi and Blum2003) in an experimental study, although the period of negative energy balance in their case was somewhat shorter (69 days). Admittedly, the definition of energy balance was similar, but not exactly the same in the two studies.
Two other body energy traits studied here (energy content and CEE) reflect the level and change of predicted body lipid and protein. Both traits followed a nearly inverted milk lactation curve (Figures 2 and 3), indicative of the connection between high milk production and mobilisation of body reserves. Their trajectories were also very similar to BCS curves observed here and in previous studies (e.g. Coffey et al., Reference Coffey, Emmans and Brotherstone2001; Hüttmann et al., Reference Hüttmann, Stamer, Junge, Thaller and Kalm2009). Conceptually, these traits can be viewed as indirect measures of body energy because they do not explicitly consider the amounts of energy taken in from feeding and spent by the animals to cover their biological functions. However, these traits have the advantage of being possible to monitor in commercial farms. Energy content and CEE are based on BCS, which is frequently recorded at the time of cow classification, and live weight, which can be predicted from routinely recorded linear conformation traits (Koenen and Groen, Reference Koenen and Groen1998; Coffey et al., Reference Coffey, Simm, Hill and Brotherstone2003). On the other hand, monitoring direct energy balance would require performance testing of selection candidates, since recording individual feed intake is not feasible in field conditions (Persaud et al., Reference Persaud, Simm and Hill1991).
Among body energy traits measured throughout lactation, energy content had the highest heritability, followed by CEE and BCS. The first two have not been studied before except by Banos et al. (Reference Banos, Coffey, Wall and Brotherstone2006) using the same data. Consequently, results obtained here were very similar to that study. BCS has been extensively studied and heritability estimates obtained here are similar to those previously reported in experimental herd studies (e.g. Hüttmann et al., Reference Hüttmann, Stamer, Junge, Thaller and Kalm2009), but a little higher than estimates based on commercial farm data (e.g. Berry et al., Reference Berry, Buckley, Dillon, Evans, Rath and Veerkamp2002). This is expected because animals in experimental farms are raised under a controlled environment that decreases the amount of residual variance.
Compared to the indirect body energy traits (energy content, CEE and BCS), heritability estimates for energy balance were disappointingly low and tended to decrease further in later stages for lactation. Hüttmann et al. (Reference Hüttmann, Stamer, Junge, Thaller and Kalm2009) reported the same trend for a similar trait that also reflected the difference between energy intake and expenditure. A closer inspection of our results revealed a reduction of the genetic variance for this trait at later stages of lactation. Further analysis of dry matter intake, on which energy balance calculations were largely based, showed a similar trend. This observation cannot be promptly interpreted from a biological standpoint. In order to investigate the potential impact of the fitted function (cubic spline) on the result, a separate analysis took place with orthogonal polynomials replacing splines in model (2). The analysis was conducted separately for each longitudinal body energy trait. Third- to fifth-order polynomials were fitted to model the random genetic and permanent environment components, but still heritability of energy balance decreased in later stages of lactation and remained lower than estimates for energy content, CEE and BCS.
Correlation between body energy and onset of cyclical activity
Fertility traits associated with a cow’s capacity to resume cycling post partum (intervals from calving to commencement of luteal activity and the first observed oestrus) had significant negative genetic correlation with body energy traits measured throughout lactation, suggesting that high levels of body condition and energy are genetically associated with faster onset of reproductive activity. The highest absolute correlation estimates were observed for early stage (25 to 50 days) BCS and energy content, although estimates were relatively stable across lactation for the two traits. Interestingly, these are two of the indirect body energy traits. Highest estimates for DH were −0.44 and −0.48 with BCS and energy content, respectively, and for DLA −0.74 with BCS and −0.56 with energy content. Results are comparable to the genetic correlation of −0.84 between DLA and single-observation BCS calculated by Royal et al. (Reference Royal, Pryce, Woolliams and Flint2002) and the estimate of −0.37 between average BCS and days to first service, which is related to DH, reported by Berry et al. (Reference Berry, Buckley, Dillon, Evans, Rath and Veerkamp2003a). De Haas et al. (Reference De Haas, Janss and Kadarmideen2007) also reported similar genetic correlation estimates between BCS and days to the first service ranging from −0.14 to −0.45 throughout lactation, with highest absolute values being observed in the first 100 days. No previous genetic correlations of energy content with DH or DLA were found in the literature.
A strong genetic association of DH was revealed with NEC, which describes the lowest level of energy content during the course of a lactation. The correlation estimate of −0.54 between the two traits suggests that nearly 30% of the genetic variation in DH is due to variation in NEC.
Genetic correlations between a direct body energy measure (energy balance) and DH were low, ranging from −0.16 to −0.28. However, two traits related to energy balance, namely duration and sum of negative energy balance, showed high genetic correlations with DH of 0.47 and 0.51, respectively. This indicates that cows with prolonged periods of negative energy balance or large amounts of cumulative negative energy balance were genetically associated with long intervals before exhibiting oestrus post partum. Genetic correlations of energy balance traits with DLA were negative, but not significantly different from zero (P > 0.05). Veerkamp et al. (Reference Veerkamp, Oldenbroek, van der Gaast and van der Werf2000) reported a genetic correlation of −0.60 between DLA and a body energy trait based on feed intake records that was somewhat similar but not quite the same to energy balance studied here. Small sampling size and differences in trait definition in the two studies may account for this discrepancy in results.
All results shown above pertain to average (pooled) estimates across four lactations. However, it may be argued that body energy and fertility are genetically different traits in younger and more mature cows. Therefore, an additional analysis of only primiparous cow data took place in order to investigate the genetic association between body energy and fertility in young, still-growing animals. In general, first lactation results (not shown) were not different from those discussed above. Genetic correlations between body energy and onset of cyclical activity were negative in all cases, and the pattern across lactation stages was similar to the analysis of all lactations. The strongest first lactation correlations for DH were −0.58 (days 20 to 37) with BCS and −0.63 (days 18 to 42) with energy content. The absolute values of these estimates were 0.05 to 0.18 higher than all lactation correlations. Standard errors of estimates, however, ranged from 0.08 to 0.19 rendering differences statistically not significant. On the other hand, the first lactation estimates were consistently higher, possibly suggesting a stronger genetic association between body energy and fertility in early than later life. Body energy in young animals is challenged by the growth requirement to a larger extent than in mature animals, implying a potentially bigger strain on cow physiological functions including fertility. Genetic correlations between the first lactation body energy and DLA were not significant (P > 0.05) probably due to the small number of primiparous cows with milk progesterone data.
Correlation between body energy and conception
Of the two fertility traits associated with a cow’s ability to conceive, only DC was found to be significantly (negatively) correlated with the four longitudinal body energy traits (energy balance, energy content, CEE and BCS), meaning that high levels of body condition and energy are genetically associated with better conception rates. Genetic correlations were rather similar with all four traits (Figure 6), the highest estimates being with energy balance (−0.64) and energy content (−0.60) at the end of lactation. The latter is consistent with the range of weekly correlations (−0.66 to −0.74) reported by Oikonomou et al. (Reference Oikonomou, Arsenos, Valergakis, Tsiaras, Zygoyiannis and Banos2008), despite their estimates being derived from a different methodology (genetic regression of DC on energy content) and pertaining to the first lactation cows. Genetic correlations between DC and BCS ranged from −0.30 to −0.53 in agreement with an average correlation of −0.46 reported by Veerkamp et al. (Reference Veerkamp, Koenen and de Jong2001) and an estimate of −0.30 between single-observation BCS and days open found in Dechow et al. (Reference Dechow, Rogers, Klei, Lawlor and VanRaden2004).
Interval from calving to conception was also genetically associated with NEC and DNEC (Table 3). Genetic correlations were −0.48 and 0.69, respectively, suggesting that cows that maintained their minimum energy content at a relatively high level (i.e. minimised energy content loss) and reached that minimum at a relatively short-time post partum were genetically associated with better conception rates than average cows.
Genetic correlations between the four longitudinal body energy traits and NS were negative (i.e. higher values of the former were associated with fewer NS), but were never statistically significant (P > 0.05). Berry et al. (Reference Berry, Buckley, Dillon, Evans, Rath and Veerkamp2003b) reported relatively low correlations between test-day BCS and NS ranging from −0.17 to −0.34. Here, estimates for these traits were in the same range, but did not attain statistical significance probably due to fewer cows being included in the present study. However, a significant (P < 0.05) genetic correlation of 0.61 was found between NS and DNEC, indicating that cows with long periods of energy content loss are genetically associated with more services needed for conception.
A separate analysis using only the first lactation data also took place. As was the case with the correlation between body energy and onset of cyclical activity discussed previously, the pattern of results across time trajectory (days of lactation) was similar to that from the analysis of all lactations, although actual absolute estimates were 0.05 to 0.14 higher.
Utility of results and practical implications
Nine body energy and four fertility traits were examined in this study. Four of the former were analysed as longitudinal traits with repeat (daily) observations throughout lactation. Consequently, several thousands of genetic parameters (heritabilities and genetic correlations) were calculated, but only the most notable are presented here.
The usefulness of these results can be assessed by the amount of additional information the genetic association between body energy and fertility may bring into the genetic characterisation of the latter. In general, body energy traits have a greater heritability than fertility traits, which means that they can be used to enhance the genetic evaluation and progress of the latter. Results of this study corroborate this suggestion. The UK fertility index already includes BCS data to this effect (Wall et al., Reference Wall, Brotherstone, Woolliams, Banos and Coffey2003).
The product of the square root of the heritability of a body energy trait and its genetic correlation with fertility was used to assess the relative success of improving the latter from selecting for the former. This product combines the two important genetic parameters into a single value indicative of the utility of a particular body energy trait, be it a daily observation or a trait measured once per lactation.
In this regard, fertility defined as the ability of a cow to resume cycling after parturition would stand to benefit most by selecting for improved energy content and/or BCS. Minimising energy content loss (i.e. maximising the lowest energy content value in lactation) or increasing daily energy content in early lactation (circa day 50) would be the best selection goal for shortening the interval from calving to the first observed oestrus (Figure 8). Increasing daily BCS or energy content circa day 50 of lactation would also result in minimising the interval from calving to commencement of luteal activity (results not shown but can be inferred from Figures 4 and 7).
Fertility defined as the interval from calving to conception would benefit most from selecting for increased BCS or energy content after mid-lactation. This is mainly due to slightly higher heritability of the body energy traits at later stages of lactation combined with the modest increases in their absolute genetic correlation with the fertility trait. It should be noted, however, that, compared with resumption of a cow’s cyclical activity, conception can be affected by more external factors including semen quality and artificial insemination practices. For this reason, fertility defined as the cow’s ability to restart cycling is probably a more useful trait than fertility related to conception.
Despite being a direct measure of body energy, selecting for improved energy balance based on individual cow feed intake is not supported by the results of this study. Because of the lower heritability and genetic correlation with fertility, the expected benefit would be smaller compared with selection for improved BCS and energy content.
Results of this study were based on cow data of the Holstein breed, which has been historically bred for high yield. It is difficult to determine whether such results would pertain to other dairy breeds without conducting appropriate experiments. Although all dairy cattle breeds have been selected, to varying degrees, for improved milk production, certain differences remain that could potentially affect the process of energy partitioning into yield, maintenance and reproduction (Walsh et al., Reference Walsh, Buckley, Pierce, Byrne, Patton and Dillon2008). Further research is required to confirm the validity of the present results and recommendations for breeds other than Holstein.
Conclusions
Easily attainable indirect body energy traits, namely BCS and energy content, have the strongest genetic association with a cow’s fertility. NEC and early lactation (circa day 50) BCS and energy content are the most useful traits for selection in terms of correlated improvement in a cow’s capacity to resume her reproductive activity post partum.
Given the utility of scoring body condition to improve fertility, scoring would best be undertaken nationally at the time of the second milk test and could be managed routinely by an appropriate farm service organisation. Parallel improvements in fertility trait recording would further enhance their genetic evaluation and progress.
Acknowledgements
This work was financed by a grant from the Scottish government. Data were contributed from the Langhill Dairy Cattle Research Centre, Scotland. Ross McGinn is acknowledged for maintaining the database and managing the process.
Appendix I
Three body energy traits were calculated based on daily phenotypic records for milk yield (MY, kg), fat percentage, protein percentage, dry matter (DM) intake (kg), live weight (LW, kg) and body condition score (BCS, scale 0 to 5), in addition to the following feed analysis measures: metabolisable energy content (MEC, MJ/kg DM), organic matter concentration (OM, kg/kg DM), in vitro organic matter digestibility (OMD, kg/kg DM) and crude protein (CP; kg/kg DM).
First, the cow gut fill (GF, kg) was calculated as follows (Coffey et al., Reference Coffey, Emmans and Brotherstone2001):

The conceptus weight (CW, kg) was computed next as follows (National Research Council, 2001):

where day = number of days in gestation; this formula assumes a birth weight of the calf equal to 40 kg.
Based on the above, the empty body weight (EBW, kg) was calculated as:

Daily body lipid (BL, kg) and protein (BP, kg) weights were then calculated as follows (National Research Council, 2001):

where BCS is expressed on a 1 to 9 scale; in our data, cows were scored on a 0 to 5 scale that was converted to [(BCS − 1) × 2 + 1] and then rescaled to 1 to 9.
The above steps were common to all three calculated body energy traits. Specific calculations pertaining to each trait separately are shown below.
Calculation of daily energy balance
The following formulae are described in Coffey et al. (Reference Coffey, Emmans and Brotherstone2001).
CP/kg OM (CPOM, kg):

MEC/kg OM (MECOM, MJ)

Digestible CP/kg OM (DCP, kg):

Effective energy (EE) content of feed/kg OM (EEC, MJ):

Organic matter intake per day (OMI, kg):

EE intake per day (EEI, MJ):

EE needed per day for milk production (EEP, MJ):

where lactose was set to 4.76% since no lactose information was available in the data.
EE needed per day for maintenance (EEM, MJ):

EE needed per day for activity (EEA, MJ):

Energy balance per day (EB, MJ):

This trait describes the daily balance of energy taken in by a cow through feeding and energy expended to cover requirements for milk production, maintenance and activity.
Calculation of daily energy content (EC)
Estimated BP and BL were combined to predict daily EC (MJ) using the following formula (National Research Council, 2001):

This trait describes the absolute level of body EC of a cow on a given day of lactation, without regard to levels on previous days.
Calculation of daily cumulative effective energy (CEE)
Changes in BL and BP during lactation were used to derive this trait based on the EE system proposed by Emmans (Reference Emmans1994). This system describes the amount of energy processed when BL and BP change. Accordingly, 56 MJ of energy are assumed to be needed for 1 kg of BL gain and 39.6 MJ of energy are yielded for 1 kg of BL loss. Corresponding figures of energy required or released for 1 kg of BP gain or loss are 50 and 13.5 MJ, respectively.
CEE was calculated based on the cumulative BL and BP change since the beginning of lactation. If BL1 and BP1 are BL and BP records, respectively, on the first test-day (onset of lactation), then on any subsequent day:

EE processed by these changes was calculated as follows (Emmans, Reference Emmans1994):

CEE (MJ) on each day of lactation was then calculated as follows:

This trait relates to total body energy as accumulates throughout lactation.