Introduction
Measures of performance form a basis for linking the activity of sensory neurons to perception or visuomotor behavior. At an intuitive level, it is clear that neurons must fire in ways that can be reliably decoded by downstream neurons to participate in the coding of a sensory variable. The limit to which these signals can be decoded, then, limits the ability of an animal to act on sensory information. Barlow formalized this intuition by hypothesizing that the most sensitive neuron would set the threshold for detecting changes in the sensory variable by the organism (Barlow, Reference Barlow1972). In the somatosensory system, the threshold for the detection of a sinusoidal stimulus of varying amplitudes is predicted by the sensitivity of different primary sensory neurons, suggesting that primary sensory neurons limit the perceptual abilities of animals (Mountcastle et al., Reference Mountcastle, Lamotte and Carli1972). The logical converse of this idea is that, for an animal to exhibit a given level of sensitivity to a stimulus, the sensitivity of a neural system must match that of the behavior. This hypothesis provides an important logical link between individual neurons and behavior. In order for a neural system to support the observed behavior, the neuron’s performance must be sufficient to match the performance we observe from the animal. If an individual neuron does not match the performance of the animal, then we are forced to conclude that the neuron’s representation is insufficient and must work in concert with other neurons to support behavior.
An intuitive starting point for the investigation of single sensory neurons is to examine their tuning properties. For example, V1 neurons typically are well-tuned for orientation (Hubel & Wiesel, Reference Hubel and Wiesel1962; Bishop et al., Reference Bishop, Coombs and Henry1973). The observation of a preference for a given value of the stimulus lends credence to the hypothesis that a neuron represents that stimulus. However, both neurons and animals respond in variable ways to the same stimulus (Tolhurst et al., Reference Tolhurst, Movshon and Dean1983; Bair & Koch, Reference Bair and Koch1996; Britten et al., Reference Britten, Newsome, Shadlen, Celebrini and Movshon1996), limiting the utility of the tuning function—by itself—in linking neurons to perception. We must consider if the neuron can signal the stimulus reliably enough to match the reliability in the behavior. That is, we wish to test the hypothesis that a downstream observer of the spiking response can determine the stimulus as well as the animal.
Early experiments comparing neural and behavioral performance focused on the ability to detect the presence or absence of a stimulus. These experiments found that single primary sensory neurons would fire more spikes when the stimulus was present than when the stimulus was absent (Barlow et al., Reference Barlow, Levick and Yoon1971; Mountcastle et al., Reference Mountcastle, Lamotte and Carli1972). However, the variability in the responses caused the distribution of spike counts with and without the stimuli present to overlap significantly, limiting the ability of the downstream observer to detect the presence of the stimulus from the spiking response of the neuron. Accounting for this variability, they established that the downstream observer of single neurons could detect the presence of the stimulus as well as a human performing the detection task. One of the key advances from this body of work was the idea that neurons and behavior can be compared based on their sensitivity to the presence of the stimulus. By taking account of the statistics of neuronal firing, it need not be an apples-to-oranges comparison and sufficiency can be directly tested.
While these detection experiments significantly advanced our understanding of the neural basis of categorical perceptual choices, animals often use their sensory systems in more complex tasks. Natural stimuli often change over time, and neural systems are likely designed to estimate the value of the stimulus in real time, rather than simply choose between specific predetermined values. For example, a monkey chasing a moving target must continuously estimate the position of the target relative to their direction of travel if they wish to acquire the target. Estimation problems like this are ubiquitous in animal behavior, which implies that neural systems have evolved to solve these types of problems. In this context, the sensitivity question of detection experiments must be recast into one of precision. That is, how precisely could a downstream observer decode the responses of the neuron (or group of neurons) in question to determine the stimulus value and is this precision sufficient to support the precision of the behavior?
In this article, we will review the process by which we can measure the precision of neural systems and behavior in estimation tasks using information theory. We first review the concept of information and relate this metric to the performance of a system at estimating the value of a stimulus. We discuss the Gaussian channel, an important model for information theory (Cover & Thomas, Reference Cover and Thomas1991), and how it can be applied to determine a lower bound on estimation performance. We develop a new method that uses stimulus reconstruction (Rieke et al., Reference Rieke, Warland, Van Steneninck and Bialek1997), combined with the Gaussian channel, to measure the estimation performance of neurons and behavior in a common reference frame. We then review some of the work measuring the mutual information between stimuli and neurons or behavior. Finally, we will show the application of information theoretic approaches in new work where a monkey was trained to chase a target by steering in a virtual world. Using the tools discussed, we measured the information transmitted by dorsal medial superior temporal (MSTd) neurons and behavior to determine if the encoding of a stimulus by individual neurons was sufficient to explain the performance of the monkey. The results suggest a previously unknown function of MSTd neurons in estimating the error signal, or the direction of the target relative to the direction of motion, during the steering task. Together, the experiments discussed provide a new and rigorous methodology for measuring the estimation performance of neuron and behavior on the same scale.
Measuring estimation performance using information theory
To determine if a given neuron or population of neurons encode a stimulus sufficiently to explain estimation behavior, the experimenter needs to determine what distribution of stimuli, s, correspond to a given response, r. This information is contained in the conditional distribution  $P\left( {s\left| r \right.} \right)$. When this distribution covers many possible stimuli, a downstream observer of the response cannot reliably decode the identity of the stimulus. Alternatively, when
 $P\left( {s\left| r \right.} \right)$ is confined to a small number of possible stimuli, the downstream observer can reliably determine the stimulus value. To quantify the spread of possible stimuli, given a response X, one can calculate the entropy of the conditional distribution as follows:
 $$H\left( {s\left| {r = X} \right.} \right) = - \sum\limits_s {P\left( {s\left| {r = X} \right.} \right)\log P\left( {s\left| {r = X} \right.} \right)} {\rm{.}}$$
This quantity describes the uncertainty in the stimulus value and is roughly equivalent to the inverse of the downstream observer’s precision in its estimate of the stimulus based on a response. However, this quantity is inadequate to determine estimation performance because it fails to consider the prior knowledge available to the downstream observer about the possible stimuli, P(s). To quantify what is learned by the observation of a response, one must measure how much uncertainly the observation eliminates. By comparing the entropy of the prior distribution to the conditional entropy above, one can measure the information transmitted by the response as follows:
 $$H\left( s \right) - H\left( {s\left| {r = X} \right.} \right) = - \sum\limits_s {\left( {P\left( s \right)\log P\left( s \right) - P\left( {s\left| {r = X} \right.} \right)\log P\left( {s\left| {r = X} \right.} \right)} \right)} {\rm{.}}$$
Finally, averaging across all the potential responses, we can quantify the average information transmitted about the stimulus by the system as follows:
 $$I\left( {s,r} \right) = - \sum\limits_s {P\left( s \right)\log P\left( s \right)} + \sum\limits_{s,r} {P\left( r \right)P\left( {s\left| r \right.} \right)\log P\left( {s\left| r \right.} \right)} {\rm{.}}$$
This measure is called the mutual information between the stimulus and response (Shannon & Weaver, Reference Shannon and Weaver1949). When calculated with a logarithm of base 2, the metric comes out as bits per transmission. To understand the significance of this metric, consider two examples. A 1-bit system can accurately assign the stimulus to one of 21 = 2 bins (left or right of center, e.g.). A 2-bit system, on the other hand, could accurately assign the stimulus to one of 22 = 4 bins (far left, left, right, or far right, e.g.). Therefore, as the information increases, the more precisely the system represents the stimulus. Numerous reasons exist for choosing information as a metric, but for the purpose of sufficiency, one particular feature is extremely useful: when the estimation performance of neurons and behavior are analyzed, the units are directly comparable.
In principle, we can measure the information transmission in estimation problems directly using eqn. (3) above. In practice, researchers rarely collect enough data to fill out probability distributions sampled finely enough to exceed the capacity of the system. Therefore, we must resort to models to measure the performance of the system. A useful model to consider for estimation problems is the Gaussian channel (Shannon & Weaver, Reference Shannon and Weaver1949; Cover & Thomas, Reference Cover and Thomas1991; Rieke et al., Reference Rieke, Warland, Van Steneninck and Bialek1997). The Gaussian channel describes an estimation problem in the form
 $$\hat s = s + n,$$
where the estimate of the stimulus,  $\hat s$, is corrupted by noise, n, taken from a zero-mean Gaussian distribution with variance
 $\sigma _n^2$. Therefore, the distribution of the actual stimuli, given an estimate,
 $P{\rm{(}}s{\rm{|}}\hat s{\rm{)}}$, is a Gaussian of variance
 $\sigma _n^2$ centered on the estimated value. As in the direct measurement of information transmission in eqn. (3), however, the measurement of
 $\sigma _n^2$ alone is insufficient to measure the information transmitted. One also needs to consider the entropy of the prior distribution, which directly relates to the variance in the stimulus,
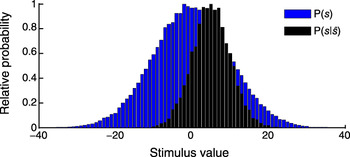
 $\sigma _s^2$. This point is illustrated in Fig. 1, which plots the prior distribution (blue bars) and the distribution of possible stimuli, given the estimate
 $\hat s = 5$ (black bars). In the figure, the variance of
 $P{\rm{(}}s{\rm{|}}\hat s{\rm{)}}$ is 25 stimulus units and the variance of P(s) is 100 stimulus units. Thus, when the estimate is 5, the stimulus was likely between −5 and 15 deg, whereas before observing any responses, the stimulus could be anywhere between −20 and 20 deg. The estimator reduced the range of stimuli by about 50%. This example makes it clear that the relative width of these distributions determines the performance of the estimator. Therefore, taking the ratio of the variance of the prior stimulus distribution to that of the noise provides a useful metric of estimation performance. We define this as the signal-to-noise ratio (SNR):
 $${\rm{SNR}} = {{\sigma _s^2} \over {\sigma _n^2}},$$
and the average information transmitted by the Gaussian channel is
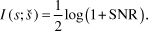 $$I\left( {s;\hat s} \right) = {1 \over 2}\log \left( {1 + {\rm{SNR}}} \right){\rm{.}}$$
Illustration of the Gaussian channel. The blue bins represent the prior stimulus distribution, in this case drawn from a Gaussian distribution. The black bins represent the distribution of stimuli, given we have estimated the stimulus value to be 5. This distribution is a Gaussian centered on the estimate. The width of this Gaussian then specifies how many stimuli correspond to our estimate from a single example of the neural or behavioral data. The rest of the stimuli from the prior distribution (such as those below −10 or above 20) can be ruled out.

Although noise properties of neural systems and behavior may not be strictly Gaussian, the mutual information between neural or behavioral responses and an input stimulus measured in this way provide a lower bound on the estimation performance of the system (Rieke et al., Reference Rieke, Warland, Van Steneninck and Bialek1997).
Most stimuli of interest to the behaving animal change over time, requiring estimation to be performed by the system in real time. Signals of biological relevance often show correlations over time, making the application of the above equations to each time step problematic. Converting the stimulus, estimate, and noise to the frequency domain, one can consider each frequency an independent channel due to the independence of the Fourier coefficients (Rieke et al., Reference Rieke, Warland, Van Steneninck and Bialek1997). The SNR can then be measured in the frequency domain as follows:
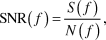 $${\rm{SNR}}\left( f \right) = {{S\left( f \right)} \over {N\left( f \right)}},$$
where S( f ) and N( f ) now represent the power in the stimulus and noise at a given frequency. The mutual information in bits per second is calculated by summing across frequencies as follows:
 $$I\left( {s;\hat s} \right) = {1 \over 2}\int_f {df\log \left( {1 + {\rm{SNR}}\left( f \right)} \right){\rm{.}}}$$
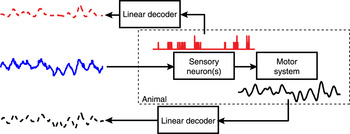
The equations above describe how to measure the estimation performance of the system, once one has derived a stimulus estimate from a response. Although several strategies exist for decoding the spike train to generate an estimate of the stimulus, the reconstruction method provides a straightforward method to test the sufficiency hypothesis for a task requiring real-time estimation. Fig. 2 outlines the strategy. After recording both the neural (red trace) and the behavioral responses (black trace) to any stimulus (blue trace), the experimenter can then decode both responses with a linear filter to derive an estimate of the stimulus (Rieke et al., Reference Rieke, Warland, Van Steneninck and Bialek1997). Comparing the quality of the reconstructions (dashed traces) allows the experimenter to determine the neuron’s estimation performance relative to the behavior. The neural and behavioral noise is calculated from the difference between the actual stimulus and the reconstructions, allowing the mutual information to be calculated using eqns. (7) and (8) above. To support the hypothesis of sufficiency, the mutual information between the neural response and the stimulus must equal or exceed the mutual information between the behavioral response and stimulus.
Reconstruction of stimuli from neurons and behavior. The animal (dotted rectangle) observes a stimulus (blue trace) and, through some encoding process, represents the stimuli as spikes (red histogram); since we sampled the train at 85 Hz, sometimes more than one spike can occur in a given interval. The height of the trace, therefore, indicates the number of spikes per time bin. The motor system then decodes this representation to produce the behavior (black trace). For the spiking activity of the recorded neuron to support the behavior, we must be able to guess the stimulus from the spikes at least as well as from the motor output of the animal. To test this, we can develop linear decoders of the spiking activity and the animal’s output to reconstruct the stimulus (dotted traces). The spiking responses are said to be a sufficient representation of the stimulus if the reconstruction is as good or better than the reconstruction of the stimuli from the behavior.

Estimation performance in neurons and behavior
Below, we review some of the results from experiments that measured estimation performance by neurons and behaving animals with the goal of demonstrating the methods used to quantify performance, advancements made possible by this quantification, and the attempts at determining the sufficiency of neural responses to support behavior. All of these experiments used the Gaussian channel to measure the mutual information between the neural or behavioral responses and the displayed stimulus.
Precision of manual control in humans
The application of information theory for understanding behavior that requires the estimation of sensory variables originated with Fitts’ fundamental work on the relationship between the amplitude, tolerance for error, and time to make a discrete movement with a stylus (Fitts, Reference Fitts1954). According to Fitts’ law, the time required for animals to make a movement is proportional to the logarithm of the ratio of the amplitude of the movement to the tolerance to error in the task. When viewing the amplitude of the movement as the signal power and the tolerance for error as the noise power, we see that Fitts’ law describes the limited rate of information processing (∼10 bits/s) by the human for determining the position of the target and implementing the correct action. An increase in the required precision or amplitude of a movement requires more information processing by the subject and, therefore, increased time to make a movement. In other discrete tasks, humans asked to make movements in one of many different possible directions demonstrate a spatial resolution of about 4 bits per movement (Georgopoulos & Massey, Reference Georgopoulos and Massey1988).
In manual tasks requiring the subject to act on continuously changing input, several authors used mutual information as a measure of estimation performance. Elkind and Sprague (Reference Elkind and Sprague1961) first characterized the rate of information transmission in closed-loop manual-control tasks. The task asked participants to track a moving target by manipulating the position of a stylus. The researchers found that a simple linear model described much of behavior, but a significant portion of the behavior was left unexplained (Elkind & Forgie, Reference Elkind and Forgie1959). Assuming the unexplained behavior corresponded to noise, they calculated the ratio of the controller output to the residual behavior to measure the SNR as a function of frequency. Summing over frequencies as in eqn. (8), they found a rate of information transmission limited to about 4 bits/s for band-limited white noise and up to about 5–7 bits/s for RC-filtered noise. In general, the spectra of the input and controller characteristics had strong influences on the rate of information transmission (Wempe & Baty, Reference Wempe and Baty1966, Reference Wempe and Baty1968; Baty, Reference Baty1969; Chan & Childress, Reference Chan and Childress1990). Overall, the complex interaction between stimulus, control design, and information transmission suggests that the control strategy used by humans trades off between performance, total output, and stability constraints on the system.
These experiments on various manual control tasks demonstrate that, not only can information transmission of a behaving animal be easily measured but also thinking about the behaving animal as an information-processing channel can reveal fundamental principles of the neurobiology. Further, these experiments set a lower bound on the rate of information processing by humans that a neural system must match or exceed if it is to underlie a given behavior. To date, however, no experiments directly test if a given neural system in the human is sufficient to match the estimation performance observed for behavior. The closest attempt compared human behavioral performance to a simulated population of 250 motor neurons recorded individually from the cortex of a monkey (Georgopoulos & Massey, Reference Georgopoulos and Massey1988). These experimenters found that the population of neurons exceeded the performance of the human in specifying the direction of a reaching movement. From this, we can infer that neurons in the motor cortex more than sufficiently code discrete arm movements and that the main bottleneck for reaching precision occurs in the apparatus downstream of the motor cortex. However, these simulations assume independence of the neural noise and fail to account for the dynamics of the behavioral or neural response, leaving open the question of whether or not these neurons sufficiently encode reaching movements in real time.
Performance of the H1 neuron
Bialek and colleagues were the first to attempt to quantify the ability of sensory neurons to signal a time-varying stimulus in real time (de Ruyter van Steveninick & Bialek, Reference de Ruyter van Steveninick and Bialek1988; Bialek et al., Reference Bialek, Rieke, De Ruyter Van Steveninick and Warland1991). They performed their experiments on the H1 neuron in the blowfly, Calliphora erythrocephala. This neuron is tuned to the horizontal velocity across large portions of the visual field (Hausen, Reference Hausen1982). As they recorded from H1, the experimenters displayed a random velocity stimulus to the fly. Using the reconstruction method discussed above, Bialek et al. (Reference Bialek, Rieke, De Ruyter Van Steveninick and Warland1991) determined the level of noise in estimates derived from the spiking response of H1. They found that the lower bound of the estimation performance of the H1 neuron reached information rates of 64 bits/s. At this level of precision, a downstream observer of the H1 neurons could detect movements smaller than the spacing between the ommatidia of the blowfly’s compound eye. Taking advantage of the large amounts of data one can collect in this preparation, de Ruyter van Steveninick and Bialek (Reference de Ruyter van Steveninick and Bialek1988) directly measured the distribution of stimulus waveforms, conditioned on different temporal spiking patterns, P(s|r). Modeling the conditional distributions as multidimensional Gaussians, they measured the covariance of the stimuli, given a certain spike train, to determine the noise in the system. When compared to the covariance of the prior distribution, this approach is analogous to measuring the SNR, as in eqn. (5) above. Using this approach, they found that H1 could transmit up to 87 bits/s across all the different spiking patterns of the H1 neuron. Since the fly responds to moving stimuli within 30 ms (Collett & Land, Reference Collett and Land1975), H1 transmits about 2.5 bits in a biologically relevant time frame.
The experiments of Bialek and colleagues show that the H1 neuron can transmit a surprising amount of information about the velocity of a horizontally moving stimulus. The finding that the performance of the neurons was near the physical limits imposed by the photoreceptors suggested that these neurons encode the stimulus in an optimal fashion. However, several other horizontal-motion-preferring neurons exist in the blowfly visual system that could improve the performance of the fly beyond the capabilities of the H1 neuron (Hausen, Reference Hausen1982). Further, the result that different patterns of spikes lead to different reconstruction qualities (de Ruyter van Steveninick & Bialek, Reference de Ruyter van Steveninick and Bialek1988) suggests that a nonlinear decoder of H1, sensitive to different patterns, could perform even better than strict linear decoding. Therefore, these experiments leave open the question of whether or not the H1 neuron matches the performance of the fly. The measurement of behavior was included in the related experiments of Rosner and Warzecha (Reference Rosner and Warzecha2011). They measured the SNR of two neurons that prefer vertical motion and support optical following head movements in the blowfly. They found that, when compared over short time scales (30 ms), fly head movements had a slightly higher SNR than the neurons. However, over longer time scales, the neuron performed much better than the motor behavior. This suggested the fly utilized several motion-sensitive neurons to improve behavioral performance beyond the capabilities of single neurons, at least over short time scales. It is provocative that we find related results in our analysis of MSTd and steering behavior in monkeys (below).
Performance in motion direction estimation
To date, the most rigorous experiments to attempt to test the sufficiency of single neurons to support behavior were performed by Osborne et al. (Reference Osborne, Bialek and Lisberger2004, Reference Osborne, Hohl, Bialek and Lisberger2007) on the smooth pursuit system. Smooth pursuit stabilizes the image of a moving object on the retina by moving the eye with the stimulus. To perform this task, the motor circuits must decode information about the direction of target motion from sensory neurons. Because of the extensive literature connecting the middle temporal (MT) area to both smooth pursuit and perception of motion (Dubner & Zeki, Reference Dubner and Zeki1971; Newsome et al., Reference Newsome, Wurtz, Dursteler and Mikami1985; Mikami et al., Reference Mikami, Newsome and Wurtz1986; Britten et al., Reference Britten, Shadlen, Newsome and Movshon1992; Giolli et al., Reference Giolli, Gregory, Suzuki, Blanks, Lui and Betelak2001), Osborne and colleagues investigated the sufficiency of individual MT neurons to support the observed precision in smooth pursuit behavior.
Earlier experiments demonstrate that MT neurons transmit information about the direction of a Gabor drifting in one of eight directions separated by 45 deg (Buracas et al., Reference Buracas, Zador, Deweese and Albright1998). Using a Poisson model of the spiking response, these experiments demonstrated that the information about the direction of the stimulus rises quickly for the first 100 ms, but levels off at just over 1 bit after 500 ms as the rate of information transmission goes to zero. Osborne et al. (Reference Osborne, Bialek and Lisberger2004) examined the spiking responses of MT neurons to a patch of dots moving in directions that were 7.5–15 deg apart. They, too, showed that the information rate was largest in 100 ms following the onset of stimulus motion which then dropped to nearly zero, confirming the results of Buracas et al. (Reference Buracas, Zador, Deweese and Albright1998). This pattern of information transmission results from the fact that the transient portion of the neural response transmits the most information about stimulus direction. In area MT, the rate of firing was low enough that only a few spikes occurred in this 100-ms window. In fact, on average, almost 50% of the total information about motion direction was transmitted by the first spike after the stimulus began to move (Osborne et al., Reference Osborne, Bialek and Lisberger2004). Interestingly, smooth pursuit latencies are approximately 100 ms, suggesting that MT neurons are optimized to transmit information on time scales relevant to smooth pursuit eye movements.
Following up on these experiments, Osborne et al. (Reference Osborne, Hohl, Bialek and Lisberger2007) measured the performance of smooth pursuit for motion direction. Monkeys were trained to pursue targets that move in many directions within 18 deg of each other at several different speeds. The experimenters then analyzed the variance in the behavior over time to assess the information transmitted by the monkey. They approximated the noise over time in the system as a multidimensional Gaussian and used this to quantify the SNR as a function of time. Using this method, the authors found that the monkey transmitted approximately 5 bits of information about the target direction in 200 ms. These experiments suggest that the rate of transmission by individual MT neurons is insufficient to support the observed behavior. Although the total amount of information about the movement direction was insufficient, the time course of information transmission was very similar, implying that multiple MT neurons are required to explain the observed behavior.
These results seem to conflict with the results of perceptual discrimination experiments, where individual MT neurons could often exceed behavioral sensitivity (Britten et al., Reference Britten, Shadlen, Newsome and Movshon1992). This conflict can be resolved by recalling that MT neurons are tuned to the direction of motion, resulting in the neuron transmitting more information for certain directions and less for others (Buracas et al., Reference Buracas, Zador, Deweese and Albright1998; Osborne et al., Reference Osborne, Bialek and Lisberger2004). These neurons clearly can perform very well when the animal only needs to decide between two directions, as supported by the fact that the average information transmitted by the best MT neurons peaked at just over 1 bit in the Osborne et al. (Reference Osborne, Bialek and Lisberger2004) experiments. For the more difficult task of estimating the target direction, averaging across all directions is doomed to fail unless we take into account neurons with different response properties. However, with an efficient coding strategy, as few as five MT neurons could support smooth pursuit.
There are several notable issues in the interpretation of the above experiments. First, none simultaneously measure the neural and behavioral activity. Osborne and colleagues recorded their neurons from an anesthetized monkey and Rosner and Warzecha recorded them from flies mounted to a microscope slide. Arguably, the neurons might perform better when the animal is alert and actively engaged in the task. Further, the methodology of measuring the information transfer differed for neuron and behavior for each of the experiments designed to ask the sufficiency question. This leads to questions about the parity of the comparison. Finally, the experiments of Georgopoulos and Massey (Reference Georgopoulos and Massey1988) and Rosner et al. (Reference Rosner and Warzecha2009) make several questionable assumptions to transform the neural data into a behavioral response. These issues led us to attempt to measure information transfer about a continuously varying stimulus in an awake behaving monkey actively performing a manual control task.
Estimation performance of MSTd neurons during steering
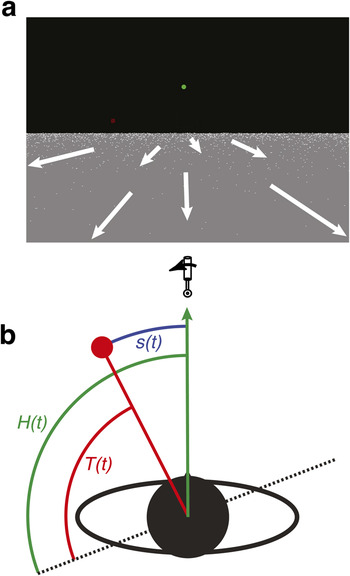
Animals evolved to move through the world to acquire the resources necessary to live and reproduce. When chasing a target, the animal must continuously estimate the target’s position relative to the animal’s direction of travel, which can be recovered from the complex pattern of visual motion that results from self-movements (Gibson, Reference Gibson1950). We call the difference between the target direction and current direction of travel the error (Fig. 3). The animal can then act on the error estimate to control its self-motion. To understand how sensory neurons participate in this complex behavior, we brought it into the lab by training monkeys to navigate through a virtual environment using a single-axis joystick. The virtual environment, which was displayed on a computer monitor, consisted of a distant target and a dotted ground plane (Fig. 3a). During a trial, the ground plane moved in such a way as to simulate motion at a velocity of 2.3 m/s at a height of 50 cm over the ground plane. The target moved through the world in a random trajectory, requiring the monkey to constantly estimate the error in real time and make appropriate joystick responses to receive rewards. Joystick responses turned the monkey in the virtual world, so that a left response resulted in a rotation to the left. The ground plane correctly simulates the turn of a monkey, resulting in motion by the dots on the ground plane to the right. Because this behavior resembles driving a car, we call it steering. Previous work by our lab demonstrates that the monkeys do learn to manipulate the joystick in response to an observed steering error to zero the error, but the system was subject to some noise (Egger et al., Reference Egger, Englehardt and Britten2010).
Illustration of the steering paradigm. (a) A single frame of the scene as observed by the monkey. The monkey was required to fixate the green dot (location of which was chosen to maximize the coverage of the screen by each MSTd neuron’s receptive field), as it attempted to steer toward the target (red dot) using a joystick. The dots on the ground plane moved in a manner that simulated the movement of the monkey at a constant velocity straight in front of the monkey (white arrows demonstrate this movement schematically). Steering movements by the monkey resulted in rotations in the virtual world, and the movement of the dots on the ground plane reflected this rotation. (b) Schematic of the steering task for the frame in figure (a). The target’s location (T(t)) was specified in world coordinates (dotted line) and took a random trajectory over time. We required the monkey to control its heading (H(t)), also specified in world coordinates, so that it matched the direction of the target within 3 deg to receive rewards. Therefore, the monkey observes the error signal (s(t)), which is the difference between the target and heading directions, and the steering responses of the monkey depend on the observed error over time (Egger et al., Reference Egger, Englehardt and Britten2010).

Neurons located in MSTd exhibit several properties that suggest that these neurons play a critical role supporting navigation behavior. First, MSTd neurons exhibit tuning to the patterns of motion, or optic flow, observed during self-motion (Tanaka et al., Reference Tanaka, Hikosaka, Saito, Yukie, Fukada and Iwai1986; Tanaka & Saito, Reference Tanaka and Saito1989; Duffy & Wurtz, Reference Duffy and Wurtz1991; Graziano et al., Reference Graziano, Andersen and Snowden1994). When monkeys are shown stimuli simulating different headings, individual MSTd neurons fire preferentially to a limited range of headings (Duffy & Wurtz, Reference Duffy and Wurtz1995; Bradley et al., Reference Bradley, Maxwell, Andersen, Banks and Shenoy1996; Gu et al., Reference Gu, Watkins, Angelaki and Deangelis2006; Bremmer et al., Reference Bremmer, Kubischik, Pekel, Hoffmann and Lappe2010; Maciokas & Britten, Reference Maciokas and Britten2010). When given vestibular input, these neurons also fire to a limited range of translation directions, although the tuning for visual and vestibular heading directions does not always agree (Gu et al., Reference Gu, Watkins, Angelaki and Deangelis2006). Further, individual MSTd neurons represent the heading direction at a level sufficient to support the perceptual performance of monkeys, and the responses of MSTd neurons correlate with perceptual decisions (Gu et al., Reference Gu, Angelaki and Deangelis2008). Finally, microstimulation of MSTd neurons biases heading perception (Britten & van Wezel, Reference Britten and van Wezel1998), and chemical lesions decrease behavioral sensitivity (Gu et al., Reference Gu, Deangelis and Angelaki2012). These observations demonstrate that MSTd neurons play an important role in processing optic flow.
Very few experiments have measured neural activity during active navigation. Field et al. (Reference Field, Wilkie and Wann2007) performed functional magnetic resonance imaging while humans navigated a virtual world using button presses to discretely turn right or left. They found strong activation of the parietal cortex including the homologue of MSTd in humans. Recording from individual MSTd neurons from monkeys using a joystick to control simulated heading direction reveals that the activity of MSTd neurons depends critically on the cues used to guide joystick movements (Page & Duffy, Reference Page and Duffy2008; Kishore et al., Reference Kishore, Hornick, Sato, Page and Duffy2011). However, these experiments do not measure either the tuning or precision of MSTd neurons to the visual stimuli, leaving open questions about what MSTd signals during steering and whether or not the responses of individual MSTd neurons are sufficient to support the navigation behavior. To test this, we recorded from single MSTd neurons with the goal of understanding the role those neurons play in active navigation behavior. What follows describes the results from 87 neurons in one macaque monkey.
Materials and methods
Animal and preparation
These experiments employed one adult female rhesus macaque (Macaca mulatta). The monkey was trained to manipulate the joystick to steer toward the target by operant conditioning techniques. For further details on training, see Egger et al. (Reference Egger, Englehardt and Britten2010). Prior to recording, we implanted the animal with a head restraint post, a scleral search coil to monitor eye position and a recording cylinder mounted over the occipital cortex. All surgeries were conducted with the approval of the UC Davis Animal Care and Use Committee and adhered to ILAR and USDA guidelines for the treatment of experimental animals. We localized MSTd neurons using both anatomical and physiological characteristics (Britten & van Wezel, Reference Britten and van Wezel2002). Single neurons were isolated and recorded with Epoxylite insulated tungsten microelectrodes (FHC) using standard techniques (Heuer & Britten, Reference Heuer and Britten2002). Once isolated, a neuron’s receptive field size, shape, and motion preferences were qualitatively measured with handheld moving bar stimuli and moving dot patches. Afterward, we performed the active steering and traditional tuning experiments.
Steering task
The monkeys sat in a darkened room directly in front of the center of the display monitor (Mitsubishi Diamond Pro 21, subtending 71 × 56 deg of visual angle). We displayed a simulated environment that consisted of a distant red target and a dotted ground plane under a dark sky (Fig. 3a). The target was a 0.25-deg-diameter red disk, just above the visual horizon. Dots on the ground plane moved to simulate the translation of the monkey across the ground plane at a constant velocity. Each trial began by displaying the fixation point alone on screen. After the monkey maintained fixation for 150 ms, the target and ground plane would appear but remain stationary. After 500 ms, the target would move to a new location 4 deg to the left or right, the ground plane would start to move, and steering could begin. For the rest of the 10-s trial, the monkey was required to continue fixating while steering to the target. The monkey used the single axis joystick to control the direction of movement across the ground plane; movements of the joystick resulted in a rotation over the ground plane. Taking an overhead view of the experiment, we can make a schematic of a single frame (Fig. 3b). In this example, the target (T) and the heading (H) directions do not agree (T and H are not equal). This results in the monkey observing a steering error (s) of T–H deg. In response to this error, the monkey makes an appropriate movement with the joystick (left in this example) and changes heading so that it is closer to the target and the steering error decreases (Egger et al., Reference Egger, Englehardt and Britten2010). The target moved in the world at a velocity chosen from a zero mean Gaussian with 0.1 deg/s standard deviation. Every 259–494 ms a new velocity was chosen from the same distribution, making the target randomly drift across the simulated world. Two additional manipulations also occurred. First, zero mean noise with 0.1, 0.9, or 1.8 deg standard deviation was added to the displayed location of the target every 94 ms. Additionally, the displayed heading across the ground plane was also corrupted by zero mean noise with 2.5 or 5.0 deg standard deviation, updated every 94 ms. The steering error was defined as the noisy target position minus the actual heading direction of the monkey. The monkeys were still rewarded according to the location of the target (without noise) relative to the heading (also without noise). For seven neurons, we did not add noise to either the displayed target position or the heading direction. In these experiments, the target’s position in world coordinates was changed every 94 ms, with the amplitude of the change in position taken from a Gaussian distribution with a 2.5 deg standard deviation. For more detailed methods, see Egger et al. (Reference Egger, Englehardt and Britten2010).
Data analysis
All analyses were performed in MATLAB (Mathworks, Inc., Natick, MA). To allow time for the monkey to begin accurate steering, we only analyzed data starting 1 s after the beginning of a trial. One and two-dimensional tuning curves measured during active steering required preprocessing of the neural response and stimuli. The stimuli were assigned to bins 2 deg(/s) in width. Spiking responses were counted over 11.8 ms bins (the duration of a stimulus frame) and then convolved with a Gaussian filter of 23.5 ms standard deviation. This approximated the firing rate of the neuron over time and the results agreed qualitatively with the peristimulus time histogram found by averaging the spike trains recorded during replay stimuli. To find the tuning curve, we found the distribution of responses 118 ms after every incidence of the stimulus that fell into a given bin. The mean of this distribution was taken as the value of the tuning curve for the stimulus at the center of each stimulus bin. Two-dimensional stimuli were measured as the mean of the spike rate conditioned on the joint occurrence of a given error and rotation velocity. To quantify the tuning of each neuron, we fit a multivariate regression model to the response, r:
 $$r = {b_0} + {b_{\dot H}}\dot H + {b_s}s + {b_i}\dot Hs{\rm{,}}$$
where  $\dot H$ is the displayed rotational velocity, s is the steering error and
 ${b_{\dot H}}$, b s, and b i are the gains for the rotational velocity, error, and interaction terms, respectively. b 0 captures the baseline firing rate of the neuron. To assess the significance of each parameter, we determined the probability that the fit parameter belonged to the null distribution of regression parameters. The null distribution was estimated from fits of the model to 1000 shuffles of the response, relative to the inputs for each neuron. The probability that each observed parameter belonged to the null distribution was calculated by its distance from the mean of the null distribution relative to the standard deviation of the null distribution.
Stimulus estimates were made from the raw spiking response of each neuron. The same procedure was used to measure the mutual information between the behavioral or neural response and the error. To estimate the stimulus, the kernel, k(τ), was taken as the weighted sum of a set of triangle basis functions, b i(τ).
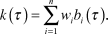 $$k\left( \tau \right) = \sum\limits_{i = 1}^n {{w_i}{b_i}\left( \tau \right)} {\rm{.}}$$
The centers of the 57 basis functions were spaced 35 ms apart, so the peaks were distributed evenly over 2.15 s, starting at 106 ms. Each basis function fell linearly from the peak to zero over 57 ms, so that the total width of the basis function was 114 ms. The stimulus was then estimated as follows:
 $$\hat s(t) = \int\limits_{ - \infty }^\infty {{\rm{d}}\tau k(\tau )\left( {r(t - \tau ) - b} \right)} {\rm{,}}$$
where  $\hat s(t)$ was the estimated stimulus, r(t) was the behavioral or neural response, τ was the time lag, and b was the baseline firing rate (Dayan & Abbott, Reference Dayan and Abbott2001). The decoding kernel was taken as the set of weights that minimized the sum of the square errors between the actual stimulus and the estimate. The power spectra of the stimulus estimate and noise were measured as the square of the magnitude of the components of a fast Fourier transform of the signals. Using the linear reconstruction approach, we found the quantity 1 + SNR( f ) using the following equation:
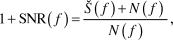 $$1 + {\rm{SNR}}\left( f \right) = {{\hat S\left( f \right) + N\left( f \right)} \over {N\left( f \right)}}{\rm{,}}$$
where  $\hat S\left( f \right)$ was the average power of the stimulus estimate and N( f ) was the average power of the noise; the noise was defined as the stimulus minus the estimated stimulus (Theunissen et al., Reference Theunissen, Roddey, Stufflebeam, Clague and Miller1996). The mutual information was calculated as the sum over frequency of the logarithm of 1 + SNR( f ), as in eqn. (8).
Other stimuli and analysis
For our replay experiments, we recorded the scene observed by the monkey during active steering for five trials for each neuron. We then replayed each trial to the monkey several times, with different trials interleaved and chosen pseudorandomly. Each trial began by asking the monkey to fixate for 150 ms, followed by the replay stimulus. We rewarded the monkey with increased frequency during each trial as long as it maintained fixation. Broken fixation resulted in the trial being terminated. For some trials, we allowed the monkey to continue manipulating the joystick as if steering, although the movements did not influence the scene viewed by the monkey. Neural responses during replay trials with and without joystick movements did not differ upon qualitative inspection of the raster plot.
Heading tuning was measured as previously described (Zhang et al., Reference Zhang, Heuer and Britten2004). Briefly, translational self-motion was simulated through a cloud of white dots on a black background with headings chosen from a uniform distribution between 30 deg left and 30 deg right of straight ahead. Each trial began with acquiring fixation. Upon fixation, the dot field appeared but remained static for 250 ms. This was followed by 1 s of simulated translation, during which the monkey was required to maintain fixation. The fixation location was chosen to maximize the coverage of the neuron’s receptive field by the monitor. To measure tuning, we counted spikes between 0 and 1 s relative to the start of motion.
Target position tuning was measured using a small red dot, similar to that used in the steering experiments. A 0.25-deg-radius red dot was used as the stimulus, and it was presented at seven locations between −15 and 15 deg at one of five velocities between −10 and 10 deg/s. Each trial began with fixation followed by three presentations of a psuedorandomly chosen position/velocity pair. Each presentation of the target was 500 ms long with a 500 ms interstimulus interval. The target position tuning curve of the neuron was measured as the average number of spikes between 40 and 540 ms relative to the target onset across all velocities.
Results
MSTd neurons reliably modulate their firing to steering stimuli
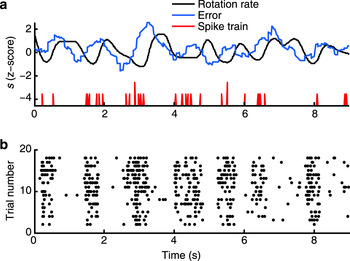
Simple inspection of the spiking responses of MSTd neurons recorded as the monkey performed the task indicated that MSTd neurons modulated their firing rate in a manner that appeared to be related to the stimulus value (Fig. 4a). To confirm that this modulation related to the stimulus the monkey saw, we recorded the scene observed by the monkey as it actively steered and replayed that scene to the monkey for seven of the neurons we recorded. We hypothesized that, if MSTd neurons represent stimuli important to steering, MSTd neurons would fire in reliable patterns to replays of the stimulus. Inspecting the raster plot for several repetitions of one stimulus for our example neuron, one clearly sees this neuron fired in similar patterns for each trial (Fig. 4b). All of the neurons we examined in this way exhibited similar results, demonstrating MSTd neurons reliably encode the dynamic stimuli present during steering.
MSTd neurons respond reliably to repeated presentation of steering stimuli. (a) Example trial stimuli (blue and black traces) and neural response (red trace) during active steering. The neuron clearly fires rapidly at some times while not firing much at other times. (b) Response of the same MSTd neuron to replays of the steering stimuli in figure (a). Each black spot represents a frame in which one or more spikes were fired. The timing of the spikes during passive viewing of the replayed stimulus matched the timing of spikes during active steering.

MSTd neurons exhibit tuning to rotation and error stimuli
The steering stimuli in our experiment contained several variables relevant to steering. These include translation and rotation components of optic flow, as well as the position and velocity of the steering target. The reliable firing of MSTd neurons may reflect any or all of these components. To further understand what stimuli MSTd neurons prefer, we measured the tuning curves of these neurons to different stimuli as the monkey actively steered. To measure the tuning curves, we binned the stimuli into 2 deg(/s) bins. Then, for every instance the stimulus fell into a given bin, we found the distribution of the neuron’s responses 118 ms later, to account for the visual latency of MSTd neurons (Kawano et al., Reference Kawano, Shidara, Watanabe and Yamane1994; Schmolesky et al., Reference Schmolesky, Wang, Hanes, Thompson, Leutgeb, Schall and Leventhal1998). Results were not critically dependent on the exact latency chosen due to temporal correlations in the stimuli. The mean of the response distribution for each stimulus bin was taken to be the tuning curve of the neuron to this stimulus. To help smooth the data, we filtered the spike train of the neuron with a Gaussian with a standard deviation of 24 ms. The width of the filter was motivated by the results of our replay experiments.
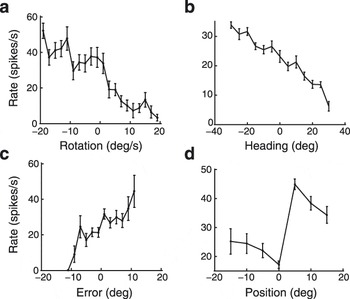
Fig. 5a plots the resulting tuning curve for rotational velocity for an example MSTd neuron. From this plot, we can see that this neuron preferred leftward rotations to rightward rotations. We also measured the heading tuning of this neuron more conventionally while the monkey was fixating (Fig. 5b). This captures the tuning to linear trajectories through a 3D cloud of dots. These curves are fairly similar; this is probably because both leftward rotations and left heading trajectories increase the amount of rightward image motion in the receptive field of the neuron. We also found that the neuron was tuned to the steering error during active steering (Fig. 5c). This was quite unexpected as the target was just a small dot (0.25 deg), whereas the receptive fields of MSTd neurons are quite large (Tanaka & Saito, Reference Tanaka and Saito1989). However, this result must be interpreted with caution because the monkey’s response to the target position means that the target position (error) is correlated with optic flow rotation some time later. Because the monkey’s behavior itself has considerable autocorrelation, we cannot conclude from this observation alone that the tuning to error is due to responses to the target. To dissociate these two potentially correlated stimuli, we also measured the target-position tuning of this neuron during passive viewing of the target alone. For this measurement, the target was flashed briefly at different locations along the horizontal locus of points that it occupied during steering. Reassuringly, we found similar tuning to that observed during active steering for this neuron (Fig. 5d), but few MSTd neurons tuned to the target position during active steering also exhibited such clear tuning to the target presented alone due to lack of responsiveness to this stimulus.
Example tuning of an MSTd neuron to steering stimuli. (a) Tuning to the rotation during steering. Negative rotation values represent left turns and positive values represent right turns. (b) Tuning to stimuli simulating heading through a dot cloud recorded during passive viewing of the stimuli. Headings left/right of center are represented by negative/positive values. (c) Tuning to the error during steering. Again, left/right errors are negative/positive. (d) Tuning to the position of a small moving target (averaged across all velocities) during passive viewing. Target positions left/right of center are represented by negative/positive values. Error bars on graphs (a–d) represent the standard error of the mean.

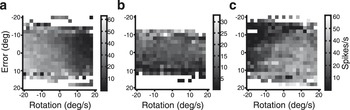
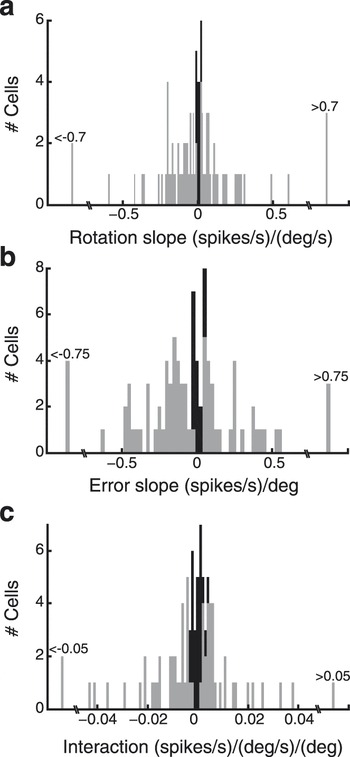
To further characterize the responses, we examined the joint tuning curve for rotation and the error during steering (Fig. 6). These surfaces plot the mean firing rate of the neuron as a function of both the rotation and error stimuli. The example neuron discussed in Fig. 5 exhibited complex tuning that was an inseparable function of both the rotation velocity and the error with the largest responses following the occurrence of a leftward rotation and rightward error (Fig. 6a). Other neurons in our data set gave variants of this pattern of response, ranging continuously from neurons that primarily represent target position (Fig. 6b) to those that primarily respond to the optic flow rotation. However, most of the neurons significantly modulated by the steering stimuli exhibit tuning to both stimuli (Fig. 6a and 6c). To quantify this responsiveness, we fit a regression model with terms for the rotation, error, and interaction between stimuli (see Materials and methods). Each panel in Fig. 7 plots a histogram of the sensitivity of the neurons to each stimulus and their interaction. Most neurons had significant gains for at least two of the regression terms, but the responsivity of the neurons to a given stimulus existed on a continuum from low to high. These results clearly show that MSTd neurons possess tuning functions that combine multiple components of the complex steering stimuli. This suggests that information about each stimulus is not separated into individual channels at the level of MSTd; instead information about both stimuli is multiplexed in the responses of the neurons.
Example of joint tuning to rotation and error for three different MSTd neurons. The grayscale level in each panel represents the relative rate of firing for three example MSTd neurons as a function of the rotation rate and steering error in the recent past. Pure white spaces indicate bins in which no data fell. Black represents a relatively low firing rate and gray/white pixels represent a high firing rate.

Distributions of regression parameters fit to the response of each neuron. (a) Gain parameter for rotation. (b) Gain parameter for error. (c) Gain parameter for the interaction between rotation and error. Gray bars represent parameters significantly different from the distribution of parameter fits predicted for a neuron without any sensitivity to the stimuli (Bonferroni corrected p-values less than 0.01).

Interpreting these joint tuning curves is challenging because of correlations in the stimuli, introduced by the monkey’s behavior. For example, the rotation of the ground plane under the monkey at one time correlates strongly with the rotation in nearby time points. When we take the average response at time t + dt, we cannot tell if those spikes resulted from the rotation at time t or the time briefly before or after that. For these reasons, one has to be extremely careful to properly decorrelate the stimulus with whitening approaches for any experiment that seeks to understand the encoding of the stimulus into a spiking response (Schwartz et al., Reference Schwartz, Pillow, Rust and Simoncelli2006). A simpler approach is to attempt to decode the spiking response and measure the information about the stimuli. In this approach, we do not worry about what exactly caused the spike; we only want to know if that spike tells us something about the identity of the stimulus. By quantifying the ability of a downstream observer to determine the stimulus from the spiking response, we can determine if these spikes are sufficient to support the monkey’s ability to estimate the stimulus.
Information rates of MSTd neurons
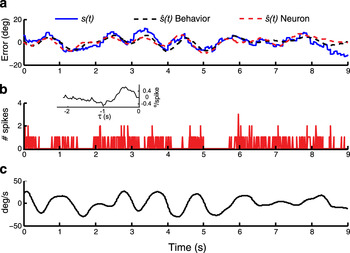
Because of these concerns about correlated stimulus components, we started by measuring the mutual information between the steering error and neural responses because we can compare neural results directly to the behavior. Using a set of triangle basis functions spaced evenly over different time lags, τ, we found the optimal decoder for each of the MSTd neurons we recorded (see Materials and methods). The results from an example neuron are shown in Fig. 8 (traditional tuning shown in Fig. 6c). Fig. 8a plots the error signal displayed to the monkey for several seconds from one trial of active steering (blue trace). Below, we plot the neural response (Fig. 8b) and the behavioral response (Fig. 8c) from the same trial. Using the optimal reconstruction filter fit to the data (Fig. 8b, inset), we decoded the spiking response of the neuron and derived an estimate of the stimulus (Fig. 8a, red dashed line). Clearly, we could reconstruct the error signal reasonably well from this neuron’s responses. In fact, the estimate derived from the spiking activity of this neuron appears to be approximately as accurate as the estimate derived from the monkey’s behavioral response (black dashed line).
Example error reconstruction performance by an MSTd neuron. (a) The error, error estimate from behavior, and error estimate from the spike train for one trial. (b) Spike train of the neuron during the trial in figure (a). The trace represents the spikes counted for each time bin (12 ms). Inset: optimal reconstruction filter for this neuron. τ represents the time lag of the kernel (see eqn. 10). (c) Monkey’s behavioral response during the trial in figure (a).

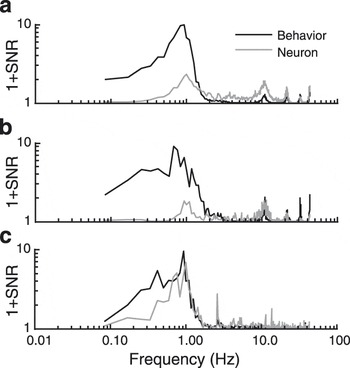
Inspection of these data shows both reconstructions to be visibly smoother than the input error signal. To quantify this impression, we measured the SNR of the neuron and behavior as a function of temporal frequency. Fig. 9 plots this quantity for three example neurons, including the example neuron from Fig. 8, and for the behavior on the same set of trials. The SNR of the behavior clearly peaked at low frequencies and rolls off quickly for frequencies over 1 Hz (black traces). At the lowest frequencies, the three example neurons had lower fidelity than the behavior (gray traces). Some neurons, like the example in Fig. 9a, had a SNR that exceeded that of the behavior but only at high frequencies, outside those relevant to the behavior. We suspect, however, that much of the difference is due to overfitting of the high frequency components by our reconstruction kernel. Between about 0.5 and 2.5 Hz, the SNR of these neurons exhibits some interesting characteristics. Although none matched the behavior, each exhibited an increase in SNR relative to the lower frequencies. Interestingly, the example neuron in Fig. 9c approximately matched the SNR of the behavior.
Reconstruction performance by frequency. Average 1 + SNR plotted as a function of frequency across all trials for both the behavior and three example neurons (a, b, and c). The example neuron from Fig. 8 is plotted in (c).

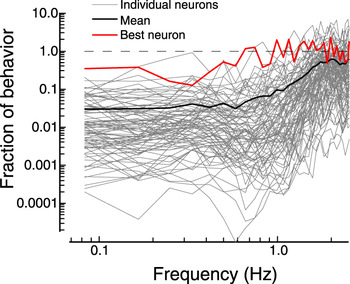
Although in a minority, several of the 87 MSTd neurons we recorded exhibited similar results. Some outperformed the behavior but rarely in the range of frequencies where behavioral SNR peaked. Fig. 10 plots the fraction of the behavioral performance each neuron reached as a function of frequency. Interestingly, MSTd neurons never matched the behavioral SNR for the lowest frequencies in our stimuli. This is probably a consequence of rapid neuronal adaptation (Lisberger & Movshon, Reference Lisberger and Movshon1999; Priebe et al., Reference Priebe, Churchland and Lisberger2002). However, as the stimulus frequency increased above about 0.3 Hz, some neurons begin to nearly match the SNR of the behavior (such as the neuron in Fig. 9c), with 4 reaching a fraction of 0.7 or more for at least one frequency between 0.3 and 1 Hz. As the stimulus frequency increased beyond 1 Hz, the behavioral performance began to drop off (Fig. 9), and many neurons matched or exceeded the behavior.
Fraction of the behavioral SNR reached by MSTd neurons. Each light gray trace plots the ratio or the neural SNR to the behavioral SNR as a function of the input frequency. The heavy black line plots the average fraction across all neurons. The heavy red trace plots the fraction for the most informative neuron. The horizontal dashed line demarcates a fraction of 1, the point at which neural performance matches the behavior.

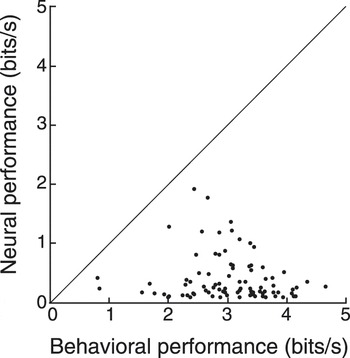
To summarize these results, we calculated the mutual information between the neural and behavioral responses and the error signal by summing over frequencies (see eqn. 8). To mitigate the effects of overfitting and focus on those frequencies clearly used by the monkey to perform the task, we chose a cutoff frequency of 2.49 Hz. Fig. 11 shows the results. From the graph, it is clear that no single MSTd neuron transmits enough information about low-frequency error signals to support the behavior. However, a few neurons come very close to matching the observed behavior. This result depended on the cutoff frequency, but increasing the cutoff frequency only improved the performance of the neurons relative to the behavior. Decreasing the cutoff frequency below 0.5 Hz resulted in a decrease in the relative performance of the neurons, reflecting the poor SNR of MSTd neurons for the low frequency components of the error stimulus (Fig. 10). Across the population, MSTd neurons transmitted the most information in the middle range of frequencies, but the poor SNR at low frequencies limited the performance of MSTd neurons below that of the behavior. The best neuron’s estimation performance only reached about 63% of the mean behavioral information rate, but nearly matched the behavior on the same trials. This discrepancy reflects the fact that, for some neurons, the sample of trials was more difficult than average due to random variation. Together, these results demonstrate that MSTd neurons transmit information about the ongoing steering error that a downstream observer could use to help guide the steering behavior.
Steering error information rates for neurons versus behavior for all MSTd neurons. Information rates were calculated from the measured SNR for each neuron and the behavior during the same trials as the monkey. We summed information up to a frequency cutoff of 2.49 deg/s. It was important to break out the behavior across the same trials as the neuron to ensure a fair comparison because the trial difficulty varies greatly due to the stochasticity of the target trajectory. Although the neurons fail to match the performance of the monkey, the best performing neuron transmitted information at over 63% the mean behavioral performance of the monkey (3.03 bits/s).

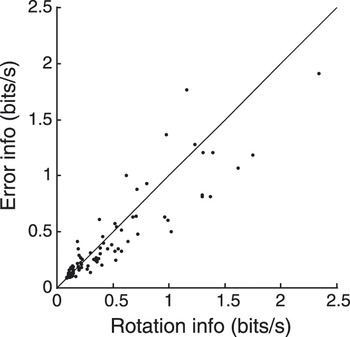
MSTd neurons are known for responding to large patterns of motion similar to the rotations that result from the monkey’s steering behavior. Since the rotations resulting from the monkey’s steering behavior correlate to the previous steering error (Egger et al., Reference Egger, Englehardt and Britten2010), the spikes of the neuron could represent only the rotation, and the information about the error might be epiphenomenal. Using information theory, we can test this hypothesis. To do this, we must make use of the fact that any information lost converting the error into a rotation stimulus cannot be regained by further processing of the spiking response representing the rotation only (Cover & Thomas, Reference Cover and Thomas1991). In the limit case, where rotation causes a change in spiking and rotations correlate perfectly with the error, the maximum information rate achievable for the error is the information rate found for rotation. Therefore, if any of these neurons transmit more information about the error stimulus than the rotation stimulus, we can reject the rotation only hypothesis. To test this, we calculated the mutual information between the rotation stimulus and the neural response and compared the performance of the neurons representing the rotation to that representing the error (Fig. 12). We found that, up to the cutoff frequency of 2.49 deg/s, 33 MSTd neurons transmit more information about the error than about the rotation stimulus. Interestingly, as we increase the cutoff frequency, all of the neurons transmit more information about the rotation than about the error. However, in the frequencies relevant to steering behavior, some MSTd neurons clearly performed better representing the error than the rotation.
Steering error information rates versus rotation information rates for all MSTd neurons.

Conclusions
These observations suggest a few intriguing conclusions. First, the fact that some neurons are approximately as reliable as the monkey suggests that a small population of MSTd neurons is sufficient to support real-time dynamic behavior such as steering. Although this has been suggested in the past for pursuit eye movements, ours is the most direct demonstration to date. Since we already knew that MSTd is involved in dichotomous perceptual motion discrimination (Celebrini & Newsome, Reference Celebrini and Newsome1994; Britten & van Wezel, Reference Britten and van Wezel1998), this finding further implies that the same cortical signals are being used for both perception and action. Our observations, however, do not support a simple readout rule for the guidance of steering. Specifically, the observation that the neuronal fidelity is much worse at lower temporal frequencies is reminiscent of Mountcastle’s observations in the somatosensory system (Mountcastle et al., Reference Mountcastle, Lamotte and Carli1972). No single population of skin mechanoreceptors could support perception at all temporal frequencies; one needed to recruit different afferents for different frequencies within the behavioral range. Our observations suggest that other neurons must be recruited to support the low-frequency end of monkey steering behavior.
Discussion
A central goal of sensory neurophysiology is to link the activity of neurons to sensorimotor behavior. As summarized by Teller (Reference Teller1984), several approaches to making this connection exist. Here, we reviewed the concept of sufficiency, which attempts to link neural responses to behavior by comparing neural and behavioral performance. The sufficiency experiment is related to the identity property introduced by Brindley (Reference Brindley1960), where identical physiological responses must result in the same perception. Instead of requiring the exact same physiological responses, however, we recognize the stochasticity of the system as a factor limiting perception or behavior. Therefore, different responses by the system could, in fact, result in the same perception because the downstream observer of those responses cannot statistically differentiate between candidate stimuli. For different perceptions to arise, the spiking response to each must not only differ but also differ reliably. Therefore, we need to measure the sensitivity, precision, or related measure of performance of both the behavior and the neurons of the system. Observing some level of performance in the behavior, we can conclude that, at some point in the sensorimotor system, a bottleneck exists that limits the animal to a given level of performance. Sufficiency experiments aim to test different stages of the system to identify the bottleneck.
At present, there are conflicting views of where this bottleneck occurs. Many experimenters assume motor planning and execution stages add a significant amount of noise to behavior (Schmidt et al, Reference Schmidt, Zelaznik, Hawkins, Frank and Quinn1979; Harris & Wolpert, Reference Harris and Wolpert1998; van Beers et al., Reference van Beers, Haggard and Wolpert2004; Churchland et al., Reference Churchland, Afshar and Shenoy2006). This is perhaps most apparent because of our ability to recognize the location of a target more quickly than we can reach or point to it. However, this intuition may be misleading, as we likely continue to process information about target location well into a reaching movement. Other research points to the idea that the sensory representation of the stimulus is the true bottleneck, and downstream motor systems act optimally on the information present (Levison et al., Reference Levison, Baron and Kleinman1969; Osborne et al., Reference Osborne, Lisberger and Bialek2005). Results from a combination of perceptual and oculomotor psychophysics suggest that both sensory and motor components contribute to the observed noise (Gegenfurtner et al., Reference Gegenfurtner, Xing, Scott and Hawken2003; Stone & Krauzlis, Reference Stone and Krauzlis2003; van Beers, Reference van Beers2007; Rasche & Gegenfurtner, Reference Rasche and Gegenfurtner2009), but these studies fail to compensate for the different time scales of information integration during the motor versus perceptual tasks. The results may depend on the complexity of the system under control. For a relatively simple mechanical system like the eye, movements are likely limited by the quality of the sensory representation. For complex systems like the arm, physical constraints and long conduction delays may limit the rate of information transmission or the maximum following frequency of the system. The tools discussed here are designed to help address these questions.
Information theoretic approaches have been applied to many different questions in neuroscience. A major application has been for studying encoding processes, where information is a natural representation of the precision of the code (Reinagel & Reid, Reference Reinagel and Reid2000; Sharpee et al., Reference Sharpee, Rust and Bialek2004; Chacron et al., Reference Chacron, Maler and Bastian2005; Butts et al., Reference Butts, Weng, Jin, Yeh, Lesica, Alonso and Stanley2007). These tools have also been extremely productive in assessing the ability of motor neurons to guide movements (Averbeck et al., Reference Averbeck, Crowe, Chafee and Georgopoulos2003; Mulliken et al., Reference Mulliken, Musallam and Andersen2008; Gilja et al., Reference Gilja, Nuyujukian, Chestek, Cunningham, Yu, Fan, Churchland, Kaufman, Kao, Ryu and Shenoy2012). Others have used it, as discussed above, to measure the performance of a neuron or populations of neurons representing a stimulus (Roddey & Jacobs, Reference Roddey and Jacobs1996; Theunissen et al., Reference Theunissen, Roddey, Stufflebeam, Clague and Miller1996; Wessel et al., Reference Wessel, Koch and Gabbiani1996; Clague et al., Reference Clague, Theunissen and Miller1997; de Ruyter van Steveninck et al., Reference de Ruyter van Steveninck, Lewen, Strong, Koberle and Bialek1997; Warland et al., Reference Warland, Reinagel and Meister1997; Warzecha & Egelhaaf, Reference Warzecha and Egelhaaf1997; Buracas et al., Reference Buracas, Zador, Deweese and Albright1998; Haag & Borst, Reference Haag and Borst1998) or behavioral performance (Sakitt et al., Reference Sakitt, Lestienne and Zeffiro1983; Georgopoulos & Massey, Reference Georgopoulos and Massey1988; Soechting & Flanders, Reference Soechting and Flanders1989; Massey et al., 1991a; Massey et al., 1991b). Despite this, only a few groups used information analyses to test the sufficiency of sensory neurons to support an observed behavior that relies on dynamic estimation over time (Osborne et al., Reference Osborne, Bialek and Lisberger2004, Reference Osborne, Hohl, Bialek and Lisberger2007; Rosner et al., Reference Rosner and Warzecha2009). No studies have used the reconstruction approach on both neurons and behavior to bring each response into a common reference frame. The main advance presented here is that we can use stimulus reconstruction and information theory on both neural and behavioral responses to compare the performance of a neuron or group of neurons to simultaneously measured behavioral performance on an equal footing.
To illustrate these ideas, we demonstrated its use on 87 MSTd neurons recorded from one monkey. We demonstrated that some MSTd neurons exhibit tuning to the error or location of a small target (Figs. 5–7). We further showed that the responses of these MSTd neurons could be decoded in real time to estimate the stimulus (Figs. 8–11). Although some MSTd neurons were surprisingly informative about the error, none matched the behavior of the monkey across the relevant range of frequencies. In particular, MSTd neurons poorly represented the lowest frequency stimuli. This demonstrates that although individual MSTd neurons are insufficient to support steering behavior, some clearly transmit close to enough information to support the behavior. This suggests a role of MSTd in representing the error during steering. Previous work demonstrated that MSTd likely plays a role in representing the instantaneous direction of travel from optic flow (Bradley et al., Reference Bradley, Maxwell, Andersen, Banks and Shenoy1996; Page & Duffy, Reference Page and Duffy1999; Britten & van Wezel, Reference Britten and van Wezel2002; Gu et al., Reference Gu, Angelaki and Deangelis2008), but its role in the guidance of active steering has been contested (Field et al., Reference Field, Wilkie and Wann2007). Here, we provide evidence that MSTd neurons can participate in coding information relevant to steering. However, our experiments cannot address if this information is passed on to the systems that control motor output. Preliminary results from our lab demonstrate, encouragingly, that microstimulation of MSTd neurons can influence steering behavior, suggesting that the motor systems use the output of MSTd neurons to guide behavior (Egger and Britten, unpublished results).
We also observed that, at frequencies relevant to steering behavior, some MSTd neurons transmit more information about the steering error than about the large motion stimulus caused by the monkey’s turning responses (Fig. 12). This observation demonstrates that some MSTd neurons do indeed represent the steering error, rather than exclusively the rotation speed. As the cutoff frequency is increased, however, all MSTd neurons transmit more information about the rotation than the steering error. The fact that some MSTd neurons signal steering error at low frequencies but rotations at higher frequencies opens up the possibility that MSTd neurons represent multiple stimuli simultaneously. Low frequency portions of the response could be used to represent the steering error, whereas the higher frequency components might represent the rotation. Although surprising, previous experiments show that MSTd neurons represent multiple stimuli (Kawano et al., Reference Kawano, Sasaki and Yamashita1984; Bremmer et al., Reference Bremmer, Ilg, Thiele, Distler and Hoffman1997; Duffy, Reference Duffy1998; Gu et al., Reference Gu, Watkins, Angelaki and Deangelis2006), suggesting that MSTd neurons represent multiple sensory values simultaneously.
Previous research points to a role of MSTd neurons in representing information about a small target. A subpopulation of neurons exhibit responses during smooth pursuit in the dark, suggesting that MSTd represents information about the target (Komatsu & Wurtz, 1988a). Most of these neurons exhibit complex response properties when engaging in pursuit on a lighted background (Komatsu & Wurtz, 1988b). Further, the presence of an object moving separately from an optic flow background modulates MSTd responses relative to optic flow alone (Sato et al., Reference Sato, Kishore, Page and Duffy2010). Combined with our results, these experiments indicate a role of MSTd in parsing the position of the target from the background optic flow. However, other interpretations are possible. MSTd is known to receive extraretinal inputs during smooth pursuit of a target (Newsome et al., Reference Newsome, Wurtz and Komatsu1988; Bradley et al., Reference Bradley, Maxwell, Andersen, Banks and Shenoy1996), suggesting that the target position tuning may result from efference copy from hand movements of the monkey that contribute to the steering error. However, MST neurons do not exhibit hand-related responses while performing a joystick task similar to the steering task investigated here (Eskandar & Assad, Reference Eskandar and Assad1999). Further, visual inspection of the responses of several MSTd neurons to replays of the stimulus and active steering did not reveal obvious differences, making it unlikely that efference copy from the hand accounts for the target selectivity we observed. However, given the predictability of the error stimulus, the results could reflect a prediction generated from an internal model of the target location. Although poorer than other visuomotor areas in the intraparietal sulcus, the responses of some MST neurons are significantly informative about the movement direction of a small target when it is briefly occluded, indicating a predictive role of MSTd neurons (Eskandar & Assad, Reference Eskandar and Assad1999). Since the low frequency components of the error signal were the most predictable, the lack of information about the low frequency error signals in MSTd further suggests that prediction is not the case; rather, MSTd neurons could signal deviations from an internal prediction. Further experiments are necessary to determine the mechanisms responsible for the ability of MSTd neurons to represent the steering error.
With these caveats in mind, our results nonetheless suggest a direct role of MSTd in representing the error stimulus while steering. Noting that our and other experiments suggest a mainly sensory role of MSTd neurons, it is interesting to hypothesize that the bottleneck in processing the steering error occurs in the sensory system. However, we caution that these results have only been observed in one monkey. Still, our results illustrate the utility in using information theoretic principles to measure performance in continuous tasks. Information theory provides a useful and rigorous methodology for determining the sufficiency of neural signals to support behavior. As in the case of perceptual experiments, sufficiency is only one piece of a complete linking hypothesis, and further experiments must address the causal role of these signals in behavior.
Acknowledgments
The authors would like to thank Mark Goldman for his helpful comments and discussion of the information theory tools. We also thank Dan Sperka for programing the stimulus and for his help with managing the experimental data. We thank Heidi Englehardt, Xochi Navarro, Alena Druhavets, and Angie Michaiel for lab support and animal training. This work was supported by the National Institute of Health (EY 10562) and the Marsden Fund. We also thank the Training Program in Basic Neuroscience (5T32MH082174) at U.C. Davis for its support of S.W.E.