

Introduction
Disputed empirical issues – ones that admit of investigation by scientific inquiry – occupy a conspicuous place in US political life. Does consumption of fossil fuels generate global warming? Can nuclear waste be safely stored in deep geologic depositories? Will vaccinating adolescent girls against the human papilloma virus – the dominant cause of cervical cancer – lull them into engaging in unprotected sex, thereby increasing their exposure to other sexually transmitted diseases? Does banning the possession of concealed weapons increase crime – or decrease it? Will aggressive public spending limit the duration and severity of an economic recession – or compound them? Intense and often rancorous conflict on these issues persists, despite the availability of compelling and widely accessible empirical evidence (Kahan, Reference Kahan2010).
Such conflict casts doubt on the prospects for enlightened self-government. Collective welfare demands empirically informed collective action. To be sure, decision-relevant science rarely generates a unique solution to any policy dispute: even after the basic facts have been established, what to do will involve judgments of value that will vary across citizens who hold competing understandings of the public good. But unless citizens and their representatives possess empirically sound understandings of the dangers they face and the likely effects of policies to abate them, they will not even be able to identify, much less secure enactment of, policies that advance their ends.
Regardless of their political outlooks, then, all democratic citizens have a stake in dispelling persistent public conflict over decision-relevant science. Satisfying this common interest itself demands empirical study aimed at enlarging knowledge of why citizens of diverse outlooks disagree not just about what to do, but also about what is known to science.
In this paper, we present the results of a study aimed at testing rival accounts of public controversy over decision-relevant science. We begin with a brief overview of these two positions. We then describe the study and report the results. Finally, we offer an assessment of what the findings imply for future study of political conflict over policy-relevant facts and practical steps to dispel it.
Polarization over decision-relevant science: two accounts
As is the case with most interesting social phenomena (Watts, Reference Watts2011), the number of plausible explanations for persistent public controversy over risks and other policy-relevant facts exceeds the number that can actually be true. We identify two of the possibilities.
The first one attributes such conflict to deficits in the public's capacity to comprehend scientific evidence. The public, on this account, has a weak understanding of science (Miller & Pardo, Reference Miller, Pardo, Dierkes and Grote2000). Ordinary citizens are thus liable to misunderstand what scientists are telling them and vulnerable to being misled by those trying to deceive them for private advantage (McCaffrey & Buhr, Reference McCaffrey and Buhr2008; Rosenau, Reference Rosenau2012).
The public's limited knowledge is aggravated by psychological dynamics. Popular risk perceptions, it is thought, tend to originate in a rapid, heuristic-driven form of information processing – what decision scientists refer to as ‘System 1’ reasoning (Stanovich & West, Reference Stanovich and West2000; Kahneman, Reference Kahneman2003). Over-reliance on System 1 heuristics is the root of myriad cognitive biases. By fixing attention on emotionally gripping instances of harm, or by inducing selective attention to evidence that confirms rather than disappoints moral predispositions, System 1 information processing induces members of the public variously to overestimate some risks and underestimate others relative to the best available evidence, the proper evaluation of which requires exercise of more deliberate and reflective ‘System 2’ forms of information processing (Loewenstein et al., Reference Loewenstein, Weber, Hsee and Welch2001; Sunstein, Reference Sunstein2003; Weber, Reference Weber2006; Marx et al., Reference Marx, Weber, Orlove, Leiserowitz, Krantz, Roncoli and Phillips2007; Weber & Stern, Reference Weber and Stern2011).
We will call this account the ‘science comprehension thesis’ (SCT). SCT is an extremely popular explanation for conflicts over climate change and various other disputed risks, particularly among commentators who construct secondary interpretive accounts by synthesizing diverse findings from decision science (Sunstein, Reference Sunstein2005, Reference Sunstein2006, Reference Sunstein2007).
We will call the second account of persistent controversy over policy-relevant facts the ‘identity-protective cognition thesis’ (ICT). ICT, in an important sense, stands SCT on its head. Whereas SCT attributes conflicts over decision-relevant science to deficits in science comprehension, ICT sees the public's otherwise intact capacity to comprehend decision-relevant science as disabled by cultural and political conflict.
Individuals, on this account, have a large stake – psychically as well as materially – in maintaining the status of, and their personal standing in, affinity groups whose members are bound by their commitment to shared moral understandings. If opposing positions on a policy-relevant fact (e.g. whether human activity is generating dangerous global warming) come to be seen as symbols of membership in and loyalty to competing groups of this kind, individuals can be expected to display a strong tendency to conform their understanding of whatever evidence they encounter to the position that prevails in theirs (Kahan et al., Reference Kahan, Jenkins-Smith and Braman2011; McCright & Dunlap, Reference McCright and Dunlap2013). Being a form of motivated reasoning (Kunda, Reference Kunda1990), identity-protective cognition can be viewed as a psychic self-defense mechanism that steers individuals away from beliefs that could alienate them from others on whose support they depend in myriad domains of everyday life (Giner-Sorolla & Chaiken, Reference Giner-Sorolla and Chaiken1997; Sherman & Cohen, Reference Sherman and Cohen2006).
The conditions that trigger this sort of response are rare. Very few facts amenable to empirical investigation ever become symbols of group identity. The US public is not polarized over the utility of antibiotics in treating bacterial infections, the health risk of cell phone radiation, the efficiencies associated with governmental provision of public safety services such as fire and police protection, the disadvantages of relying on a system of bartering or privately guaranteed commercial paper rather than a common currency issued by and guaranteed by the government, etc. In the absence of divisive cultural conflict, citizens of all levels of science comprehension generally form positions that are consistent with the best available evidence. Moreover, there is every reason to believe in such circumstances that those who enjoy higher than average capacities for science comprehension use those capacities to make even better science-informed decisions.
But when a policy-relevant fact does become suffused with culturally divisive meanings, the pressure to form group-congruent beliefs will often dominate whatever incentives individuals have to ‘get the right answer’ from an empirical standpoint. On matters like climate change, nuclear waste disposal, the financing of economic stimulus programs, and the like, an ordinary citizen pays no price for forming a perception of fact that is contrary to the best available empirical evidence: that individual's personal beliefs and related actions – as consumer, voter, or public discussant – are too inconsequential to affect the level of risk that person or anyone else faces or the outcome of any public policy debate. However, if that person gets the ‘wrong answer’ in relation to the one that is expected of members of his or her affinity group, the impact could be devastating: loss of trust among peers, stigmatization within his community, and even loss of economic opportunities (Kahan, Reference Kahan2012).
Thus, at one level – a very individualistic one – it will make perfect sense in this situation for individuals to attend to information, including evidence of what is known to science, that promotes the formation of identity-congruent beliefs. Again, even citizens of modest science literacy and critical reasoning skills will likely be able to form such beliefs without difficulty, because figuring out what view prevails among those with whom one shares one's most important connections depends on a basic kind of cultural competence, not on an understanding of or a facility with empirical evidence. But those citizens who enjoy above-average science comprehension will not face any less incentive to form such beliefs; indeed, they will face pressure to use their intelligence and reasoning skills to find evidentiary support for identity-congruent beliefs the comprehension of which would likely exceed the capacity of most of their peers (Kahan et al., Reference Kahan, Peters, Wittlin, Slovic, Ouellette, Braman and Mandel2012).
At a collective level, of course, this style of engaging decision-relevant science can be disastrous. If all individuals follow it at the same time, it will impede a democratic society from converging – or at least converging as quickly as it otherwise would – on understandings of facts consistent with the best available evidence on matters that affect their common welfare. This outcome, however, will not change the incentive of any individual – who, despite the harm he or she suffers as a result of unaddressed risks or ill-considered policies, cannot change the course of public policymaking by changing his or her personal stances, which, if contrary to the ones that prevail in that person's group, will continue to expose him or her to considerable social disadvantage.
ICT thus sees a particular species of group competition as subversive of the disposition of democratic citizens to use their capacities to comprehend decision-relevant science – or at least to use them in ways that ordinarily steer them toward convergence on the best available evidence. Persistent conflict over risks and other policy-relevant facts reflects a ‘tragedy of the science communications commons’: a misalignment between the individual interests that culturally diverse citizens have in forming beliefs that connect them to others who share their distinctive understanding of the best life and the collective interest that members of all such groups share in the enactment of public policies that enable them to pursue their ends free from threats to their health and prosperity (Kahan et al., Reference Kahan, Peters, Wittlin, Slovic, Ouellette, Braman and Mandel2012; Kahan, Reference Kahan2013).
Study design and hypotheses
Overview
We undertook a study to test SCT and ICT. The study involved drawing inferences from data generated by a fictional experiment. Both the focus of the experiment – the effectiveness of a new skin rash treatment and the effectiveness of a ban on carrying concealed weapons in public – and its outcome were manipulated. By enabling us to examine whether the subjects’ ability to correctly interpret the data would vary only in relation to their proficiency in quantitative reasoning or vary as well in relation to the ideological congeniality of the experiment results, this design effectively pitted SCT and ICT against one another.
Sample
The subjects for the study consisted of a nationally diverse sample of 1111 US adults. The subjects were recruited to participate by Polimetrix/YouGov, which administered the study via that firm's online testing facilities. The sample was 52% female, and the mean age of the subjects was 48 years. Seventy-three percent of the subjects were white, and 11% were African–American. Twenty-eight percent of the sample self-identified as Republican, 36% as Democrat, and 30% as independent. Twenty-six percent identified themselves as either ‘Liberal’ or ‘Very Liberal’; 38% as ‘Conservative’ or ‘Very Conservative’; and 27% as ‘Moderate’. The mean education level was ‘some college’; the mean annual income was $40,000 to $49,000. The study was administered over a period from late April to mid-May, 2013.
Individual characteristic measures
Subjects furnished standard demographic data, including political affiliations and outlooks. Party self-identification (‘dem_repub’) was measured with a seven-point Likert item (‘Strong Democrat’; ‘Democrat’; ‘Independent Lean Democrat’; ‘Independent’; ‘Independent Lean Republican’; ‘Republican’; ‘Strong Republican’). Political ideology (‘libcon’) was measured with a five-point Likert item (‘Very Liberal’; ‘Liberal’; ‘Moderate’; ‘Conservative’; ‘Very Conservative’). Responses to these two items formed a reliable aggregate Likert scale (α = 0.83), which was labeled ‘Conserv_Repub’ and transformed into a z-score to facilitate interpretation (Smith, Reference Smith, Reis and Judd2000).
The right–left political orientation measured by Conserv_Repub is a familiar representation of the basis on which the public is divided on many issues turning on decision-relevant science. More importantly, it is one indicator of the latent group affinities of the sort that can be expected to generate motivated reasoning.Footnote 1
We also measured the subjects’ numeracy. A well-established and highly studied construct, numeracy encompasses not just mathematical ability, but also a disposition to engage quantitative information in a reflective and systematic way and to use it to support valid inferences (Peters et al., Reference Peters, Västfjäll, Slovic, Mert, Maocco and Dickert2006; Liberali et al., Reference Liberali, Reyna, Furlan, Stein and Pardo2012).
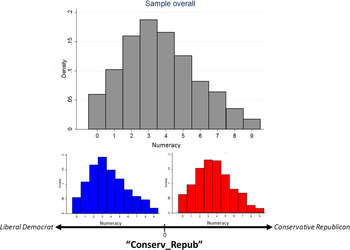
We assessed the numeracy of our subjects with a battery of word problems conventionally used for this purpose (Weller et al., Reference Weller, Dieckmann, Tusler, Mertz, Burns and Peters2012). The mean number of correct responses was 3.7 (SD = 2.1). The distribution of scores was essentially normal (kurtosis = 2.6), a result consistent with previous studies aimed at constructing a scale that could be expected to measure variation across the entire range of the latent capacity measured by the numeracy scale (α = 0.74). Subjects who scored above the mean on Conserv_Repub scored slightly higher than those who scored below the mean (ΔM = 0.3, t = 2.44, p = 0.02) (Figure 1).
Numeracy scores. Bars denote density distribution of scores on the numeracy scale

Stimulus
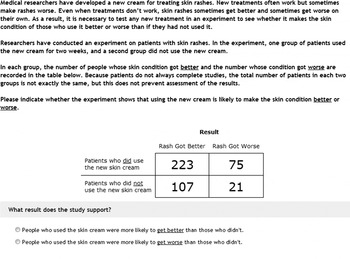
The stimulus consisted of four versions of a problem involving interpretation of data and causal inference. The problem described an experiment and the observed results (Figure 2). Those results were reported in a 2 × 2 contingency table, the columns of which specified the number of cases that reflected positive and negative results, respectively, and the rows of which reflected the experimental treatment.
Stimulus from ‘rash increases’ condition. Subjects were advised that researchers had conducted an experiment to determine whether a new skin treatment was effective or instead had adverse effects. The results were summarized in a 2 × 2 contingency table, and the subjects were then instructed to determine whether the experiment showed that the skin conditions of people treated with the cream were more likely to ‘get better’ or ‘get worse’

Two of the versions of the experiment involved a skin rash treatment. In these versions, subjects were advised that “[m]edical researchers have developed a new cream for treating skin rashes.” They were also advised that “[n]ew treatments often work but sometimes make rashes worse,” and “skin rashes sometimes get better and sometimes get worse on their own,” whether or not a person is treated. To determine the effect of the new treatment, experimenters (the subjects were told) had divided a number of patients suffering skin rashes into two groups – one that was administered the skin cream and another that was not; after a 2-week period, experimenters totaled up how many of the patients got better and how many got worse in each group. Based on the results, as reflected in the 2 × 2 contingency table (Figure 2), subjects were instructed to indicate whether the “[p]eople who used the skin cream were more likely to get better than those who didn't,” or instead “[p]eople who used the skin cream were more likely to get worse than those who didn't.”
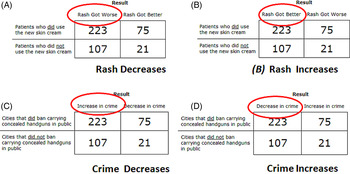
The two versions of the skin treatment problem differed only with respect to which result the experiment supported. The numbers in the 2 × 2 contingency table were kept the same, but the labels at the tops of the columns – “Rash got better” and “Rash got worse” – were manipulated (Figure 3).
Experimental conditions. Subjects were assigned to one of four conditions. The conditions are identified by labels (A) to (D) in a manner that indicates the result or outcome of the experiment that is most supported by the data contained in the relevant table. The correct interpretation of the data was manipulated by varying the results specified by the headings above the columns

Correctly interpreting the data was expected to be difficult. Doing so requires assessing not just the absolute number of subjects who experienced positive outcomes (“rash better”) and negative ones (“rash worse”) in either or both conditions, but rather comparing the ratio of those who experienced a positive outcome to those who experienced a negative one in each condition. Comparing these ratios is essential to detecting covariance between the treatment and the two outcomes, a necessary element of causal inference that confounds even many intelligent people (Stanovich & West, Reference Stanovich and West1998; Stanovich, Reference Stanovich2009).
Based on previous studies using the design reflected in this experiment, it is known that most people use one of two heuristic alternatives to this approach. The first involves comparing the number of outcomes in the upper left cell to the number in the upper right one (‘1 vs 2’). The other (‘1 vs 3’) involves comparing the numbers in the upper left and lower left cells (Wasserman et al., Reference Wasserman, Dorner and Kao1990).
Each of these heuristic strategies generates a recognizable species of invalid causal inference. ‘1 vs 2’ amounts to assessing a treatment without considering information from a control. ‘1 vs 3’ compares outcomes in the treatment and control, but in a manner that neglects to consult information necessary to disentangle the impact of the treatment from other influences at work in both conditions.
In the real world, of course, use of either of these defective strategies – both of which amount to failing to use all of the information necessary to make a valid causal inference – might still generate the correct answer. But for our study stimulus, the numbers in the cells of the contingency table were deliberately selected so that use of either heuristic strategy would generate an incorrect interpretation of the results of the fictional skin treatment experiment.
The second two versions of the experiment involved a gun control measure (Figure 3). Subjects were instructed that a “city government was trying to decide whether to pass a law banning private citizens from carrying concealed handguns in public.” Government officials, subjects were told, were “unsure whether the law will be more likely to decrease crime by reducing the number of people carrying weapons or increase crime by making it harder for law-abiding citizens to defend themselves from violent criminals.” To address this question, researchers had divided cities into two groups: one consisting of cities that had recently enacted bans on concealed weapons and another that had no such bans. They then observed the numbers of cities that experienced “decreases in crime” and those that experienced “increases in crime” in the next year. Again supplied this information in a 2 × 2 contingency table, subjects were instructed to indicate whether “cities that enacted a ban on carrying concealed handguns were more likely to have a decrease in crime,” or instead were “more likely to have an increase in crime than cities without bans.” The column headings on the 2 × 2 table were again manipulated, generating one version in which the data, properly interpreted, supported the conclusion that cities banning guns were more likely to experience increased crime relative to those that had not, and another version in which cities banning guns were more likely to experience decreased crime.
Overall, then, there were four experimental conditions, reflecting opposite experiment results for both the skin treatment version of the problem and the gun ban version. The design was a between-subjects ones, in which individuals were assigned to only one of these conditions. For the sake of expository convenience, we will refer to the conditions as ‘rash decrease’, ‘rash increase’, ‘crime decrease’, and ‘crime increase’, with the label describing the result that a correct interpretation of the 2 × 2 contingency table would most support.
Hypotheses
We formed three hypotheses. The first was that subjects scoring high in numeracy would be more likely to get the right result in both skin treatment conditions.
This hypothesis reflected results in previous studies. As indicated, such studies show that the covariance-detection problem featured in this experiment is very difficult for most people to answer correctly (Stanovich, Reference Stanovich2009).
One recent study, however, shows that the likelihood of answering the problem correctly is predicted by an individual's score on the cognitive reflection test (CRT) (Toplak et al., Reference Toplak, West and Stanovich2011). The CRT features a set of problems, each of which is designed to prompt an immediate and intuitively compelling response that is in fact incorrect. Because supplying the correct answer requires consciously stifling this intuition and logically deducing the right response, the CRT is understood to measure the disposition to use the slower, deliberate form of information processing associated with System 2, as opposed to the rapid, heuristic-driven form associated with System 1.
The CRT requires elementary mathematical skills, but is not a numeracy test per se (Liberali et al., Reference Liberali, Reyna, Furlan, Stein and Pardo2012). However, insofar as making valid causal inferences in the covariance-detection problem likewise demands suppressing the heuristic tendency to give decisive significance to suggestive but incomplete portions of the information reflected in the 2 × 2 contingency table, it is not surprising that individuals who score higher on the CRT are more likely to correctly interpret the data that the table contains.
We would expect the numeracy scale to be an even stronger predictor of how likely a person is to select the correct response in the skin treatment versions of this problem. Like the CRT, the numeracy scale measures a disposition to subject intuition to critical interrogation in light of all available information, and thus to avoid mistakes characteristic of overreliance on heuristic, System 1 information processing (Liberali et al., Reference Liberali, Reyna, Furlan, Stein and Pardo2012). Indeed, two CRT items are conventionally included in the numeracy scale (Weller et al., Reference Weller, Dieckmann, Tusler, Mertz, Burns and Peters2012), and we added the third in this study in order to reinforce its sensitivity to the disposition to preempt reliance on unverified intuition. However, whereas the CRT measures the disposition to use System 2 information processing generally, the numeracy scale measures how proficient individuals are in using it to reason with quantitative information in particular, a capacity specifically relevant to the covariance-detection problem featured in the stimulus.
The hypothesis that performance in the skin treatment conditions would be positively correlated with numeracy was common to SCT and ICT. The second and third hypotheses reflect opposing SCT and ICT predictions relating to results in the gun ban conditions.
Whereas the issue in the skin treatment versions of the covariance-detection problem – does a new skin cream improve or aggravate a commonplace and non-serious medical condition? – is devoid of partisan significance, the question whether a gun ban increases or instead decreases crime is a high-profile political one that provokes intense debate. Consistent with the growing literature on culturally or ideologically motivated reasoning (Jost et al., Reference Jost, Hennes, Lavine and Carlson2014), we anticipated that subjects in the gun ban conditions would be more likely to construe the data as consistent with the position that prevails among persons who share their political outlooks – regardless of which version of the problem (‘crime increases’ or ‘crime decreases’) they were assigned. Specifically, we surmised that gratification of the interest subjects would have in confirmation of their predispositions would reinforce their tendency to engage in heuristic reasoning when subjects were assigned to the conditions in which ‘1 vs 2’ or ‘1 vs 3’ generated a mistaken answer that was nonetheless congenial to their political outlooks. That ideologically motivated reasoning would compound heuristic reasoning in this way was specifically supported by studies showing that an existing position on a contested nonpolitical issue (Dawson & Gilovich, Reference Dawson, Gilovich and Regan2000), aversion to threatening information (Dawson et al., Reference Dawson, Gilovich and Regan2002), and prior beliefs (Stanovich & West, Reference Stanovich and West1998) can all magnify the sorts of reasoning errors that are frequently encountered in covariance-detection problems identical or closely related to the one featured in our stimulus.
But in whom should motivated cognition interfere with reasoning in this way and by how much? SCT blames a deficit in public science comprehension for consistent controversy over risks and related facts. Numeracy furnishes one important measure of the capacity to make sense of scientific evidence. Based on SCT, then, it seems reasonable to predict that the degree of ideological polarization expected to be observed in the gun ban conditions would abate as subjects become higher in numeracy. Such a prediction would be consistent, too, with the position, advanced by many scholars, that ideologically motivated cognition is itself best understood as a form of the heuristic-driven information processing that is characteristic of System 1 reasoning (Sunstein, Reference Sunstein2006; Westen et al., Reference King, Honaker, Joseph and Scheve2006; Marx et al., Reference Marx, Weber, Orlove, Leiserowitz, Krantz, Roncoli and Phillips2007; Weber & Stern, Reference Weber and Stern2011; Lodge & Taber, Reference Lodge and Taber2013). If so, one might expect numeracy, as a capacity that demands the form of conscious reflection associated with System 2, to preempt the motivated reasoning that most people bring to bear on the covariance-detection problem. The second hypothesis, then, was that subjects scoring higher in numeracy would be more likely to construe the data correctly not only when it was consistent with their ideological predispositions, but also when it was inconsistent with them, and thus they were likely to display less ideological polarization than subjects lower in numeracy.
ICT generates a different prediction based on a different understanding of the source of public conflict over decision-relevant science. ICT views ideologically motivated reasoning as a form of identity self-defense that reliably protects individuals’ interests by guiding them to construe evidence in a manner that enables them to persist in culturally congenial or identity-affirming beliefs. Persistent political polarization over policy-relevant facts that admit of empirical study is not a consequence of any deficit in science comprehension, but rather a consequence of the disabling impact of symbolic status competition on the disposition of individuals to use their ability to comprehend science in a manner geared to producing evidence-congruent beliefs (Kahan et al., Reference Kahan, Slovic, Braman and Gastil2006).
On this account, we should not expect the degree of ideological polarization that is likely to characterize subjects’ responses in the gun ban conditions to diminish with numeracy. Indeed, the third hypothesis, one that is associated with ICT but not SCT, is that ideological polarization in the gun ban conditions should be most extreme among those highest in numeracy.
Individuals high in science comprehension have a special resource to engage evidence in a manner calculated to generate ideological congenial conclusions. Because the causal-inference problem featured in this study is genuinely difficult, it makes sense to expect subjects to resort to such reasoning when assigned to the condition (‘crime decreases’ for ‘liberal Democrats’ and ‘crime increases’ for ‘conservative Republicans’) in which less effortful heuristic engagement with the provided information would generate an identity-threatening conclusion for persons with their political outlooks. But those low in numeracy will be less likely to succeed in discerning the correct, identity-affirming conclusion that the data in that condition actually support because they are less likely to possess the sorts of science-comprehension capacities that doing so requires.
At the same time, ICT predicts that high-numerate subjects should not be substantially more likely to correctly interpret the data than low-numeracy ones when assigned to the condition that presents identity-threatening information (‘crime increases’ for ‘liberal Democrats’ and ‘crime decreases’ for ‘conservative Republicans’). Engaging in the form of intensive reflection associated with System 2 is cognitively taxing; it is something we should expect individuals to resort to only when they themselves are likely to recognize (consciously or otherwise) some advantage in using it. Thus, where less effortful, heuristic engagement with the information in the gun ban conditions generates an identity-affirming conclusion, ICT predicts that high-numeracy subjects will ‘settle’ for heuristic reasoning, and end up with the wrong interpretation of the data, just as their low-numeracy counterparts will (Kahan, Reference Kahan2013).
If high-numeracy subjects use their special cognitive advantage selectively – only when doing so generates an ideologically congenial answer but not otherwise – they will end up even more polarized than their low-numeracy counterparts. Such a result, while highly counterintuitive from the perspective of SCT, would be consistent with the view of a smaller group of scholars who take the view that identity-protective cognition operates on both heuristic and systematic – System 1 and System 2 – forms of information processing (Giner-Sorolla & Chaiken, Reference Giner-Sorolla and Chaiken1997; Chen et al., Reference Chen, Duckworth and Chaiken1999; Cohen, Reference Cohen2003; Kahan, Reference Kahan2013). It would also be consistent with, and help to explain, results from observational studies showing that the most science-comprehending citizens are the most polarized on issues like climate change and nuclear power (Hamilton et al., Reference Hamilton, Matthew and Schaefer2012; Kahan et al., Reference Kahan, Peters, Wittlin, Slovic, Ouellette, Braman and Mandel2012).
Results
Preliminary analyses
No matter what condition subjects were assigned to, they were highly likely to select the wrong response to the covariance-detection problem. Overall, 59% of the subjects supplied the incorrect answer.
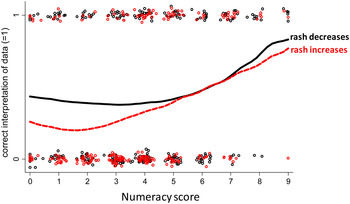
Figure 4 presents a scatter plot of subject responses in the skin treatment conditions. It supplies strong support for the first hypothesis – that the likelihood of correctly interpreting the data in the skin treatment conditions would be conditional on numeracy. Reflecting the difficulty of the task, subjects of low and even moderate numeracy scores were more likely than not to select the wrong answer in both ‘rash decreases’ and ‘rash increases’ conditions. Even among those scoring in the top 50% on the numeracy scale (four or more answers correct), less than half (48%) supplied the correct answer. It was not until scores on the numeracy scale reached 90th percentile or above (seven to nine correct) that 75% of the subjects correctly identified the result that was most supported by the data in the 2 × 2 contingency table.
Scatter plot of responses in skin treatment conditions. Red circles identify subjects assigned to the ‘rash increases’ condition and black ones to the ‘rash decreases’ condition. Locally weighted regression lines (Cohen et al., Reference Cohen, Cohen, West and Aiken2003) track the proportion of subjects answering the problem correctly in relation to numeracy levels in the two skin treatment conditions

Figure 5 presents a scatter plot of subject responses in the gun control condition. The pattern differs from that in the skin treatment conditions. The impact of numeracy on performance in the ‘crime increases’ condition is minimal. The proportion of subjects correctly interpreting the data did increase as numeracy increased in the ‘crime decreases’ condition, but even at the highest levels of numeracy, the percentage of subjects who supplied the incorrect response in that condition was relatively high. Overall, even among subjects in the 90th percentile, only 57% of those assigned to one of the gun control conditions correctly identified the outcome most supported by the data. The discrepancy is consistent with the inference that a factor present in the gun control conditions but not in the skin treatment conditions inhibits the contribution that numeracy makes to identifying the correct answer.
Scatter plot of responses in gun ban conditions. Red circles identify subjects assigned to the ‘crime increases’ condition and black ones to the ‘crime decreases’ condition. Locally weighted regression lines (Cohen et al., Reference Cohen, Cohen, West and Aiken2003) track the proportion of subjects answering the problem correctly in relation to numeracy levels in the two gun control conditions

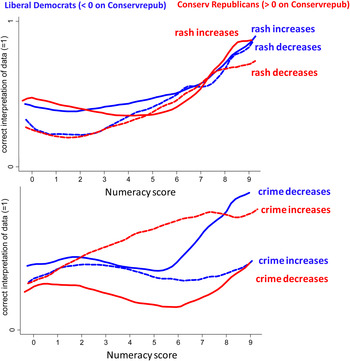
Figure 6 plots responses for all four conditions among subjects of opposing political outlooks. Visual inspection demonstrates no meaningful variation among ‘Liberal Democrats’ (subjects scoring below the mean on Conserv_Repub) and ‘Conservative Republicans’ (subjects scoring above the mean) in the skin rash conditions. For both groups, the relationship between numeracy and identifying the result genuinely supported by the data displays the same pattern as was observed in the sample as a whole.
Responses by subjects of opposing cultural outlooks. Locally weighted regression lines (Cohen et al., Reference Cohen, Cohen, West and Aiken2003) track the proportion of subjects answering the problem correctly in relation to numeracy levels in the various conditions. Blue lines plot relationships for subjects who score below the mean and red ones are for subjects who score above the mean on Conserv_Repub, the composite measure based on liberal–conservative ideology and identification with one or the other major party. Solid lines are used for subjects in the condition that the data, when properly interpreted, support the inference that either skin rashes or crime decreased; dashed lines are used for subjects in conditions in which the data, when properly interpreted, support the inference that either skin rashes or crime increased

Nevertheless, visual inspection suggests a clear interaction between numeracy and political outlooks in the gun ban conditions (Figure 6). Liberal Democrats become increasingly likely to correctly identify the result supported by the data as they become more numerate in the ‘crime decreases’ condition, but increasing numeracy had minimal impact for Liberal Democrats in the ‘crime increases’ condition. Among Conservative Republicans, the pattern was inverted: the impact of higher numeracy on subjects’ ability to supply the correct answer was substantially larger in the ‘crime increases’ condition than in the ‘crime decreases’ one.
In other words, higher numeracy improved subjects’ performance in detecting covariance only in the ‘gun control’ condition in which the correct response was congenial to the subjects’ political outlooks. This result is inconsistent with the second SCT hypothesis, which predicted that political polarization – of the form clearly apparent at low and middle levels of numeracy – would abate at higher levels.
Indeed, visual inspection suggests that polarization – as measured by the gap between subjects of opposing political outlooks assigned to the same experimental condition – was greatest among subjects highest in numeracy. Such a result would fit the third ICT hypothesis, which predicted that subjects capable of correctly interpreting the data would resort to the form of effortful, System 2 processing necessary to do so only when the less effortful, heuristic, or System 1 assessment of the data threatened their ideological identities.
Multivariate analyses
In order to perform a more exacting test of the study hypotheses, a multivariate regression model was fit to the data. Described in more detail in the technical appendix, the regression model contained predictors for subjects’ political outlooks and numeracy and for the experimental condition to which they were assigned.
Consistent with visual inspection of the raw data, the results of this analysis confirm that higher numeracy increases the probability that subjects will correctly interpret the results in the skin treatment conditions. The results also suggest that less numerate subjects are more likely to correctly interpret the data in the ‘rash decreases’ condition than in the ‘rash increases’ condition, but by an amount that is modest in size and nonsignificant (9% ± 14%, LC = 0.95).
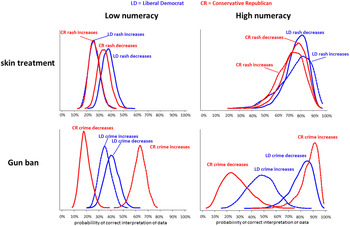
Such outcomes are presented graphically in Figure 7. Generated by Monte Carlo simulation, the density plots illustrate the estimated probability of correctly interpreting the data, and the precision of that estimate, for a low-numeracy (three correct) and a high-numeracy (seven correct) ‘liberal Democrat’ (–1 SD on Conserv_Repub) and for a low-numeracy and a high-numeracy ‘conservative Republican’ (+1 SD) in each experimental condition (King et al., Reference King, Tom and Wittenberg2000).
Predicted probabilities of correctly interpreting the data. Density distributions derived via Monte Carlo simulation from regression Model 3, Table A1, when predictors for Conserv_Repub set at –1 SD and +1 SD for ‘liberal Democrat’ and ‘conservative Republican’, respectively, and numeracy set at three and seven correct answers for ‘low numeracy’ and ‘high numeracy’, respectively (King et al., Reference King, Tom and Wittenberg2000)

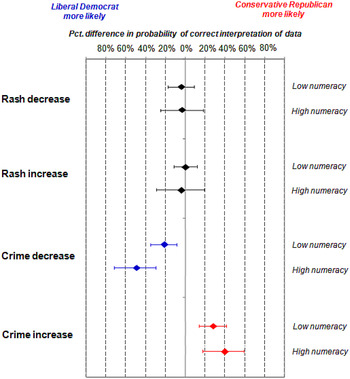
Figure 7 also strongly disconfirms the second SCT hypothesis. A low-numeracy liberal Democrat is more likely to correctly identify the outcome supported by the data than is a low-numeracy conservative Republican when the data, in fact, support the conclusion that a gun ban decreases crime, but is less likely to correctly identify the outcome when the data support the conclusion that a gun ban increases crime. This pattern of polarization, contrary to SCT hypothesis, does not abate among high-numeracy subjects. Indeed, it increases. On average, the high-numeracy partisans whose political outlooks were affirmed by the data, when properly interpreted, was 45% more likely (±14%, LC = 0.95) to identify the conclusion actually supported by the gun ban experiment than were the high numeracy partisans whose political outlooks were affirmed by selecting the incorrect response. The average difference in the case of low-numeracy partisans was 25% (±10%) – a difference of 20% (±16%). Corroborating the inference that this effect was attributable to ideologically motivated reasoning, there were no meaningful or significant partisan differences among high-numeracy subjects – or low-numeracy ones, for that matter – in the skin treatment conditions (Figure 8). These findings support the third ITC hypothesis.
Predicted differences in probability that partisans will correctly interpret the data. Predicted differences in probabilities derived via Monte Carlo simulation from regression Model 3, Table A1. Predictors for Conserv_Repub set at –1 SD and +1 SD for ‘liberal Democrat’ and ‘conservative Republican’, respectively, and numeracy set at three and seven correct answers for ‘low numeracy’ and ‘high numeracy’, respectively. Confidence intervals indicate the 0.95 levels of confidence

The reason that numeracy amplified polarization, these analyses illustrate, was that high-numeracy partisans were more likely than low-numeracy ones to identify the correct response to the covariance-detection problem when doing so affirmed subjects’ political outlooks. A high-numeracy conservative Republican, the model predicted, was 21% (±16%) more likely than a low-numeracy one to recognize the correct result in the ‘crime increases’ condition; in the ‘crime decreases’ condition, a high-numeracy liberal Democrat was 32% (±20%) more likely than a low-numeracy one to identify the correct response. But when the data, correctly interpreted, threatened subjects’ outlooks, high-numeracy partisans enjoyed no meaningful advantage over their low-numeracy counterparts (3% [±16%] for conservative Republicans in ‘crime decreases’; 11% [ ± 20%] for liberal Democrats in ‘crime increases’), all of whom were unlikely to identify the correct response (Figure 7).
This pattern is also consistent with ITC. ITC predicts that where an individual has an identity-protective stake in a particular outcome, he or she will resort to effortful, System 2 processing – of the sort needed to draw valid inferences from complex data – only when less effortful heuristic reasoning generates a conclusion that threatens his or her identity. Here, high-numeracy subjects in the gun ban conditions were likely to terminate their engagement with the evidence when heuristic assessment of it gratified their political predispositions – even though the resulting inference that they drew about the result of the experiment was incorrect.
At the same time, the source of the contribution that numeracy makes to enlarging polarization in the gun control conditions also helps to address the question of whether subjects of all levels of numeracy were construing the data in a reflexively or automatically partisan fashion without making any effort to engage it. This interpretation is not consistent with the data. If this were happening, low-numeracy partisans would have done just as well as high-numeracy ones when assigned to the condition in which a correct response was affirming of their identities.
In this particular context, then, accurately discerning the identity-affirming outcome depended on a high degree of numeracy. It was the selective exercise of the special capacity that higher numeracy confers in this regard that aggravated partisan polarization among high-numeracy subjects.
The regression analysis also identified one additional main effect. Even after accounting for the effects of political outlooks and numeracy, being assigned to ‘crime increases’ as opposed to the ‘crime decreases’ condition substantially improved subject performance in the covariance-detection problem (Table A1, Model 3). The size of the effect (b = 1.07, z = 4.02, p < 0.01) is equivalent to a 26% increase (±12%), which can be interpreted as how much more likely an individual of mean political outlooks and mean numeracy would be to identify the correct result in the ‘crime increases’ condition than his or her counterpart in the ‘crime decreases’ condition.
This outcome was not anticipated. But insofar as previous research on the ability to detect covariance has shown that confirmation bias can magnify the tendency of subjects to rely decisively, and mistakenly, on a heuristic strategy (Stanovich & West, Reference Stanovich and West1998), this result can plausibly be viewed as suggesting the presence of a strong expectation among a large proportion of subjects of diverse political outlooks that the gun ban would be ineffective.
Discussion
Summary of principal results
The experiment that was the subject of this paper was designed to test two opposing accounts of conflict over decision-relevant science. The first – the science comprehension thesis (SCT) – attributes such conflicts to the limited capacity of the public to understand the significance of valid empirical evidence. The second – the identity-protective cognition thesis (ICT) – sees a particular recurring form of group conflict as disabling the capacities that individuals have to make sense of decision-relevant science: when policy-relevant facts become identified as symbols of membership in and loyalty to affinity groups that figure in important ways in individuals’ lives, they will be motivated to engage empirical evidence and other information in a manner that more reliably connects their beliefs to the positions that predominate in their particular groups than to the positions that are best supported by the evidence.
Study subjects were assigned to analyze the results of an experiment. Correctly interpreting the data required subjects to engage in a form of quantitative analysis – identifying covariance between an experimental treatment and outcomes – that is essential to valid causal inference but that many people have difficulty performing reliably and accurately. Not surprisingly, we found that when the experiment was styled as one involving a skin rash treatment, the subjects’ probability of identifying the most supported outcome was highly sensitive to subjects’ numeracy, a capacity to understand and make proper use of quantitative information in reasoning tasks.
Also not surprisingly – given the growing literature on ideologically motivated reasoning – subjects’ likelihood of correctly identifying the correct response varied in relation to the subjects’ political outlooks when the experiment was styled as one involving a gun control ban. Subjects were more likely to correctly identify the result most supported by the data when doing so affirmed the position one would expect them to be politically predisposed to accept – that the ban decreased crime, in the case of more liberal subjects who identify with the Democratic Party; and that it increased crime, in the case of more conservative ones who identify with the Republican Party – than when the correct interpretation of the data threatened or disappointed their predispositions.
SCT, however, predicted that polarization among high-numeracy partisans would be lower than among low-numeracy ones in the gun ban conditions, consistent with the premise that political conflict over decision-relevant science is fed by defects in the capacity of ordinary members of the public to make sense of empirical evidence. The data did not support this prediction. On the contrary, numeracy magnified political polarization among high-numeracy partisans. This result was consistent with ICT.
More numerate individuals are benefitted by forming identity-congruent beliefs just as much as less numerate individuals are, and harmed just as much from forming identity-noncongruent beliefs. But more numerate individuals have a cognitive ability that lower-numeracy ones do not. ICT predicts that more numerate individuals will use that ability opportunistically in a manner geared to promoting their interests in forming and persisting in identity-protective beliefs.
The results in the experiment suggest that high-numeracy partisans did exactly that in the gun ban conditions. Where reliance on low-effort heuristic reasoning suggested an inference that was affirming of their political outlooks, high-numeracy partisans selected the answer that reflected that mode of information processing – even though it generated the wrong answer. But where reliance on low-effort heuristic processes suggested an inference that was threatening to their outlooks, high-numeracy partisans used the ability that they but not their low-numeracy counterparts possessed to make proper use of all the quantitative information presented in a manner that generated a correct, identity-affirming conclusion. This selectivity of their use of their greater capacity to draw inferences from quantitative information is what generated greater polarization among high-numeracy partisans than low-numeracy ones.
Ideologically motivated cognition and dual process reasoning generally
The ICT hypothesis corroborated by the experiment in this paper conceptualizes numeracy as a capacity associated with the disposition to engage in deliberate, effortful System 2 reasoning as applied to quantitative information. The results of the experiment thus help to deepen insight into the ongoing exploration of how ideologically motivated reasoning interacts with System 2 information processing generally.
As suggested, dual process reasoning theories typically posit two forms of information processing: a “fast, associative” one “based on low-effort heuristics,” and a “slow, rule based” one that relies on “high-effort systematic reasoning” (Chaiken & Trope, Reference Chaiken and Trope1999, p. ix). Some researchers have assumed (not unreasonably) that ideologically motivated cognition – the tendency selectively to credit or discredit information in patterns that gratify one's political or cultural predispositions – reflects over-reliance on the heuristic forms of information processing associated with heuristic-driven, System 1 of information processing (e.g. Sunstein, Reference Sunstein2006; Westen et al., Reference King, Honaker, Joseph and Scheve2006; Marx et al., Reference Marx, Weber, Orlove, Leiserowitz, Krantz, Roncoli and Phillips2007; Weber & Stern, Reference Weber and Stern2011; Lodge & Taber, Reference Lodge and Taber2013).
There is mounting evidence that this assumption is incorrect. It includes observational studies that demonstrate that science literacy, numeracy, and education (Hamilton, Reference Hamilton2011; Hamilton et al., Reference Hamilton, Matthew and Schaefer2012; Kahan et al., Reference Kahan, Peters, Wittlin, Slovic, Ouellette, Braman and Mandel2012; Kahan, Reference Kahan2015) – all of which it is plausible to see as elements or outgrowths of the critical reasoning capacities associated with System 2 information processing – are associated with more, not less, political division of the kind one would expect if individuals were engaged in motivated reasoning.
Experimental evidence points in the same direction. Individuals who score higher on the cognitive reflection test (CRT), for example, have shown an even stronger tendency than ones who score lower to credit evidence selectively in patterns that affirm their political outlooks (Kahan, Reference Kahan2013). The evidence being assessed in that study was non-quantitative, but involved a degree of complexity that was likely to obscure its ideological implications from subjects who were inclined to engage the information in a casual or heuristic fashion. The greater polarization of subjects who scored highest on the CRT was consistent with the inference that individuals who are more disposed to engage systematically with information would be more likely to discern the political significance of it and would use their critical reasoning capacities selectively to affirm or reject it conditional on its congeniality to their political outlooks.
The experimental results we report in this paper display the same interaction between motivated cognition and System 2 information processing. The numeracy scale predicts how likely individuals are to resort to more systematic as opposed to heuristic engagement with quantitative information essential to valid causal inference. The results in the gun ban conditions suggest that high-numeracy subjects made use of this System 2 reasoning capacity selectively in a pattern consistent with their motivation to form a politically congenial interpretation of the results of the gun ban experiment. This outcome is consistent with that of scholars who see both systematic (or System 2) and heuristic (System 1) reasoning as vulnerable to motivated cognition (Giner-Sorolla & Chaiken, Reference Giner-Sorolla and Chaiken1997; Chen et al., Reference Chen, Duckworth and Chaiken1999; Cohen, Reference Cohen2003).
These findings also bear on whether ideologically motivated cognition is usefully described as a manifestation of ‘bounded rationality’. Cognitive biases associated with System 1 reasoning are typically characterized that way on the grounds that they result from an overreliance on heuristic patterns of information processing that reflect generally adaptive but still demonstrably inferior substitutes for the more effortful and more reliable type of information processing associated with System 2 reasoning (e.g. Jolls et al., Reference Jolls, Sunstein and Thaler1998; Kahneman, Reference Kahneman2003).
We submit that a form of information processing cannot reliably be identified as ‘irrational’, ‘subrational’, ‘boundedly rational’, or the like independent of what an individuals’ aims are in making use of information (Baron, Reference Baron2008, p. 61). It is perfectly rational, from an individual welfare perspective, for individuals to engage with decision-relevant science in a manner that promotes culturally or politically congenial beliefs. What any individual member of the public thinks about the reality of climate change, the hazards of nuclear waste disposal, or the efficacy of gun control is too inconsequential to influence the risk that that person or anyone he or she cares about faces. Nevertheless, given what positions on these issues signify about a person's defining commitments, forming a belief at odds with the one that predominates on it within important affinity groups of which such a person is a member could expose him or her to an array of highly unpleasant consequences (Kahan, Reference Kahan2012). Forms of information processing that reliably promote the stakes that individuals have in conveying their commitment to identity-defining groups can thus be viewed as manifesting what Anderson (Reference Anderson1993) and others (Lessig, Reference Lessig1995; Akerlof & Kranton, Reference Akerlof and Kranton2000; Cohen, Reference Cohen2003; Hillman, Reference Hillman2010; Stanovich, Reference Stanovich2013) have described as expressive rationality.
If ideologically motivated reasoning is expressively rational, then we should expect those individuals who display the highest reasoning capacities to be the ones most powerfully impelled to engage in it (Kahan et al., Reference Kahan, Peters, Wittlin, Slovic, Ouellette, Braman and Mandel2012). This study now joins the rank of a growing list of others that fit this expectation and that thus supports the interpretation that ideologically motivated reasoning is not a form of bounded rationality, but instead a sign of how it becomes rational for otherwise intelligent people to use their critical faculties when they find themselves in the unenviable situation of having to choose between crediting the best available evidence or simply being who they are.
Conclusion: protecting the ‘science communication environment’
To conclude that ideologically motivated reasoning is expressively rational obviously does not imply that it is socially or morally desirable (Lessig, Reference Lessig1995). Indeed, the implicit conflation of individual rationality and collective wellbeing has long been recognized to be a recipe for confusion, one that not only distorts inquiry into the mechanisms of individual decision-making, but also impedes the identification of social institutions that remove any conflict between those mechanisms and attainment of the public good (Olson, Reference Olson1965). Accounts that misunderstand the expressive rationality of ideologically motivated cognition are unlikely to generate reliable insights into strategies for counteracting the particular threat that persistent political conflict over decision-relevant science poses to enlightened democratic policy-making.
Commentators who subscribe to what we have called the science comprehension thesis typically propose one of two courses of action. The first is to strengthen science education and the teaching of critical reasoning skills, in order better to equip the public for the cognitive demands of democratic citizenship in a society where technological risk is becoming an increasingly important focus of public policy-making (Miller & Pardo, Reference Miller, Pardo, Dierkes and Grote2000). The second is to dramatically shrink the scope of the public's role in government by transferring responsibility for risk regulation and other forms of science-informed policy-making to politically insulated expert regulators (Breyer, Reference Breyer1993). This is the program advocated by commentators who believe that the public's over-reliance on heuristic-driven forms of reasoning is too elemental to human psychology to be corrected by any form of education (Sunstein, Reference Sunstein2005).
Because it rejects the empirical premise of the science comprehension thesis, the identity-protective cognition thesis takes issue with both of these prescriptions. The reason that citizens remain divided over risks in the face of compelling and widely accessible scientific evidence, this account suggests, is not that that they are insufficiently rational; it is that they are too rational in extracting from information on these issues the evidence that matters most for them in their everyday lives. In an environment in which positions on particular policy-relevant facts become widely understood as symbols of people's membership in and loyalty to opposing cultural groups, it will promote people's individual interests to attend to evidence about those facts in a manner that reliably conforms their beliefs to the ones that predominate in the groups they are members of. Indeed, the tendency to process information in this fashion will be strongest among individuals who display the reasoning capacities most strongly associated with science comprehension.
Thus, improving public understanding of science and propagating critical reasoning skills – while immensely important, both intrinsically and practically (Dewey, Reference Dewey1910) – cannot be expected to dissipate persistent public conflict over decision-relevant science. Only removing the source of the motivation to process scientific evidence in an identity-protective fashion can. The conditions that generate symbolic associations between positions on risk and associated facts on the one hand and cultural identities on the other must be neutralized in order to ensure that citizens make use of their capacity for science comprehension.Footnote 2
In a deliberative environment protected from the entanglement of cultural meanings and policy-relevant facts, moreover, there is little reason to assume that ordinary citizens will be unable to make an intelligent contribution to public policy-making. The amount of decision-relevant science that individuals reliably make use of in their everyday lives far exceeds what any of them (even scientists, particularly when acting outside of the domain of their particular specialty) are capable of understanding on an expert level. They are able to accomplish this feat because they are experts at something else: identifying who knows what about what (Keil, Reference Keil2010), a form of rational processing of information that features consulting others whose basic outlooks individuals share and whose knowledge and insights they can therefore reliably gauge (Kahan et al., Reference Kahan, Braman, Cohen, Gastil and Slovic2010).
These normal and normally reliable processes of knowledge transmission break down when risk or associated facts are transformed (whether through strategic calculation or misadventure and accident) into divisive symbols of cultural identity. The solution to this problem is not – or certainly not necessarily – to divest citizens of the power to contribute to the formation of public policy. Rather, it is to adopt measures that effectively shield decision-relevant science from the influences that generate this reason-disabling state (Kahan et al., Reference Kahan, Slovic, Braman and Gastil2006).
Just as individual wellbeing depends on the quality of the natural environment, so the collective welfare of democracy depends on the quality of a science communication environment that is hospitable to the exercise of the ordinarily reliable reasoning faculties that ordinary citizens use to discern what is collectively known. Identifying strategies for protecting the science communication environment from antagonistic cultural meanings – and for decontaminating it when such protective measures fail – is the most critical contribution that decision science can make to the practice of democratic government.
Acknowledgements
We are indebted to Angie Johnston, Scott Johnson, Matthew Fisher, Andrew Meyer, and Maggie Wittlin for discussion and comments.
Funding
Research for this paper was funded by the National Science Foundation, Grant SES 0922714, and the Cultural Cognition Lab at Yale Law School.
Statistical appendix
This appendix furnishes information on the multivariate regression model used to test the study hypotheses.
Statistical power and missing data
Because it pits opposing ICT and SCT hypotheses against one another, the study design contemplated the possibility of drawing inferences from the absence of an effect (decreased or increased polarization among high-numeracy subjects in the gun ban conditions). The strength of inferences drawn from ‘null’ findings depends heavily on statistical power. The large size of the sample furnished adequate power to detect even small effect sizes (e.g. r = 0.10) with a probability well over 0.80 at p ≤ 0.05 (Cohen, Reference Cohen1988). As a result, findings of non-significance could be equated with a lack of effect and with a low risk of a Type II error (Streiner, Reference Streiner2003). To ensure full exploitation of the power associated with the large sample size, missing data were replaced by multiple imputation (King et al., Reference King, Honaker, Joseph and Scheve2001; Rubin, Reference Rubin2004).
The model
The regression model is a logistic regression model, which is appropriate for assessing the probability of a binary outcome (Cohen et al., Reference Cohen, Cohen, West and Aiken2003) – here, correctly responding to the covariance detection problem. The goal of the model is to determine whether and to what extent numeracy influences the probability that a subject will answer the problem correctly conditional on his or her level of numeracy, his or her political outlook, and the experimental condition to which he or she was assigned. Model variables thus included ones for those predictors, plus cross-product terms suited for assessing their interactions with one another (Cohen et al., Reference Cohen, Cohen, West and Aiken2003, p. 494).
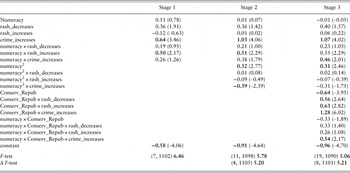
We entered the relevant variables in stages. The aim of the initial two stages was to determine what portion of the variance in the probability of answering correctly could be attributed solely to numeracy and the experimental assignments independently of subjects’ political outlooks. The scatter plots (Figures 4–6) suggested that the impact of numeracy on subjects’ ability to identify the correct response in the covariance-detection problem was not linear, but rather was triggered at a threshold between the 75th and 90th percentiles (five and seven answers correct) on the numeracy scale. The scatter plots also suggested that the impact of numeracy on improving the performance of subjects was uneven across the skin treatment and gun control conditions, a result consistent with the hypothesis that ideologically motivated reasoning would inhibit effortful processing of information in conditions in which heuristic strategies for assessing the data affirmed subjects’ political outlooks. Consistent with these patterns, we found that a quadratic model – one that assumed that numeracy's impact on identifying the data would be curvilinear and vary across each condition (Pampel, Reference Pampel2000, p. 20) – fit the data better than a model that assumed that numeracy's contribution would be linear and invariant across each condition (Table A1, Stages 1–2).
After identifying the best-fitting model based only on subject numeracy and political outlooks, we added terms designed to test whether the impact of numeracy on subject performance was conditional on their political outlooks. Two-way interaction terms that reflected the impact of political outlooks in each condition and three-way ones that reflected how the impact of numeracy varied in each condition in relation to subjects’ political outlooks also improved the fit of the model (Table A1, Stage 3). Adding three-way interaction terms in order to reflect the impact of numeracy2 and political outlook did not improve model fit.
The model cannot be easily explained based on the regression output alone. Models containing multiple two- and three-way interaction terms frequently defy straightforward interpretation, particularly in logistic regression, where the impact that such terms have cannot be determined simply by examining their sign and significance (Ai & Norton, Reference Ai and Norton2003). The only reliable way to determine the effect of such predictors is to calculate their marginal impact on the outcome variable as one varies the values of the predictors in a manner that corresponds to the hypotheses of interest (Powers, Reference Powers2005; Greene, Reference Greene2010). Such an analysis appears in the ‘Multivariate analyses’ section of the text.
Multivariate regression analysis (N = 1111). Outcome variable is ‘correct’, a binary variable coded ‘1’ for correctly interpreting the data and ‘0’ for incorrectly interpreting them. Predictor estimates are logit coefficients with the z-score test statistic indicated parenthetically. ‘Rash_decreases’, ‘rash_increases’, and ‘crime_increases’ are dummy variables reflecting experimental condition assignment (0 = unassigned, 1 = assigned); the reference assignment is to ‘crime decreases’. Both Conserv_Repub and numeracy are centered at ‘0’ for ease of interpretation. Bold typeface indicates that a predictor coefficient, model F-test, or incremental change in model F-test is significant at p < 0.05.