In 2013, California state Senator Kevin de León proudly touted his introduction of S.B. 402, a bill about breastfeeding protocols in hospitals, via a press release on his personal website. The entity listed for reporters to contact regarding questions about the bill, however, was not Senator de León. Instead, the California WIC Association (CWA), a nonprofit organization of local WIC agencies and the sponsor of S.B. 402, was listed as the point of contact for those interested in learning more about the bill (Rosenhall Reference Rosenhall2013). In the California state legislature, extra-legislative organizations or individuals that write legislation and secure a legislator to “author” the bill may be listed as “sponsors.” This example is far from an exception; almost 40% of the bills introduced list an extra-legislative sponsor and over 60% of the bills that become law are sponsored. The role that groups play in determining the legislative agenda has been a fundamental question since Schattschneider (Reference Schattschneider1960). In this paper, I use California’s underexplored reporting institution to study groups’ policy-making success and legislators’ motivations for relying on group assistance.
This paper examines the interaction between group and legislator in the production and promotion of legislation.Footnote 1 Some scholars argue that groups “subsidize” like-minded legislators, characterizing the relationship as a partnership between group and politician where the group has information and the legislator has the ability to introduce legislation (Hall and Deardorff Reference Hall and Deardorff2006). However, previous work does not identify the specific legislative products on which group subsidies are provided and utilized. I use a reporting institution in the California state legislature to determine the relationship between groups and legislators in the production of legislation.Footnote 2 Legislators use group expertise to learn about issues and to boost their success.
While neither Congress nor other states list the nonlegislative sponsor of a bill as clearly as the California state legislature, qualitative evidence suggests that these institutions rely on groups for similar legislative entrepreneurship functions. In interviews with the Senate Judiciary Committee, Nourse and Schacter (Reference Nourse and Schacter2002) find that “the sentiment was uniform that lobbyists can have a strong influence on statutory text and that this is not a rare event but, instead, a normal part of the drafting process” (610). A New York Times analysis uncovers that 70 of the 85 lines of a financial regulation bill came from Citigroup recommendations (Lipton and Protess Reference Lipton and Protess2013). Ansolabehere et al. (Reference Ansolabehere, Ginsberg, Shepsle and Lowi2010) claim that groups “have substantial influence in setting the legislative agenda and in helping craft specific language in legislation” (531). On the state level, Hrebenar and Thomas’s (Reference Hrebenar and Thomas2010) 1987 survey of Maryland state legislators, 61% of legislators agreed that lobbyists provided them with “valuable help in drafting bills and amendments.” Lobbying firm websites highlight victories in getting language they drafted passed for clients.Footnote 3 A New York Times wedding announcement reports that the groom is “responsible for trying to get short-term-rental legislation favored by Airbnb passed in New York City” and the bride works for the New York City Department of Transportation and is “responsible for drafting legislation and advocating its passage in the City Council and the State legislature” (http://www.nytimes.com/2016/07/10/fashion/weddings/jenna-adams-andrew-kalloch.html). In the state legislature rated most similar to Congress in terms of professionalism, I find that legislators heavily utilize group expertise (Squire Reference Squire1992). If we expect that legislatures with fewer resources rely more heavily on group services, uptake of group bills in other states may be even more widespread (Hertel-Fernandez Reference Hertel-Fernandez2014). Nonlegislative drafting and advocacy for the passage of legislation is a pervasive and recognized occurrence on the state and federal level.
The California state legislature broadly defines the sponsor as the “legislator, private individual, or group who developed a piece of legislation and advocates its passage” (California State Legislature Glossary).Footnote 4 Whereas, the author is “a member of the legislature who introduces a legislative measure” (California State Legislature Glossary). California has disclosed this information since at least the 1940s (Anderson Reference Anderson1942). Beyond drafting the initial version of the bill, investigative journalists report that sponsors provide authors with talking points, memos, and testimony, and authors often allow the sponsor to “approve or reject bill changes during the committee process” (Meyers Reference Meyers2015).Footnote 5 This feature of the California state legislature allows me to explore the dynamics of group–legislator interactions on the bill level.
The implications that this tactic has for democracy are not clear-cut. Group sponsorship of bills may promote constituency service or responsiveness. Some argue that groups inform legislators about constituency concerns (e.g., Dahl Reference Dahl2005; Hansen Reference Hansen1991; Truman Reference Truman1960). By introducing solutions engineered by cities, counties, and constituents’ employers, legislators can efficiently respond to the needs of the citizens that they are charged to represent. However, allowing groups to become intimately involved in the legislative process may open the system to undue influence from unrepresentative forces (e.g., Schattschneider Reference Schattschneider1960). Corporations or industry groups sponsor some bills in an attempt to garner additional favors or special exceptions that profit the company. Consider S.B. 860, which Taser International sponsored and Senator Lou Correa introduced in 2008. This measure sought to amend the penal code to permit ownership of a very specific type of remote stun gun. Conveniently, Taser International’s product met the bill’s specifications, but their main competitor’s product fell slightly short. Opponents claimed that this bill would create a state-sponsored monopoly. This example illustrates the concern that groups may manipulate this system to insert narrow and self-interested claims into the law.
Even if group-sponsored bills are innocuous, we may remain concerned that this practice distorts the legislative process by altering legislators’ prioritization of issues. The ease of introducing a sponsored bill may lead legislators to consider a different distribution of bills than they would under a system with no sponsored bills. Combined with a constrained policy agenda, Cotton and Dellis (Reference Cotton and Dellis2016) argue that this agenda distortion “reduces social welfare” (Baumgartner and Jones Reference Baumgartner and Jones1993). As noted in Hirsch and Shotts (Reference Hirsch and Shotts2018), the Hall and Deardorff’s (Reference Hall and Deardorff2006) model of lobbyists providing “legislative subsidies” assumes that issues are chosen exogenously, thus groups do not influence the agenda ordering or composition. Rather than simply bringing bills to legislators already working on the issue or helping a legislator pass a bill championed by the legislator, groups may also convince legislators to consider an issue or bill that the legislator would not have conceived of absent the group’s request. Meyers (Reference Meyers2015) cites a legislative aide who credited sponsors for “bring[ing] the ‘idea’” to the legislative author. In more colorful terms, a former legislator decries the label of author since “the real author is the special interest group” and “the legislators are simply prostituting” (de Sa Reference de Sa 2010b). While these questions about the implications that group drafting has for democracy are difficult to answer, I take a first step by considering legislators’ utilization of group aid on specific legislation.
Related Literature
This work contributes to several different literatures. First, this paper addresses research on legislators’ sponsorship decisions and legislative effectiveness. Additionally, these data allow me to contribute to the empirical study of informational lobbying in the legislative arena. Scholars have studied the portfolio of bills that a legislator sponsors (Schiller Reference Schiller1995; Wawro Reference Wawro2001), the winnowing process (Krutz Reference Krutz2005), and legislative effectiveness (Anderson, Box-Steffensmeier, and Sinclair-Chapman Reference Anderson, Box-Steffensmeier and Sinclair-Chapman2003; Padró i and Snyder Reference Padró i Miquel and Snyder2006; Volden and Wiseman Reference Volden and Wiseman2014). Group bills comprise an important component of each of these legislative processes. Wawro (Reference Wawro2001) and Schiller (Reference Schiller1995) constrain legislative entrepreneurs to be the set of legislators. Group sponsorship challenges this scope limitation, in line with Mintrom’s (Reference Mintrom1997) critique. Indeed, I show that a discussion of legislative entrepreneurship, which is defined by Wawro (Reference Wawro2001) as “acquiring information, bill drafting, coalition building, and pushing legislation,” is incomplete without considering the role of nonlegislative actors. Descriptive statistics on the volume and range of topics covered by group sponsored bills suggest that groups play an intimate role in legislators’ construction of a portfolio of bills to introduce.
Moving to subsequent stages of the legislative process, scholars study a number of predictors of legislator effectiveness (e.g., majority party status, seniority, bills sponsored, and electoral security). The high passage rate of group sponsored bills relative to nongroup bills suggests that group backing and expertise on a bill greatly improve its chances of passage. An unexplored way for a legislator to be more effective (as measured by the number of laws the legislator gets past legislative hurdles) is to utilize group bills. In this paper, I show that utilization of group bills is a substantial “key to legislative success” (Anderson, Box-Steffensmeier, and Sinclair-Chapman Reference Anderson, Box-Steffensmeier and Sinclair-Chapman2003).
The interaction that I examine primarily occurs at the agenda-setting stage. Examining group influence before the roll call stage is important since earlier policy-making phases may be more susceptible to group influence (Baumgartner et al. Reference Baumgartner, Berry, Hojnacki, Kimball and Leech2009; Baumgartner and Leech Reference Baumgartner and Leech1998; Hall Reference Hall1996; Hall and Wayman Reference Hall and Wayman1990). Indeed, scholars recognize that legislators frequently work with interest groups to draft legislation (Hall Reference Hall1996). However, measuring the extent of this practice has been historically elusive. This paper provides bill-level information on group involvement in policy creation and promotion. Additionally, the connection between observable group activities and legislative outcomes is often tenuous. For example, the study of the relationship between PAC contributions and roll call voting black-boxes the connection between group activities and legislative outcomes. Multiple theories of motivations behind PAC donations exist; thus, the connection between donations and policy outcomes is murky. By comparison, the association between group provision of bills to legislators and group desire to influence policy outcomes is clear cut. By tracing group bills through the legislative process, I am able to test theories about group success on closely connected measures of group activity and legislative activity.
Theory
Legislators assume costs and accrue benefits when they introduce legislation (e.g., Schiller Reference Schiller1995). Group sponsorship of a bill alters this calculation. The costs and benefits associated with utilizing group legislation systematically influence the partnership patterns among groups and legislators. I assume that a legislator prefers to introduce bills that are closer to her ideal point than the status quo that the legislation seeks to replace. Legislators operate under constrained resources of time, staff, and information; these resources are essential to facilitating their basic goals of getting reelected, securing influence within the legislature, and enacting good public policy (Fenno Reference Fenno1978). Legislators’ quintessential goals can be promoted by authoring group-sponsored bills. In particular, authoring group bills provides legislators a low-cost way to facilitate the classic goal of enacting favorable public policy. However, implicit in partnering with a group, legislators lose some autonomy over the bill’s trajectory. This trade-off leads to differential use of group bills across legislators and bills based on the varying costliness of introducing legislation.
The benefits associated with introducing a bill may hinge upon the legislation’s fate (Woon Reference Woon2008). A legislator may extract position-taking or electoral benefits from merely introducing a bill (Loewen et al. Reference Loewen, Koop, Settle and Fowler2014; Mayhew Reference Mayhew1974; Rocca and Gordon Reference Rocca and Gordon2010). A legislator’s extraction of policy goals from bill introduction are conditional upon passage. Also, passing a bill gives a legislator a tangible accomplishment to show constituents (Fenno Reference Fenno1978). Legislators often publicize legislative victories on their websites, demonstrating what the legislator has done for the district lately. The passage of some bill that is important to a legislator’s constituency may aid in reelection or progressive ambition goals (Mayhew Reference Mayhew1991). Some argue that legislative effectiveness is positively related to campaign contributions (Box-Steffensmeier and Grant Reference Box-Steffensmeier and Grant1999). Additionally, passing legislation may help legislators gain intra-institutional power (Padró i and Snyder Reference Padró i Miquel and Snyder2006). A number of legislators’ classic goals may be facilitated by introducing bills that pass.
Legislator characteristics can make certain legislators more attractive partners for groups. The legislator who introduces the bill can aid the bill in getting through hurdles to passage and advocating for the bill (e.g., Volden and Wiseman Reference Volden and Wiseman2014). This paper focuses on the role that the presence of a group sponsor plays on bill passage, but the synergistic strategies between groups and legislators should be studied further. Moreover, there may be a tension between which legislators are attractive sponsors to groups and which legislators have higher demand for outside information. As I discuss below, new legislators may be especially in need of legislation to introduce since they are acclimating to the job of legislating and fully formed ideas in the form of bills can be a shortcut to productivity. However, legislators in positions of power or who have experience may be more appealing to groups in search of legislators who can work inside of the legislature to guide the bill to passage or at least keep the bill from being killed in committee. Data on the order that groups approach legislators to introduce their legislators would allow researchers to address the matching process between legislators and groups, and which legislators are especially good partners with groups. However, this information is not systematically reported, so the hypotheses revolve around which partnerships actually form.
Group sponsors can improve a bill’s probability of passage via several pathways. I outline a few here, but remain agnostic as to which are most important since the factors likely vary across group and bill. Group sponsors, especially specialized groups or expert agencies, may be able to draft legislation that maps the policy onto outcomes more closely than the legislator or legislative counsel’s office would be able to achieve. On the Congressional level, some complain that the bill text does not accomplish the desired goals because of staffers’ “sloppy drafting” (Nourse and Schacter Reference Nourse and Schacter2002, 595). Additionally, interviews of legislative staffers find that lobbyists are especially adept at drafting legislation that foresees “potential ambiguities or unforeseen results…because their clients would be the ones to pay a high price to litigate the language” (Shobe Reference Shobe2014, 848). This increase in “quality” can convince sympathetic legislators that voting for this bill will map onto the intended outcome. Similar to the logic in Lupia (Reference Lupia1994), a group sponsor listed on a bill analysis may provide a “shortcut” for legislators deciding whether to vote for the bill. Additionally, observers note that groups spend significant resources to hire “the best lawyers, pollsters and PR firms who carefully craft legislation to maximize success” (Meyers Reference Meyers2015). When sponsoring a bill, groups generally serve as “brokers,” gathering other groups to support and testify on behalf of the bill and using their legislative contacts to whip key votes (Heaney Reference Heaney2006). The presence of the group as a signal, the bill quality, and the activities taken by groups to push the bills they sponsor may boost the passage rates of group sponsored bills above those bills without a group sponsor.
Hypothesis 1. Sponsored bills are more likely to pass through both chambers and become law than nonsponsored bills.
Group sponsorship can reduce the costs to a legislator of introducing and guiding a bill although the legislative process (similar to the logic in Hall and Deardorff Reference Hall and Deardorff2006); however, a trade-off to partnering with a group complicates this interaction. Legislators face an essential trade-off when making the decision between using group information and engaging in legislative entrepreneurship tasks without outside aid. While extra-legislative help may provide substantial benefits by reducing the cost of introducing and pushing legislation, legislators may lose an element of control over the content of the legislation. Sometimes, the sponsored bill may align with the issue that the legislator wishes to address at that moment. Here, the cost to using a group bill accrues in the push-and-pull between legislator and group. The legislator may have to concede some specific language preferences in exchange for the sponsor’s services (assuming that the legislator cannot expropriate the effort exerted by the group (McCarty Reference McCarty2017). For other sponsored bills, the bill may not be on the topic that the legislator most wants to be associated with, but the legislator feels some obligation to the group to author the bill. Potential reputational or electoral costs could accrue if the legislator partners with controversial groups. If the legislator sponsors a bill on her own, the costs traditionally associated with bill sponsorship include generating an idea, drafting the legislation, gathering information relevant to the text, finding a range of individuals to testify on behalf of the bill, and gathering support for the bill. As noted above, group sponsors help on some or all of these legislative tasks, thus reducing the cost of introducing a bill for the legislator. As I detail below, the costs are higher for introducing bills on substantive issues and for relatively inexperienced legislators. These higher costs attenuate the trade-off and increase the probability that sponsored bills will be observed.
The “cost” of generating independent legislation is higher for inexperienced legislators. When interviewed, “a few new members confessed that in their first year, over 90% of their bills were drafted or given to them by lobbyists” (Cain and Kousser Reference Cain and Kousser2004). First-term legislators must adjust to the realities of legislative life, leading an office, studying legislative procedures, and even learning “how to collect the mail” (de Sa Reference de Sa 2010a). While legislators remain busy throughout their tenure, they learn from doing in the first term (e.g., Fiorina Reference Fiorina1977; Mayhew Reference Mayhew1974). Subsequently, a legislator’s cost of introducing independent legislation is higher in the first term compared to later terms. Given these higher costs of legislating, all else equal, newer legislators will use more sponsored bills and substitute out of sponsored bills and into independent legislation in their later terms. The trade-off between reduced workload, increased passage, and reduced control for partnering with a group sponsor on a bill may be most costly for legislators with more experience. In other words, first-term legislators have a higher cost to writing and pushing their own legislation which may exceed the benefit of getting a bill at exactly their own ideal point.
Hypothesis 2. Legislators with fewer terms of service will use more group bills.
Data, Methods, and Results
In the following sections, I present the data and methods used to analyze the differential passage rates of group sponsored bills and nongroup sponsored bills, and legislators’ uptake of these types of bills over their legislative life-cycle. The outcomes are (1) bill success and (2) legislator authorship and passage of bills, especially of group-sponsored bills. First, I present the bill-level data and results, and then the legislator-level. In the bill-level section, I use matching to compare the passage rates of sponsored versus nonsponsored bills, finding that sponsored bills are more likely to pass. For the legislator-level analyses of legislator use of group bills, I present results from ordinary least squares (OLS) regressions with legislator fixed effects.
Bill Level Data
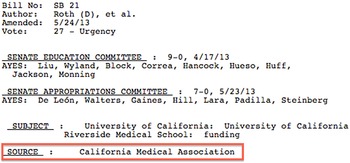
For the bill-level analyses, the main outcome variables are dichotomous measures for bill i’s fate. I record bill i’s passage in the Assembly, the Senate, both houses, and final enactment. To gauge the relative success of group-sponsored bills versus nongroup-sponsored bills, the bill dataset has information for every bill introduced within the California Senate and Assembly from 1993 to 2014. In these analyses, the main variable of interest is group sponsorship of the bill. This variable is dichotomous, with a value of 1 indicating that the bill is listed as being sponsored by one or more groups. Group sponsorship data come from bill analyses.Footnote 6 In the California state legislature, the Office of Research analyzes all bills under consideration and compiles bill analyses. Committees also compile an analysis for every bill considered. These analyses are several pages long, and contain background information, fiscal and legal implications, suggestions for improvement, listings of entities that support and oppose along with their rational, and the bill’s sponsor. Sometimes the sponsor is listed clearly at the top of the bill analysis, as the SOURCE or SPONSOR (see Figure 1). Other times, this information is denoted in parentheses by the group’s name in the list of groups that support the bill. The text of the analysis frequently includes a sentence about the sponsor along with statements from the sponsor. Using basic text analysis tools (e.g., grep), I search each bill analysis for the source or sponsor. Bill analyses for sessions from 1993 to present are available online. Supplementary Appendix provides more information on the identification of group bills, evidence to demonstrate the strong norm of including the sponsor, and robustness checks on the results to the classification of group bills.
Example of a bill analysis. Here the sponsor of the bill is indicated by SOURCE.

To detect and control for differences between sponsored and nonsponsored bills, I collect a set of descriptive variables on the bills. The Bill Length variable counts the number of words in the introduced version of a bill. This variable provides a rough measure of bill complexity or sophistication (Huber and Shipan Reference Huber and Shipan2002; Kousser Reference Kousser2006). The Consent Calendar designation provides a measure of the controversy surrounding the bill. Consent calendar bills “(1) have received no ‘no’ votes in committee and (2) have had no opposition expressed by any person present at the hearing” (California Legislature Glossary). Tucker (Reference Tucker1989) argues that a “consent calendar” tag indicates that the bills are considered minor by state legislators. The California state legislature classifies bills into several categories. Local bills are those that affect one or more specific localities. Urgency bills are deemed to affect “the public peace, health, or safety and requir[e] a two-thirds vote for passage” (California Legislature Glossary). Resolutions are used to state chamber politics or convey the chamber’s views on topics. These variables come from OpenStates (for the 2009–2014 bills) and bill histories (for the 1993–2008 bills). Local bills, Urgency bills, and Resolutions are coded as dichotomous measures.
In Supplementary Appendix A5, I include additional variables that may matter for passage. I include topic fixed effects to account for the possibility that bills on some topics may have a higher propensity to pass, and compare bills within topic areas. On the federal level, scholars find that a variety of bill author characteristics affect bill passage (Anderson, Box-Steffensmeier, and Sinclair-Chapman Reference Anderson, Box-Steffensmeier and Sinclair-Chapman2003; Krutz Reference Krutz2005; Woon Reference Woon2008). Thus, some models include the terms of service served in either chamber by bill i’s author and the absolute distance between the legislator’s ideology and the chamber median (Distance from Median).
The entities that sponsor bills vary drastically. A substantial portion of the sponsors are state-level agencies or municipal entities or agencies. Of the 6,017 unique sponsors present in the data, 3.49% are classified as a state-level agency and 21.72% as a municipality, county, or municipal/county entity. I classify the sponsoring groups according to whether or not they are (1) a state-level agency or a local entity or (2) neither a state-level agency nor a local entity. To classify agencies, I first identify if the sponsor’s name appears on this list of current governmental agencies: http://www.ca.gov/agenciesall. However, this step does not completely capture all agencies. Since the data extend from 1993 to 2014, some of the agencies may be defunct, for example the “California Department of Financial Institutions,” and thus not included on the list. Programs within departments do not appear in this list, for example “Small Business and Disabled Veteran Business Enterprise Certification Program.” In order to include these instances, I go through the list of unique sponsors and identify those that should be classified as a state-level agency. I classify municipal or local entities by the presence of phrases in the sponsor’s name such as “City of,” “County of,” and “Irrigation District.” A wide range of these municipal entities are listed as sponsors, from large cities and counties to the San Diego Coastkeeper. There are instances where the absence of common phrases to identify these entities does not accurately capture all cases of local entity sponsorship. Thus, I also go through the list of the unique sponsors to identify additional municipal or local entities. The sponsors are not listed in a uniform manner on the bill analyses and the lack of complete lists of municipal entities or state-level agencies necessitates this additional step. I leave group-level analysis and further classification of these groups for future work.
Bill Level Analysis
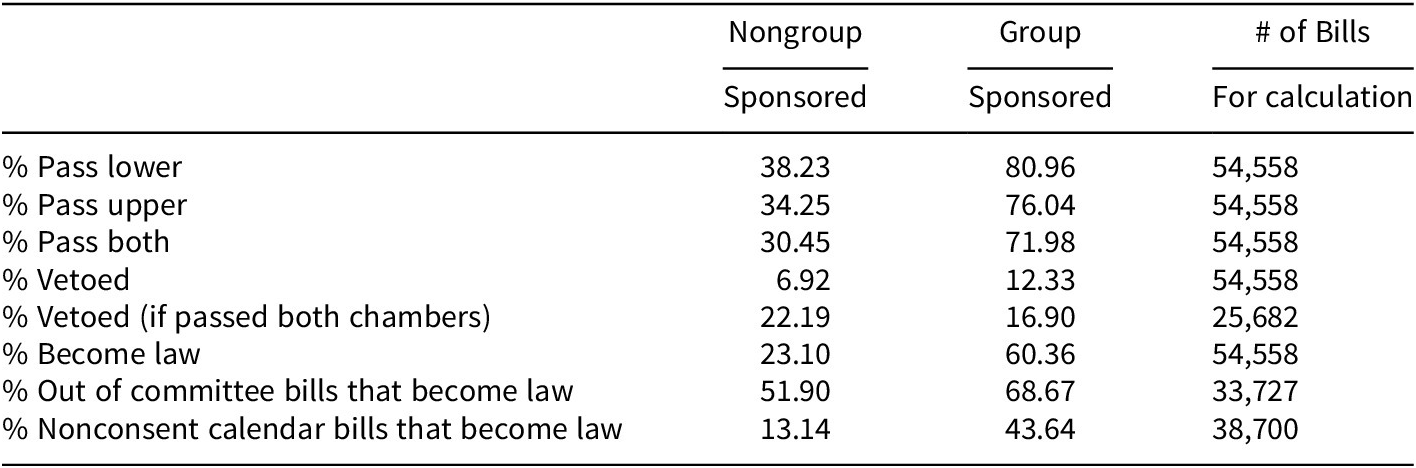
Over the 11 sessions of data, 40% of (nonresolution) bills introduced in the California state legislature have a group sponsor listed.Footnote 7 Several differences are noticeable. Group sponsored bills have a slightly higher mean number of cosponsors listed compared to nongroup sponsored bills. On average, group sponsored bills have slightly more amendments added throughout the legislative process than the nongroup bills. A higher percentage of nongroup bills are resolutions, compared to the percentage of group sponsored bills that fall under this classification. Group sponsored bills are, on average, longer than nongroup sponsored bills. The most pronounced and interesting difference between group sponsored and nongroup bills is the differential passage rate, on display in Table 1 which exclude resolutions. In this paper, I refer to bills that become law as “chaptered” bills since that is the terminology used by the California state legislature. Sixty percent of bills with a group sponsor become law, compared to 23% of bills without a group sponsor. This 37 percentage point gap in passage rate indicates that the presence of a group sponsor is essential to understanding bill passage in the California state legislature. Among the subset of bills that make it out of committee, there is still a 17 percentage point difference in the passage rates between unsponsored and sponsored bills. The gap in passage rates between nongroup and group bill passage narrows when examining legislation that makes it past a primary winnowing stage, indicating that group sponsors play an important role in the committee stage of bill consideration. Limiting the pool of bills to those that do not go on the consent calendar, the indication of bill importance or controversy, there is a vast difference in the passage rate between sponsored and unsponsored bills. Among nonconsent calendar bills, only 13% of nongroup sponsored bills become law compared to 44% of group sponsored bills. Even under the strictest examination of the difference in passage rates, the striking separation in the fate of group versus nongroup bills remains.
Descriptive statistics on nongroup sponsored bills passage rates compared to group sponsored bills.

To briefly examine the differences across sponsor type on the bill level, I break the descriptive analysis into bills that are not sponsored at all, bills that are solely sponsored by a municipal organization or a state-level agency, and bills that are sponsored by at least one nonmunicipal and nonagency sponsor. Table 2 presents these results. Bills sponsored by only an agency or local entity comprise 14% of all bills introduced into the California state legislature, and bills sponsored by nonagency/nonlocal entity form 26% of bill introductions. This table shows that bills sponsored by only a local entity or state agency pass at the highest rate, 68% of these bills become law. However, those bills sponsored by at least one nonmunicipal and nonagency sponsor still pass at a much higher rate than bills without any sponsor, 56% of these sponsored bills become law compared to 23% of nonsponsored bills. Recent work finds that cities are active and effective participants in the federal and state level legislative process (Goldstein and You Reference Goldstein and You2017; Payson Reference Payson2016). Executive branch involvement in the legislative process is receiving increasing scholarly attention (Bradley Reference Bradley2014; Bradley and Haselswerdt Reference Bradley and Haselswerdt2016; Mills and Selin Reference Mills and Selin2017; Walker Reference Walker2017). Descriptively, I find that cities and agencies are successful advocates in the California state legislature’s sponsorship process. Supplementary Appendix further explores the relationship between the entity type and bill passage and conducts the matching analysis separately for the different types. Separately examining the trajectories of bills sponsored by municipal or bureaucratic entities versus other organizations may reveal the role of information provision without the complicating consideration of campaign contributions.
Descriptive statistics on bill introduction and chaptering.

Note: The bills are categorized by the type of sponsor. The first column presents results for nonsponsored bills. The second column presents the results for bills sponsored by only state agencies or local entities. The third column presents the results for bills that have at least one nonagency/nonlocal sponsor. The first row shows the composition of introduced bills across these three categories. The second row shows the passage rate per category.
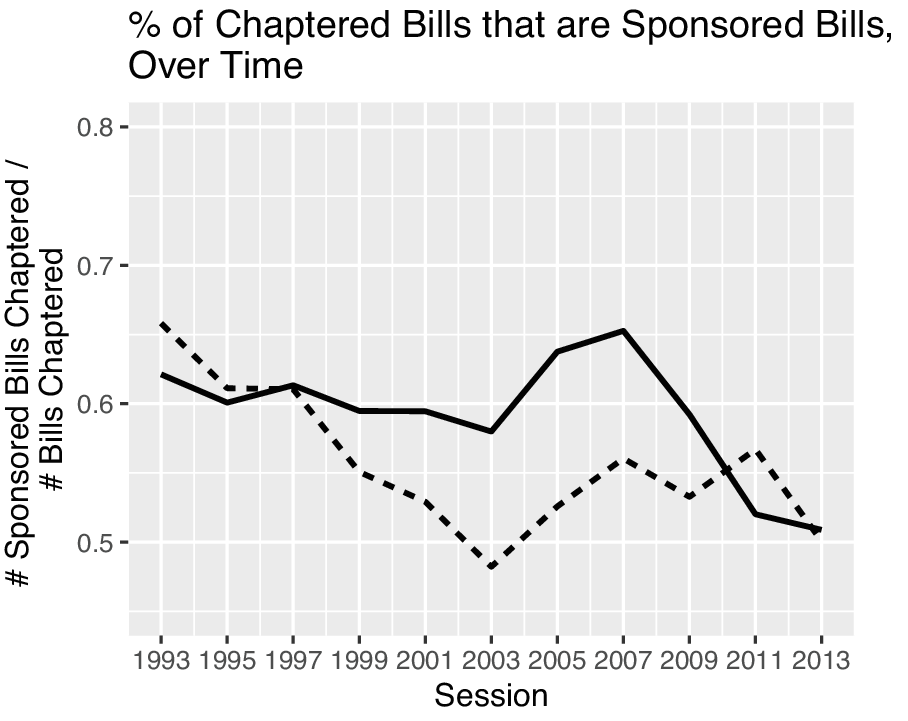
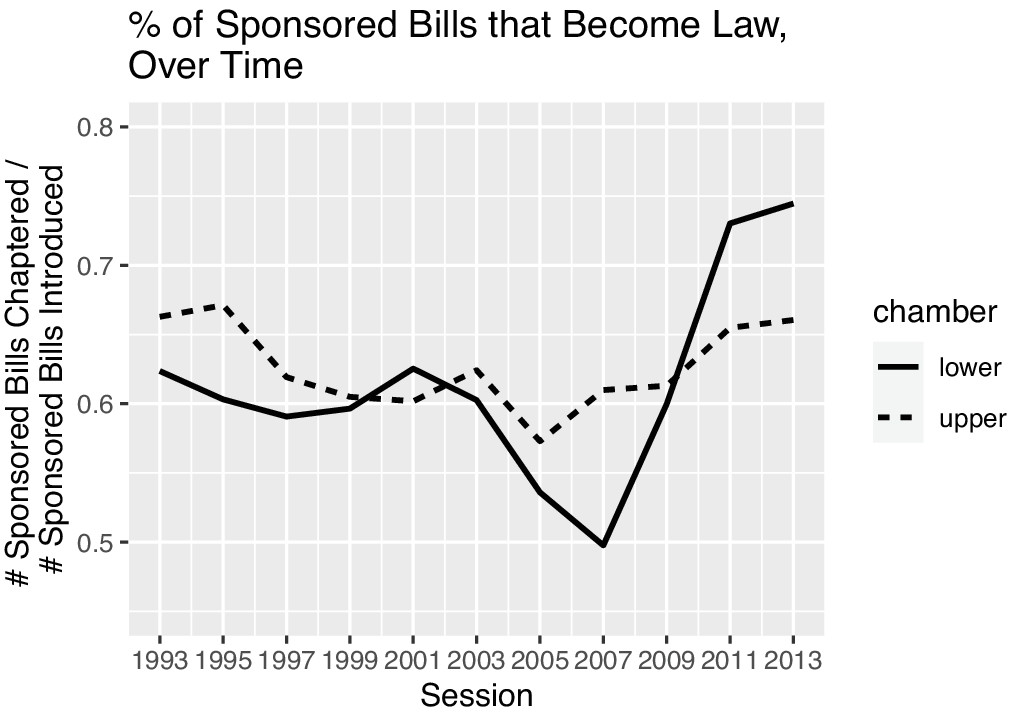
The volume of sponsored bills as a fraction of chaptered bills varies across time and chamber. Figure 2 plots the percentage of chaptered bills that are sponsored bills for each session from 1993 to 2014 by chamber (resolutions are included in these plots). Figure 2 displays that a slightly higher percentage of chaptered bills are sponsored bills in the lower chamber compared to the Senate. Figure 3 displays the percentage of sponsored bills that become law. In the Senate, the success of sponsored bills has increased over time. While 48% of sponsored Senate bills became law in the 2005–2006 session, 61% of sponsored bills in the Senate became law in the 1995–1996 session. These figures show that sponsored bills have enjoyed great success in the California state legislature over time.
Plot of the percentage of chaptered bills that are sponsored bills, per session and chamber, from 1993 to 2014.

Plot of the percentage of sponsored bills that are chaptered, per session and chamber, from 1993 to 2014.

Estimating the Effect of Group Sponsorship on Passage
To estimate the effect of group sponsorship on passage, I first run a series of logistic regressions and then present results from a matching analysis. Shown in the Supplementary Appendix, the logistic regressions of bill passage on group sponsorship include a set of control variables potentially relevant to bill passage. These logistic regressions show that group sponsorship is a statistically and substantively significant predictor of passage through committee, lower and upper chambers, and chaptering. The strong relationship between group sponsorship and passage remains after including a host of controls. Group sponsorship remains a statistically and substantively significant predictor of bill passage through committee, the lower chamber, and the upper chamber, after controlling for the author’s years of service, the author’s ideological distance from the chamber median and including fixed effects for the bill’s committee of origin. I also control for the amount of outside support or opposition garnered on the bill as a test of whether lobbying by other groups explains the differential passage rate between sponsored and nonsponsored bills. This analysis is especially important to the argument that sponsorship goes above and beyond lobbying support or opposition. Controlling for a host of factors related to the passage prospects of legislation does not reduce the substantive significance of group sponsorship.
The descriptive statistics and logistic regressions indicate that sponsored bills pass at a much higher rate compared to those without a sponsor. However, group sponsorship is not randomly assigned among bills. Indeed group and nongroup bills are likely to differ in ways that are correlated with both group sponsorship and the probability of passage. To deal with these confounders, I turn to matching. Specifically, I use the Matching package to conduct one-to-one genetic matching on the 2009–2014 Assembly bill data (Diamond and Sekhon Reference Diamond and Sekhon2013; Henderson and Chatfield Reference Henderson and Chatfield2011; Sekhon Reference Sekhon2011).
In the matching analysis, the dependent variable is whether or not the bill becomes law.
 $ {Y}_i(0) $
and
 $ {Y}_i(1) $
are dichotomous indicators of bill i’s passage with and without a group sponsor, the potential outcomes. The treatment is whether or not a group sponsors the bill.
 $ {T}_i $
represents the binary treatment indicator which takes a value of 1 if bill i is sponsored by a group and 0 if the bill does not have a group sponsor. The covariates are a set of bill characteristics, specifically whether the bill was a resolution, a local bill, an urgency bill, the number of cosponsors listed on the bill, and the bill’s length.
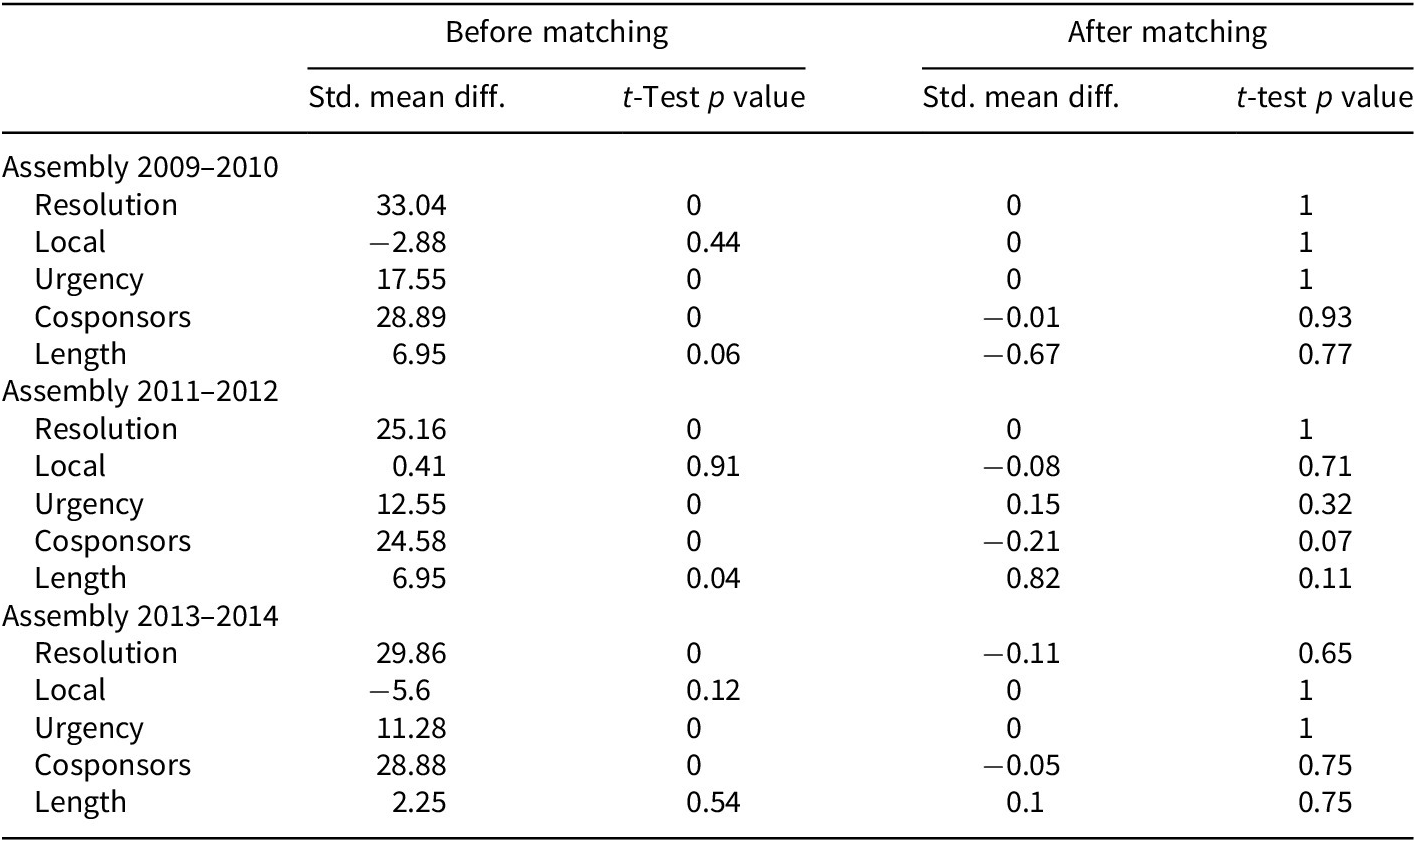
Table 3 reports the pre- and postmatching balance statistics (standardized mean differences and the p value for a t-test that the covariate mean is the same between sponsored and unsponsored bills). Lower mean differences and larger p values indicate better balance. For example, positive mean differences indicate that sponsored bills have a higher incidence of the dichotomous variables or are longer. Before matching, there are significant differences between sponsored and unsponsored bills. Relevant for the theory, sponsored bills are longer in every session. Through matching, very good balance on the covariates is obtained.
Standardized bias statistics before and after matching, for the ATE.

Note: Matching balance results are from one-to-one genetic matching.
Table 4 displays estimates from a linear probability model and matching analyses.Footnote 8 The controls used are those reported in Table 3. The first column reports the results from a linear probability model of bill passage on sponsorship with the covariates. The second and third columns show the average treatment effect and the average treatment effect for the treated, and Abadie and Imbens standard errors. The results of the linear probability model and the matching estimates are very similar. These results show that there is a statistically and substantively significant impact of group sponsorship on bill passage.
The standard errors in the matching analyses are Abadie-Imbens.

ATE, average treatment effect; ATT, average treatment effect for the treated.
While the balance on covariates between sponsored and unsponsored bills improves drastically after matching, the results may be misleading if unobserved covariates remain after matching. I conduct a Rosenbaum bounds test to evaluate the sensitivity of the matching estimate to unobservable differences between sponsored bill and unsponsored bills (Rosenbaum Reference Rosenbaum2002). Group bills and nongroup bills may be different in unobserved or unmeasured covariates. In this setting, hidden bias is the extent to which sponsored bills would have to be more likely to pass compared to unsponsored bills to bias the matching analysis estimates. Perhaps group bills differ from unsponsored bills in intrinsic quality, which is unmeasured. The Rosenbaum bounds test how large this hidden bias would have to be before altering the substantive interpretation of the matching estimate. The researcher changes the sensitivity parameter,
 $ \Gamma $
, which represents the log odds of receiving treatment. The Rosenbaum bounds indicate that the results become insignificant when
 $ \Gamma >1.9 $
,
 $ \Gamma >2.5 $
, and
 $ \Gamma >2.7 $
for the 2009–2010, 2011–2012, and 2013–2014 Assembly data, respectively.Footnote
9 These parameters indicate that for the 2009–2010 Assembly, one of the observations in a matched pair of bills could be 1.9 times as likely to have received treatment without eliminating the observed estimate of treatment. An unobserved confounder would have to affect the odds of assignment to sponsored or unsponsored bill category by 90% to reverse the conclusion that the sponsorship effect is statistically different from zero. These
 $ \Gamma $
values are quite robust (Keele Reference Keele2010). This sensitivity analysis provides confidence that the matching estimates are robust to hidden confounders and are reasonable estimates of the effect of group sponsorship on bill passage.
Additionally, Supplementary Appendix A5 demonstrates that the results hold when including a host of additional covariates that may be related to bill passage. Importantly, a set of logistic regressions of bill passage highlight that the positive and statistically significant relationship between group sponsorship and bill passage holds after including committee fixed effects.
Legislator Level Data
In the legislator component of the study, the unit of analysis is at the legislator-session level. This paper seeks to examine why legislators use group-sponsored bills. In order to estimate the connection between legislative experience and utilization of group-sponsored bills, the main variable of interest is legislators’ terms of service. Using lobbyist ratings of legislator effectiveness, Padró i and Snyder (Reference Padró i Miquel and Snyder2006) find that ratings of effectiveness increase “sharply with tenure.” I expect that less experienced legislators use more group bills compared to their longer-termed counterparts because they (1) have a difficult time crafting bills without the assistance of lobbyists and groups because of their lack of experience with the circuitous legislative process, (2) they would like to author bills that pass, and (3) group legislation is more likely to pass than nongroup sponsored legislation. Variables about the legislator’s pre- and post-term limits tenure are generated from Klarner et al. (Reference Klarner, Berry, Carsey, Jewell, Niemi, Powell and Snyder2013) and OpenStates. Specifically, term indicates the term number being served by legislator i in session t. I limit the set of legislators to be those who are elected after the introduction of term limits (eliminating those legislators who served more than three terms in the Assembly because of being grandfathered in before the advent of term limits).
Additional legislator-level variables gauge the legislators’ power within the legislative body and their legislative fortunes. These variables come from Fouirnaies (Reference Fouirnaies2017). Specifically, Chair captures whether the legislator served as a committee chair in that session (Fouirnaies Reference Fouirnaies2017). Leadership is another indictor variable for if the legislator held a party leadership role in that session (Fouirnaies Reference Fouirnaies2017). Finally, the electoral variable, Vote Share, measures the percent of votes cast in favor of that legislator in their previous election (Fouirnaies Reference Fouirnaies2017; Klarner et al. Reference Klarner, Berry, Carsey, Jewell, Niemi, Powell and Snyder2013).
To measure legislative effectiveness and group input, first, I follow the work of Wawro (Reference Wawro2001) and Schiller (Reference Schiller1995) in using the number of bills that a legislator sponsors in a session as a measure of activity. To calculate the number of bills that a legislator authored in a given session, I turn to OpenStates (for the 2009–2014 legislators), legislative bill histories, and Lewis’s database of bill descriptions (Lewis Reference Lewisn.d.; OpenStates 2016). Per session, I sum the number of group and nongroup bills authored by each legislator. To measure legislators’ relative success in getting the bills that they introduce passed, I also calculate the number of a legislator’s group and nongroup bills that become law in a particular session (# Group Bills Become Law and # Nongroup Bills Become Law).
Legislator Level Analysis
Using the legislator-level data, I test predictions about the portion of a legislator’s agenda comprised of group bills and legislator characteristics. On average, legislators see a much higher percentage of their group-sponsored bills become law compared to the passage rates of their nonsponsored bills. This clear separation in passage rates between group-sponsored and legislators’ independent bills indicates a possible rationale for legislator’s utilization of group-sponsored bills. When legislators wish to appear successful and pass legislation, using group-drafted bills may help further this goal.
Estimating the Effect of Legislative Experience on Group Bill Use
I examine the relationship between the number of terms that a legislator has served and the use of group bills, authorship of nongroup bills, and success in getting each of these types of bills passed. These analyses are conducted on the 1993–2014 Assembly legislator data.Footnote 10 Additional specifications control for factors that may alter the supply of group bills to legislators and legislators’ propensity to introduce and secure the passage of group bills (such as electoral considerations and leadership roles). Since the results are largely unaltered, I present the parsimonious results in the main text.
To control for legislators’ initial differential predilections for looking to groups, I include legislator fixed effects (Ansolabehere and Snyder Reference Ansolabehere, De Figueiredo and Snyder2003). Adding legislator fixed effects is important because of the unobservable differences across legislators, which I assume remain constant over time, such as prior legislative experience and preexisting connections with groups. Compare Assembly member Mike Gatto to the Calderon brothers. Gatto authors few group bills and expresses concern for the “special-interest groups [that] draft legislation.”Footnote 11 Whereas the Calderon family has been entrenched in California legislative politics for years and enjoy dense networks of interest groups connections.Footnote 12 Fixed effects control for these legislator-level differences. I use seemingly unrelated regressions for these analyses to account for likely correlation in the errors across the models of group bill and nongroup bill introduction (Zellner Reference Zellner1962). I analyze Democrat and Republican legislators separately since the California state legislature has been controlled by Democrats for all but one year included in these data.Footnote 13 Membership in the majority party is likely to influence both the supply of group bills and the ability of Republican legislators to introduce and pass their bills.
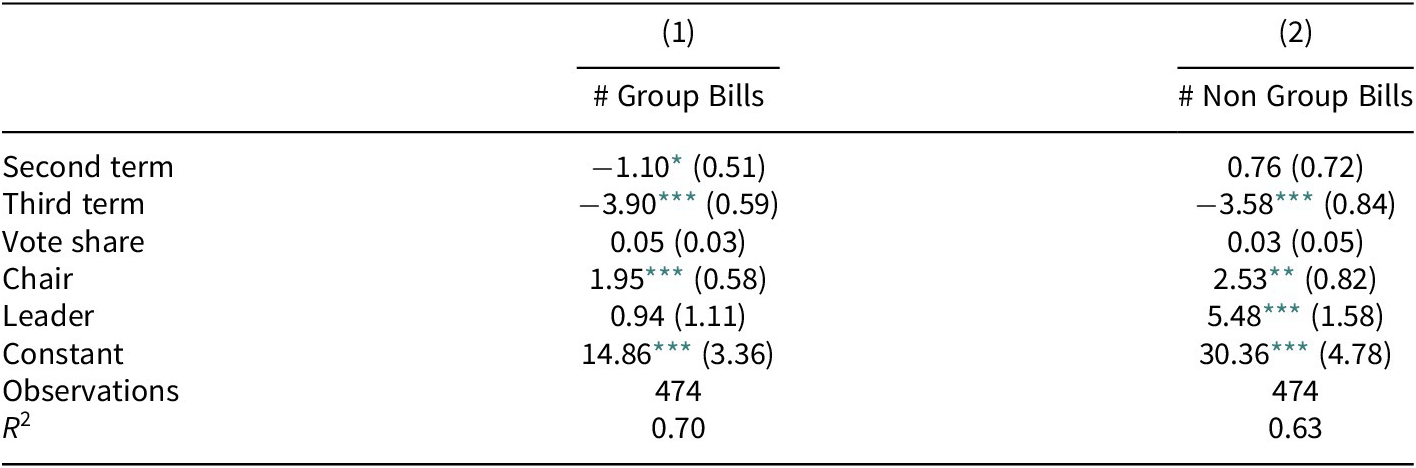
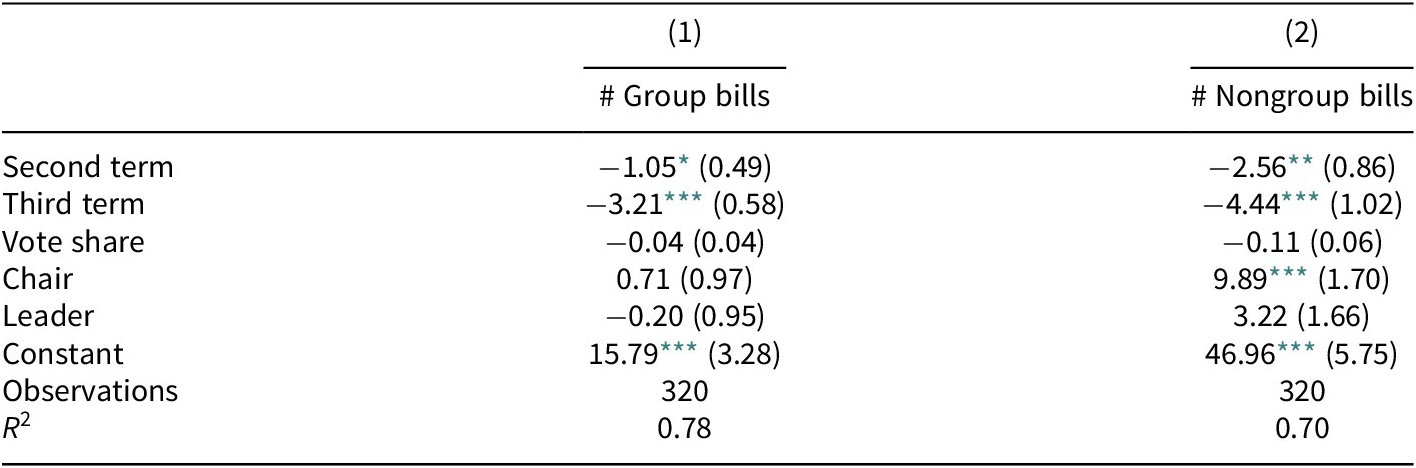
Table 5 shows the results from the seemingly unrelated regressions of sponsorship with legislator fixed effects among Democratic Assembly members. The dependent variables in these models are (1) the number of group bills that the legislator authors (# Group Bills) and (2) the number of nongroup bills that the legislator authors (# Nongroup Bills). I find that compared to their first term, legislators in their second and third terms use fewer group bills. Turning focus to nongroup bill introductions, compared to their first term, legislators in their second term introduce more nongroup bills and in their third term introduce fewer nongroup bills. This finding indicates that legislators adjust their relative use of group and independent bills as they gain more experience. Additionally, there is a term-out effect where legislators introduce fewer bills overall in the third term. Moreover, when legislators become committee chairs they introduce more group bills. This finding indicates that these legislators may be attractive partners for groups seeking to pass their preferred legislation. Table 6 reports the same set of regressions for Republican Assembly members. The direction of the tenure coefficients on the regressions modeling # Group Bills are also negative.
Assembly Democrats Regressions: Seemingly unrelated regression coefficients regressions of number of group sponsored bills authored by legislator i and number of nongroup bills authored by legislator i on the number of terms in the Assembly.

Note: Legislator fixed effects included for all models. Standard errors in parentheses.
* p < 0.05.
** p < 0.01.
*** p < 0.001.
Assembly Republicans Regressions: Seemingly unrelated regression coefficients regressions of number of group sponsored bills authored by legislator i and number of nongroup bills authored by legislator i on the number of terms in the Assembly.

Note: Legislator fixed effects included for all models. Standard errors in parentheses.
* p < 0.05.
** p < 0.01.
*** p < 0.001.
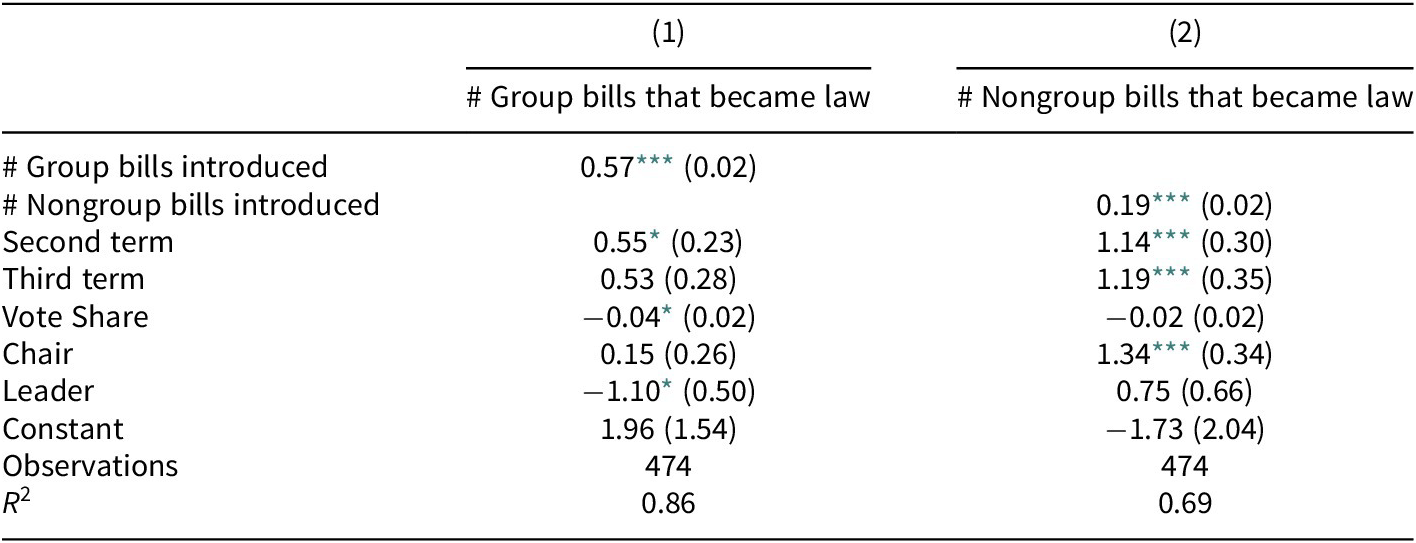
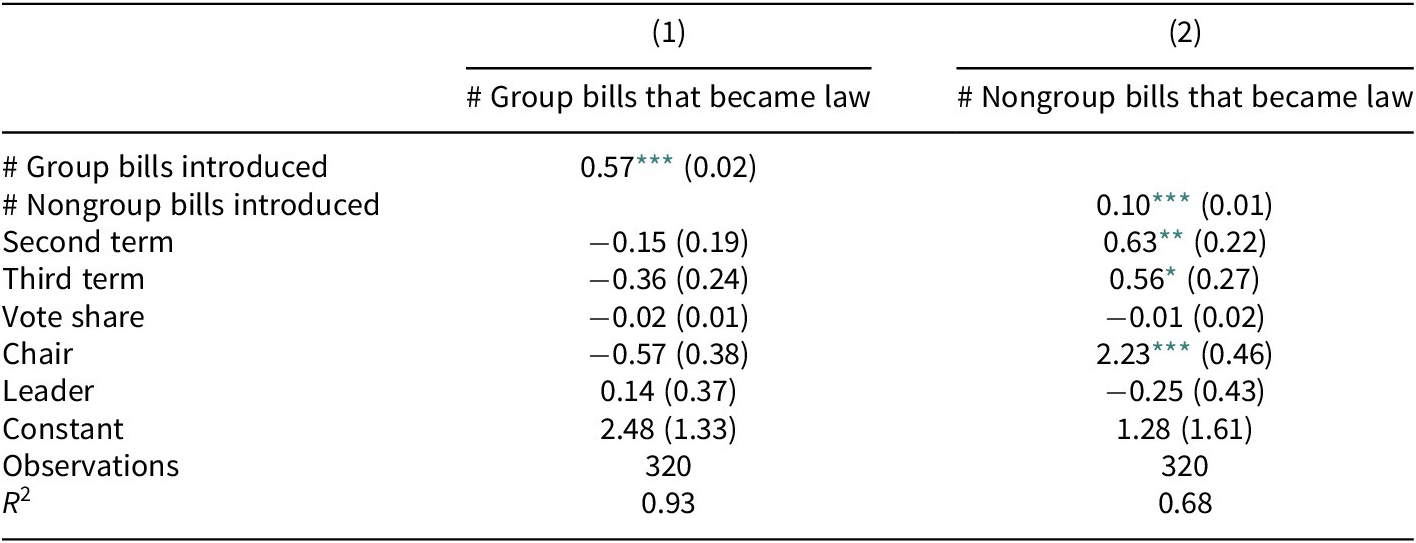
To assess the relationship between terms of legislative service and legislator’s success in the legislative arena, I conduct another series of seemingly unrelated regressions with legislator fixed effects. These results are presented in Table 7, the dependent variables are (1) the number of group bills authored by legislator i that became law in session t (# Group Bills Became Law) and (2) the number of nongroup bills authored by legislator i that became law in session t (# Nongroup Bills Become Law). The models include variables for either the number of group bills introduced or the number of nongroup bills introduced to control for the legislator’s overall activity in the session. Looking at Model 1, compared to their first term, legislators in their second term have slightly more success and see a higher number of group bills become law. Compare these regressions to the substantively and statistically significant coefficients on the term variables in Model 2. Compared to first term legislators, second and third term legislators are more successful at getting nongroup bills passed into law. These findings suggest that legislators are more adept at choosing group bills that will become law when they agree to partner with the groups or they are more successful at guiding group bills into law with experience. Table 8 presents the same models for Republican members of the Assembly. While Republicans’ success in getting group bills passed does not seem to vary with legislative experience, Republicans are more successful at getting nongroup bills passed in their second and third term in office.
Assembly Democrats Regressions: Seemingly unrelated regression coefficients regressions of number of group sponsored bills authored by legislator i that pass and number of nongroup bills authored by legislator i that pass on the number of terms in the Assembly.

Note: Legislator fixed effects included for all models. Standard errors in parentheses.
* p < 0.05.
** p < 0.01.
*** p < 0.001.
Assembly Republicans Regressions: Seemingly unrelated regression coefficients regressions of number of group sponsored bills authored by legislator i that pass and number of nongroup bills authored by legislator i that pass on the number of terms in the Assembly.

Note: Legislator fixed effects included for all models. Standard errors in parentheses.
* p < 0.05.
** p < 0.01.
*** p < 0.001.
Discussion
The most striking findings in this paper are the sheer volume of extra-legislative involvement in the legislative process and the differential passage rates between group-sponsored and nongroup sponsored bills. Legislators rely more heavily on group bills in their first term and substitute out of group bills in later terms. The decrease in reliance on groups over a legislative life cycle suggests that a learning process occurs and alters the relationship between groups and legislators.
While this study capitalizes on a unique reporting tradition in a single state, the results suggest that groups contribute extensively to the body of law within states. Legislators in California are not unique in their reliance on groups for technical information. California state politics are important in their own right given the cover and size of the state in terms of population and budget (Masunaga Reference Masunaga2015).
The influence that term limits have on interactions between legislators and lobbyists is of interest to scholars and observers of state government. While I do not have data on the preterm limits years, these results suggest that less experienced legislators indeed rely more on interest group information. Compared to their first term, legislators in later terms use less group sponsored legislation and are more successful in getting their nongroup bills enacted into law. With term limits, there are more first term legislators in the body and thus more legislators who turn to groups as a source of expertise. The findings about the relationship between tenure and reliance on group bills lends support to 1990 predictions that term limits would increase the legislators’ reliance on interest groups. The legislator-level results presented here, contradict proponents of term limits who argue that new legislators show up trying to accomplish good public policy with many new ideas, and become corrupted over time by entrenchment in the legislative culture. Instead, I find that experience matters for reliance on group legislation.
This paper focuses on the success of group bills and legislative utilization of these bills. The other side of the story would examine the characteristics of the groups that take this action. A number of interesting questions about the characteristics of the groups that draft bills for legislatures remains. Are these organizations well-funded? We may suspect that flush organization may be more able to hire skilled attorneys to draft high-quality legislation, compared to their less well-funded counterparts. Do sponsoring organizations donate money to the candidates who later introduce the group’s bills? Responding to these questions regarding the role of resources could contribute to the interest in the differential representation of groups in American institutions (Gilens and Page Reference Gilens and Page2014; Schlozman, Verba, and Brady Reference Schlozman, Verba and Brady2012). Combining the group sponsorship information with data on the funding levels or campaign contributions remains for a future paper. These questions are important for the social welfare implications of this group activity.
Bill passage and legislator productivity are importantly related to group sponsorship and suggest legislator motivations for using this tactic. Examining the patterns of group bills utilization allows me to carefully explore group involvement in the legislative process. Mapping the involvement of nonlegislator entities in the legislative process is important for understanding the system of laws that influence citizens. A democratic defect may arise if those who were elected must substantially rely on groups to craft high-quality bills that address the concerns of citizens in a timely manner.
Supplementary Materials
To view supplementary material for this article, please visit http://doi.org/10.1017/spq.2021.36.
Data Availability Statement
Replication materials are available on SPPQ Dataverse at https://doi.org/10.15139/S3/ZYSJBH (Kroeger Reference Kroeger2021).
Acknowledgments
For helpful discussions and feedback, I thank Justin Kirkland, Hye Young You, Thad Kousser, Nolan McCarty, Dara Strolovitch, Chuck Cameron, Brandice Canes-Wrone, Molly Ritchie, Lauren Mattioli, and Alex Bolton; and seminar participants at APSA 2016, SPPC 2016, and MPSA 2016.
Funding Statement
The authors received no financial support for the research, authorship, and/or publication of this article.
Conflict of Interest
The authors declared no potential conflicts of interest with respect to the research, authorship, and/or publication of this article.
Author Biography
Mary Kroeger is an Assistant Professor of Political Science at the University of North Carolina at Chapel Hill. She received her PhD in Politics and Social Policy from Princeton University, and holds a BA from the University of North Carolina at Chapel Hill. Her research interests are in US state politics, American political institutions, bureaucratic-legislative interactions, policy diffusion, and quantitative methods.