


Theoretical investigations of ice sheets usually reduce to calculations of the velocity field and temperature using data on the relief of the surface and bed taking into account the horizontal distribution of accumulation, ablation, surface temperature, and geothermal heat flux (see, e.g. Reference BuddBudd, 1969; Reference BuddBudd and others, [1970]). A disadvantage of this prediction approach is that it does not allow simulation of the mechanism of production of the ice sheet and its evolution. In this paper we consider a more complete model of a large flat ice sheet in which the surface relief is an unknown function.
We consider for simplicity an axisymmetric stationary ice sheet which spreads over a flat bed of radius R. We assign an ice accumulation which is a function a(r) of radius r on the surface of the glacier, which is the difference between precipitation and melting. It follows from the condition of stationarity that in an infinitely small radius in the vicinity of r = R there occurs a sink of excess mass whose value is defined by the difference between the integral mass influx and melting at the ice-sheet surface. It is assumed that this is realized by the production of icebergs. A geothermal heat flux is assigned at the lower boundary of the glacier. It is necessary to define the surface relief and distribution of the velocity and temperature in the ice. This formulation of the problem allows us to investigate the evolution of an ice sheet at time intervals much larger than the characteristic relaxation time of the stationary regime. This may be useful, for example, in studying the evolution of Antarctic glaciation during the last 80 million years when there occurred significant variations in air temperature and precipitation caused by the drift of continents and changes in the oceanic circulation of the Southern Hemisphere.
The theoretical model is based on the continuity equation

the equation of mass conservation at the upper boundary
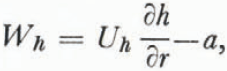
and the equation of heat conduction

In Equations (1)–(3), z is the vertical and r the horizontal coordinate (the origin of the coordinates is placed in the centre of the glacier base), U and W are the horizontal and vertical velocity components, Uh, Wh are their values at the surface z = h, k, ρ, and c are the thermal conductivity, density, and specific heat capacity of the ice, and τ is the horizontal component of tangential stress.
Equations (1)–(3) are used together with the flow law in the following form (Reference GrigoryanGrigoryan and others, 1976):

where τ = –ρg(h – z)(∂h/∂r), obtained on the assumption that the pressure-gradient force arising due to surface inclination is balanced by viscous stress (Reference NyeNye’s (1951) well-known expression). In Equation (4), T 0 is the absolute temperature of ice melting, K, n, and k are parameters of the flow law, and g is the gravitational acceleration. Comparative analysis of the component value of the deformation-rate tensor and complete solution to the equations of motion for stresses have been obtained by Reference GrigoryanGrigoryan and others (1976). The simple relations for τ and deformation velocity which we used in Equations (3) and (4) are the simplest case of this solution for a flat base and for R » h.
We introduce the vertical velocity scale W = a and, according to Equation (1), the horizontal velocity scale Ũ = a R/h. It follows from Equation (2) that a glacier of thickness h has a characteristic time scale te = h/a due to accumulation and ablation. The duration of the passage of an ice particle from the centre of the glacier to its edge has the same order of magnitude as the time scale of relaxation of the stationary temperature regime in the ice sheet due to advective terms. A similar diffusive scale is defined by the expression td = h2/k. For the Antarctic ice sheet, R ≈ 2×10⁶m, h ≈ 2×10³M , a ≈ 3×10⁻⁹ m s–1 such that Ũ ≈ 3×10⁻⁶ m s–1, and te ≈ 0.7×10¹²s (about 20000 years). Assuming that k = 10–6 m2 s–1 we have t d ≈ 4 × 10¹²s. The difference in the estimates t d and t e by one order of magnitude indicates a subordinate role of heat conductivity compared to vertical advection. It is clear that the horizontal diffusive heat flux which is not taken into account in Equation (3) is altogether insignificant. We also consider the glacier dynamic relaxation scale t m defined from Equation (4) as

The boundary conditions are assumed to be h = 0 for r = R, and temperature distribution at the glacier surface T h is taken to be known, as is the geothermal heat flux


We now start deriving the model equations. We integrate Equation (1) from 0 to h and, using the kinematic condition at the free surface Equation (2), obtain the obvious net mass conservation

Using Equation (1) we reduce Equation (3) to divergent form, integrate it from 0 to h on z and, once again using Equation (2) and the boundary conditions for Equation (2), we obtain the integral equation of internal thermal heat-energy conservation

where A is a function describing the distribution of inner and outer heat sources

Here,

Finally, Equation (4) can be written in the form

It can readily be seen that for the case of close to isothermal conditions T = T* the set of equations reduces to the form (see Reference BuddBudd, 1969)


It is interesting to note that Equations (9) and (10) yield a simple relationship between the volumes of the glacier V 1 and V 2 at temperatures T 1 and T 2

We describe the technique for solving the problem. Substituting Equation (8) into Equation (5) we obtain the equation

which can be solved using the finite-difference equation

where h i and h i+1 are values of h at the grid nodes. Several iterations over h are used at each step. We assume the value of h to be a first approximation for vertical averaging of the factor

where

The velocity field is found using Equation (8).
Taking into account the fact that the flow law parameters for ice are approximately known quantities and that the vertical distribution of temperature in a glacier is a smoothly varying function, we use a parabolic approximation for temperature

where ξ= z/h, which, allowing for the boundary conditions, yields

Substituting Equation (16) into Equation (6) gives a differential equation for T 1. The simplest situation, however, occurs if one takes into account the fact that the heal flux through the surface Q h is appreciably less than advective flux a T h (see Reference GrigoryanGrigoryan and others, 1976). T 1 is defined by

Calculations using the exact equation reveal that Q h is smaller than a T h by two orders of magnitude, on average.
The model presented above was used for simulating the Antarctic ice sheet of radius R = 2×10⁶m. The calculations are based on precipitation and surface-temperature distributions shown in Figure 1 which also gives empirical data from Reference TolstikovTolstikov (1966) taken along the profile from Mirny Station towards the centre of spreading of the ice cover of the East Antarctic Continent.
Temperature at the ice surface and accumulation function. 1–distribution of Th used in the calculation; 2–distribution of a used in the calculation; ○,△–corresponding empirical data for Th and a.

The values of parameters used in the calculations are: ρ = 917 kg m–3, c = 2 × 10³ J kg–1 deg–1, k = 1.1×10⁻⁶ m2 s–1, k =21.1, g = 9.8 m s–2, Q = 0.063 w m–2, T 0 = 273.15 K. The parameters in the ice flow law are: n = 1, K = 0.3 × 10⁻¹³ m2 N–1S–1.
Solutions to the equations were obtained not only for present values of the ice surface-temperature and accumulation a(r), but also for the separate and simultaneous increase in the temperature by 2, 4, or 6 deg and precipitation by 10, 20, or 30%.
The present condition of the Antarctic ice sheet is characterized by the following figures: the thickness of the sheet in the centre, 3600 m; the mean glacier temperature, –29.4°C; the conductive heat flux, 7 × 10¹¹ W; the influx of heat is 2×10¹¹ W due to deformation and 2 × 10¹³ W due to precipitation. Figure 2 shows profiles of the ice sheet and temperature and horizontal velocity distribution for the present values of temperature and precipitation and also for precipitation enhanced by 33% and temperature increased by 6 deg. It is interesting to note that for simultaneous changes in the temperature and precipitation, the glacier profile is in practice coincident with the present profile. Figure 3 shows the dependence of the mean temperature and volume of the ice sheet on the surface temperature and ice accumulation both when the value of one of the arguments is fixed and when the two change simultaneously. The stability of the results to changes in the values of flow-law parameters and geothermal flow has been tested by additional calculations.
Glacier surface. The vertical profiles of temperature and horizontal velocity. 1–present distribution of the surface temperature and precipitation; 2–if surface temperature is enhanced by 6 deg; 3–if precipitation is enhanced by 33% (dashed line indicates velocity and temperature profiles for simultaneous increase in Th by 6 deg and in a by 33%).

Dependence of the glacier volume and mean temperature on changes in surface temperature and precipitation, 1–dependence of volume on changes in Th; 2–dependence of volume on changes in a; 3–changes in volume for simultaneous changes in Th and a; 4–dependence of volume on changes in temperature (isothermal model) ; 5–dependence of mean temperature T on changes in Th; 6–dependence of T on changes in a; 7–changes in T for simultaneous changes in Th and a.

We also note that, as indicated by analytical investigation,



