1. INTRODUCTION
The commercial success of a product is dependent upon its functionality, fitness for use, and attractiveness. However, a designer should consider not only these tangible functional aspects of the product but also the psychological perceptions induced by its physical appearance when designing a product to meet consumers' aspirations. Accordingly, the development of a systematic design approach using the suitable analytical techniques is essential for creating a product form that more closely matches the consumers' psychological perceptions and is more likely to achieve commercial success. The following commence by reviewing the background in product form design and introducing the relevant analytical techniques, and then the overview of research implementation is briefly stated in this section.
1.1. Background in product form design
Consumers interact with a huge number of diverse products during the course of their daily lives and therefore subconsciously develop sophisticated product evaluation skills. A consumer's purchase decision is based not only on a product's functionality and fitness for use but also on the psychological response induced by its physical appearance. This phenomenon is particularly apparent in the case of mature consumer products such as mobile phone, automobiles, household appliances, tableware, and computer accessories. As a result, consumer satisfaction with a product's form plays an essential role in determining the likelihood of its commercial success. However, product form design activities are often based on the designers' opinions and personal subjectivities, with no theoretical basis. To avoid the subjective judgments in the design process and to objectively relate consumers' psychological satisfaction with a product to its form features, many systematic design approaches have been proposed for modeling the correlation between the form features of a product and the consumers' perception of the product image (Lai et al., Reference Lai, Lin and Yeh2005; Salhieh, Reference Salhieh2007; Huang et al., Reference Huang, Tsai and Huang2011; Smith and Fu, Reference Smith and Fu2011; Wang, Reference Wang2011; Luo et al., Reference Luo, Fu and Korvenmaa2012; Man et al., Reference Man, Wie and Yang2013). Among such techniques, Kansei engineering (KE) is a fundamental consumer-oriented systematic design approach in which the product image perceptions are expressed using suitable image descriptors. KE has emerged as one of the most powerful techniques for taking account of the correlation between a product's attributes and the induced product image, and has also been successfully applied to a variety of commercial products, for example, automobiles, cosmetic products, mobile phones, machine tools, and so forth (Nagamachi, Reference Nagamachi2002).
The effectiveness of the KE approach is crucially determined by the definition of the design features used to describe the product details and the choice of analytical method used to analyze the correlation between the product form and the corresponding consumer response. However, the design features of a product are described using a morphological approach; that is, the product form is represented using a set of discrete design attributes. In such an approach, the product form encoding merely provides a simplified representation of the form design and is not directly linked to the form features of the product. Consequently, when such an approach is employed, the service of an experienced designer is still required to subjectively conjecture the likely consumer response to subtle changes in the product form design. Accordingly, a numerical definition-based approach (NDA) is proposed for generating a more explicit numerical definition of the product form design (Chen & Chang, Reference Chen and Chang2009). However, such techniques generally require the use of a large number of individual design variables to fully describe the product form, and thus the designer faces considerable difficulties in establishing which particular variables dominate the consumer response and is therefore uncertain as to where best to focus his or her design efforts.
1.2. Analytical techniques for constructing the correlation between product form and consumers' emotional response
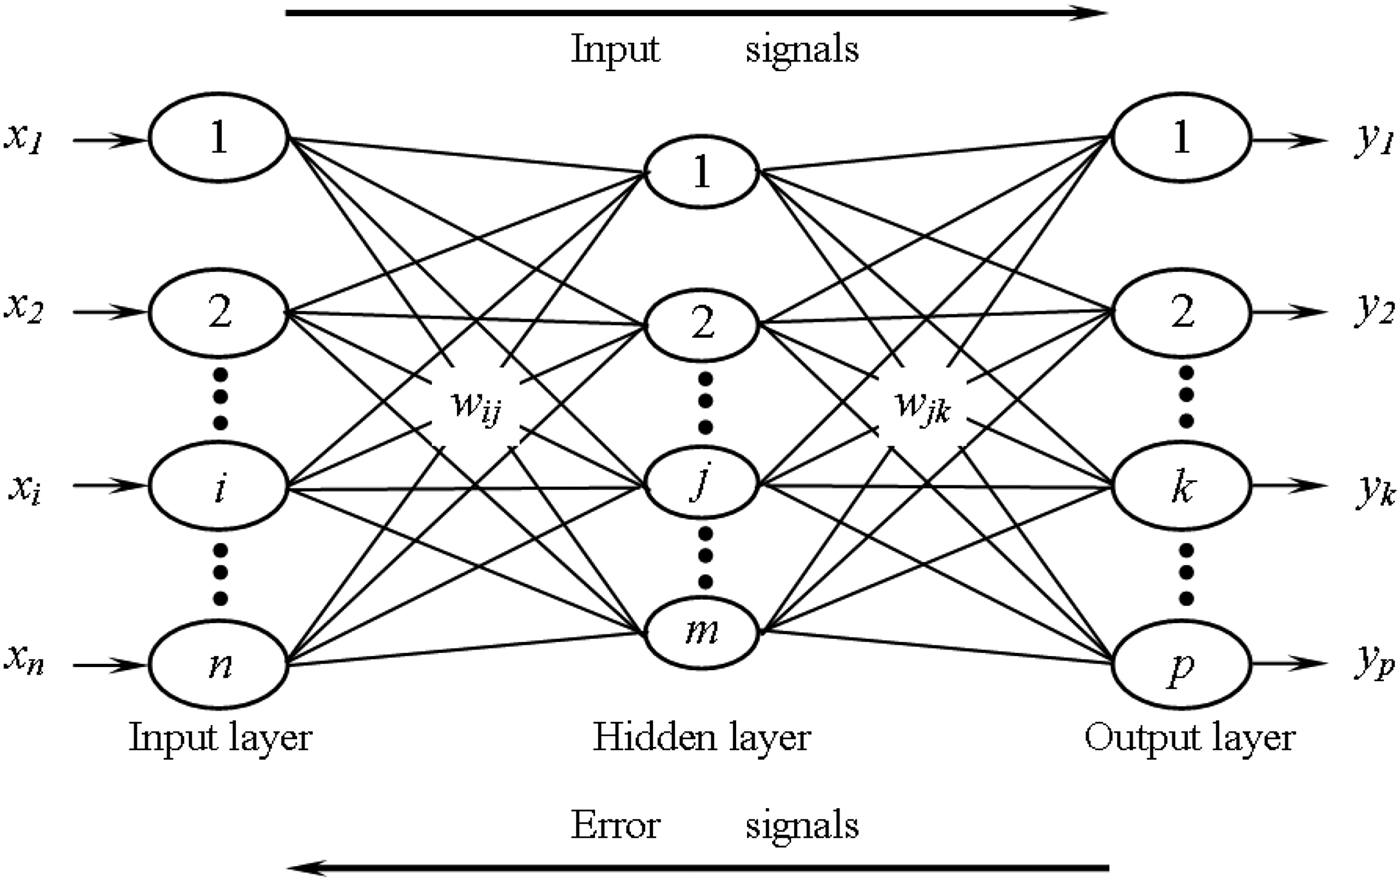
In choosing a suitable analytical technique with which to model the relationship between the product form and the consumers' response, conventional statistical analysis techniques such as multiple regression analysis (MRA) and Quantitative Theory Type I (QTT1; Hayashi, Reference Hayashi1976) are commonly employed to interpret the linear relationships between the independent and dependent variables. However, nonlinear modeling using MRA and QTT1 results in poor predictive performance. In contrast to conventional linear analysis techniques, the backpropagation neural network (BPN) method is free of the restriction on the type of relationship between the independent variables and dependent variables when constructing prediction models. Figure 1 shows a typical three-layered BPN network with an input layer, an output layer and a single hidden layer. In this figure, n, m, and p represent the number of neurons in the input layer, output layer, and hidden layer, respectively (indexed by i, j, and k, respectively); and w ij and w jk represent the weights of the connections between neuron i (i = 1, 2, … , n) and neuron j (j = 1, 2, … , m), and between neuron j (j = 1, 2, … , m) and neuron k (k = 1, 2, … , p), respectively. In training this network, a set of input patterns or signals, (x 1, x 2, … , x n), is presented to the network input layer. The network then propagates the inputs from layer to layer and provides the output at the neurons of the output layer (Negnevitsky, Reference Negnevitsky2002). In an iterative process, the output results are compared to the required values, and the resultant error signals are propagated back through the BPN layers. The weights of the individual network connections are progressively adjusted until the specified error criterion is satisfied. During the verification and subsequent operation of the BPN, the network generates an output by applying the weights established during the training process to the input variables as they are propagated from layer to layer. With their effective learning, storage, and prediction capabilities, BPNs provide a powerful means of examining the complex relationships between input variables and output variables.
Three-layered backpropagation neural network structure.

Comparing the relative merits of conventional linear analysis techniques with that of nonlinear BPN analysis techniques, it seems that the latter are better suited to data analysis applications because they are applicable both to data sets with linear patterns and to those with nonlinear patterns. However, despite their excellent predictive performance, BPN models provide few insights into the relative contribution of each independent variable to the overall predicted result, and the designer has no real idea of which particular design parameters dominate the consumers' perception of the product form. Therefore, some form of selection procedure is required to identify the significant set of independent variables that provide the designer with the meaningful manipulation insights. In practice, these variables are commonly identified using one of three different MRA procedures, namely, stepwise, forward selection, or backward elimination. Of these three techniques, MRA with a stepwise procedure is particularly advantageous because it provides the combinatorial benefits of the forward selection procedure and the backward elimination method, respectively. It seems reasonable to suppose that an integrated scheme, combining a MRA technique with a BPN network (MRBPN model). As implied by its name, the MRBPN scheme comprises two fundamental mechanisms, namely, an independent variable selection function using a MRA method and a product image prediction function based upon a BPN network.
1.3. Overview of research implementation
From the discussions above, this study presents an integrated design approach based on the NDA, MRA, and neural network to form design of product image. The feasibility of the proposed approach is demonstrated using a knife form for illustration purposes. This product is chosen quite specifically here because knives have broadly similar functional structures, and hence the consumer response is governed primarily by the design and appearance of the knife rather than its functional capabilities. The study commences by introducing the NDA to construct an explicit knife form. Forty-three three-dimensional (3-D) models of typical knife forms are then created by manipulating the values of the design variables specified in the numerical definition. Three representative adjectives describing the potential product image perceptions induced by the knife forms are selected using a systematic procedure involving a Kawakida Jirou classification process (Cross, Reference Cross1994) and factor analysis. A PC-based evaluation interface is then constructed using Visual Basic software, and 56 subjects are asked to indicate their emotional responses to each 3-D model using three 9-point Likert scales corresponding to the three product image descriptors. Finally, the evaluation results are then analyzed and employed to construct mathematical models formalizing the correlations between the product form design variables and the consumers' perceptions of the product image using the MRA technique, the BPN model, and the MRBPN scheme. The predictive performances of the three techniques are then compared and contrasted.
2. LITERATURE REVIEW
In this section, the relevant literatures, including the consumers' psychological perception of a product form and the analytical techniques relating the scope of this study, are briefly reviewed, respectively.
2.1. Consumers' perception of a product form
Better product form designs are capable of provoking positive reactions from people (e.g., feelings of inspiration and joy; McDonaugh et al., Reference McDonaugh, Hekkert, Erp van and Gyi2004). Bloch (Reference Bloch1995) discussed the position of product form in evoking positive responses upon perception, and argued that consumers become emotionally engaged in products that capture their attention. Therefore, manufacturers have utilized a wide variety of techniques to understand consumers' emotional perceptions of a product form such that this understanding can be incorporated into their designs in order to increase consumer satisfaction. Many researchers have proposed techniques for screening the specific form features that dominate the perceived product image. For example, Schütte and Eklund (Reference Schütte and Eklund2005) used the QTT1 analytical technique to identify the key form features governing consumers' image perceptions of rocker switch products. Hsiao and Chen (Reference Hsiao and Chen2006) proposed the use of factor analysis and expert judgments to extract the significant shape features that create specific consumers' emotional perceptions such that designers can manipulate these specific features or variables in order to create product forms that better meet the consumers' expectations for product form. Therefore, creating an initial favorable impression is essential for designers seeking to produce commercially viable products. To assist designers in creating aesthetically appealing product form designs, researchers have proposed various alternative approaches for exploring consumers' perceptions of product form. Desmet (Reference Desmet2003) identified five categories of consumers' emotional response to a product, namely, instrumental, aesthetic, social, surprise, and interest. Crilly et al. (Reference Crilly, Moultrie and Clarkson2004) examined the problem of consumers' perception of product form and emphasized the significance of the aesthetic, semantic, and symbolic aspects of cognitive response in the field of product design. Hsiao and Chen (Reference Hsiao and Chen2006) proposed four fundamental dimensions of a consumer's emotional response to a product form: the trend factor, the emotion factor, the complexity factor, and the potency factor. Chang et al. (Reference Chang, Lai and Chang2007) investigated the potential origins of consumers' response to product form and argued that a consumer's psychological response to the profile of a passenger car could be evaluated in terms of the consumer's perception of the aesthetic feeling, novelty and fashion, identity suitability, apparent function, and symbolity belongings of the car's form, respectively. From the preceding discussions, it is clear that consumers' perceptions of a product form are multidimensional in nature and are expressed in the form of abstract personal perceptions or images, which are not easily detected using external measurement instruments.
2.2. Analytical techniques
This section briefly reviews the main concept and characteristics of the analysis techniques, including MRA and BPN, used in this study, respectively.
2.2.1. MRA
MRA is a technique for modeling and analyzing numerical data consisting of the values of a large number of independent variables and a smaller number of dependent variables. The relationship between the independent variables and the dependent variables can be illustrated either graphically or, more usually, by means of an equation. Having established the MRA model, it can be used to predict the value of the dependent variable for any given set of independent variables. In addition, MRA enables a screening of the independent variables such that the performance of the prediction model is enhanced. Generally speaking, the optimal set of independent variables is compiled using one of three different methods: the forward-selection procedure, the backward-elimination procedure, or the stepwise procedure. The forward-selection procedure adds variables to the model one at a time. The first variable included in the model is that with the highest correlation with the independent variable, y. The second variable added to the model is that with the highest correlation with y after y has been adjusted to take into account the first variable. The selection/addition process terminates either when the last variable added to the model has an insignificant regression coefficient or once all of the variables have been added to the model (Chatterjee & Hadi, Reference Chatterjee and Hadi2006). In contrast to the forward-selection procedure, the backward-elimination procedure begins with the full model and successively eliminates the independent variables one variable at a time. The first variable to be deleted is that which provides the smallest contribution to the reduction of the predictive error sum of squares. The second variable to be removed is that which provides the smallest contribution to the predictive error sum of squares index once the first variable has been eliminated. The deletion process is terminated once all the variables are significant or all but one of the variables has been deleted. In the stepwise procedure, any variable added to the model during an earlier selection stage may be deleted at a later stage. The calculations used to determine the inclusion or elimination of the variables are the same as those used in the forward-selection and backward-elimination procedures, respectively. In other words, the stepwise procedure is essentially a forward-selection procedure in which, at each stage, the possibility of deleting a variable is also considered. The number of variables retained in the final model is based on the levels of significance assumed when including or excluding variables, respectively (Myers, Reference Myers1990). Note that the stepwise procedure is adopted in this study because the it provides the combinatorial benefits of the backward and forward screening processes, respectively.
2.2.2. BPN
BPN provides a potent tool for analyzing data and has been successfully applied in a diverse range of fields (Schikora & Godfrey, Reference Schikora and Godfrey2003; Cavalieri et al., Reference Cavalieri, Maccarrone and Pinto2004; Lin et al., Reference Lin, Yeh, Wang and Wei2012). In practice, BPN is achieved by providing the network with a series of input–output sample pairs. For each set of input data, the input pattern is propagated through the BPN layer-by-layer until an output signal is obtained at the nodes in the output layer. The predicted output values are compared with the known output values for the given input data, and the resultant error signals are then propagated back through the BPN, causing an adjustment in the weights of each of the individual network connections. The training process is repeated iteratively using a new training sample each time until the difference between the predicted output values and the known output values fall within a prespecified error range (Negnevitsky, Reference Negnevitsky2002). During the training process, BPN develops internal relationships among the various network nodes so as to organize the training data into particular classes of input patterns. A trained BPN provides an effective means of examining data patterns that may be incomplete or noisy and of inferring subtle patterns from partial inputs. This tendency can be extrapolated to the hypothesis that all the hidden-layer units in a BPN are somehow associated with specific features of the input pattern as a result of the training process. The performance of a BPN is fundamentally dependent upon the network topology, that is, the number of hidden layers and the number of nodes in each layer. In practice, the appropriate network topology depends on the nature of the particular application. However, no formal rules exist for specifying the number of hidden layers and hidden nodes, and thus the designer is forced to rely upon his or her personal experience. The predictive accuracy of a BPN is also directly related to the number and appropriateness of the samples used in the training process. However, no single definition exists for an appropriate number of training samples for all applications, and thus the practitioner is once again required to rely upon his or her own personal experience of neural network modeling to arrive at a suitable training scheme. Notwithstanding these limitations, however, with their effective learning and prediction capabilities, BPNs provide a potent means for examining the complicated correlations between input variables and output variables, and therefore provide an ideal solution for problems such as that considered in this study in which the aim is to predict the consumers' likely response to a product form.
3. METHODS
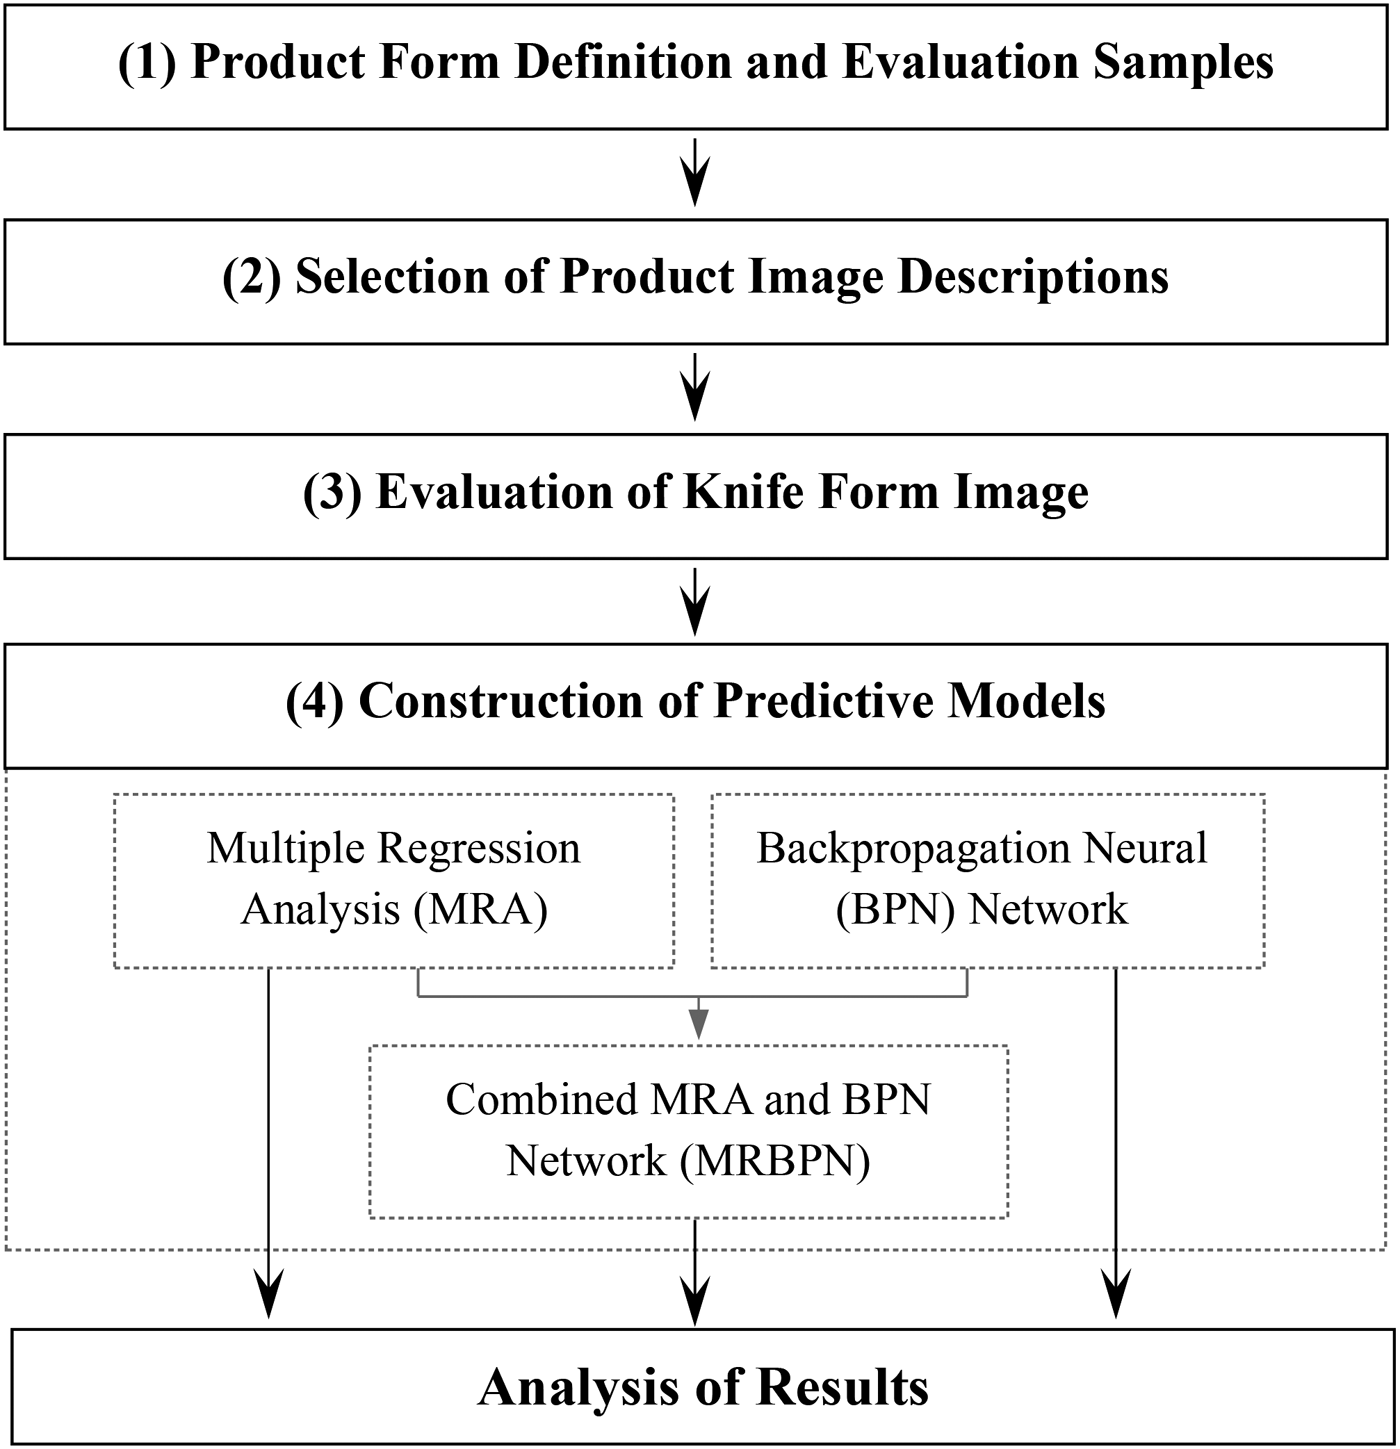
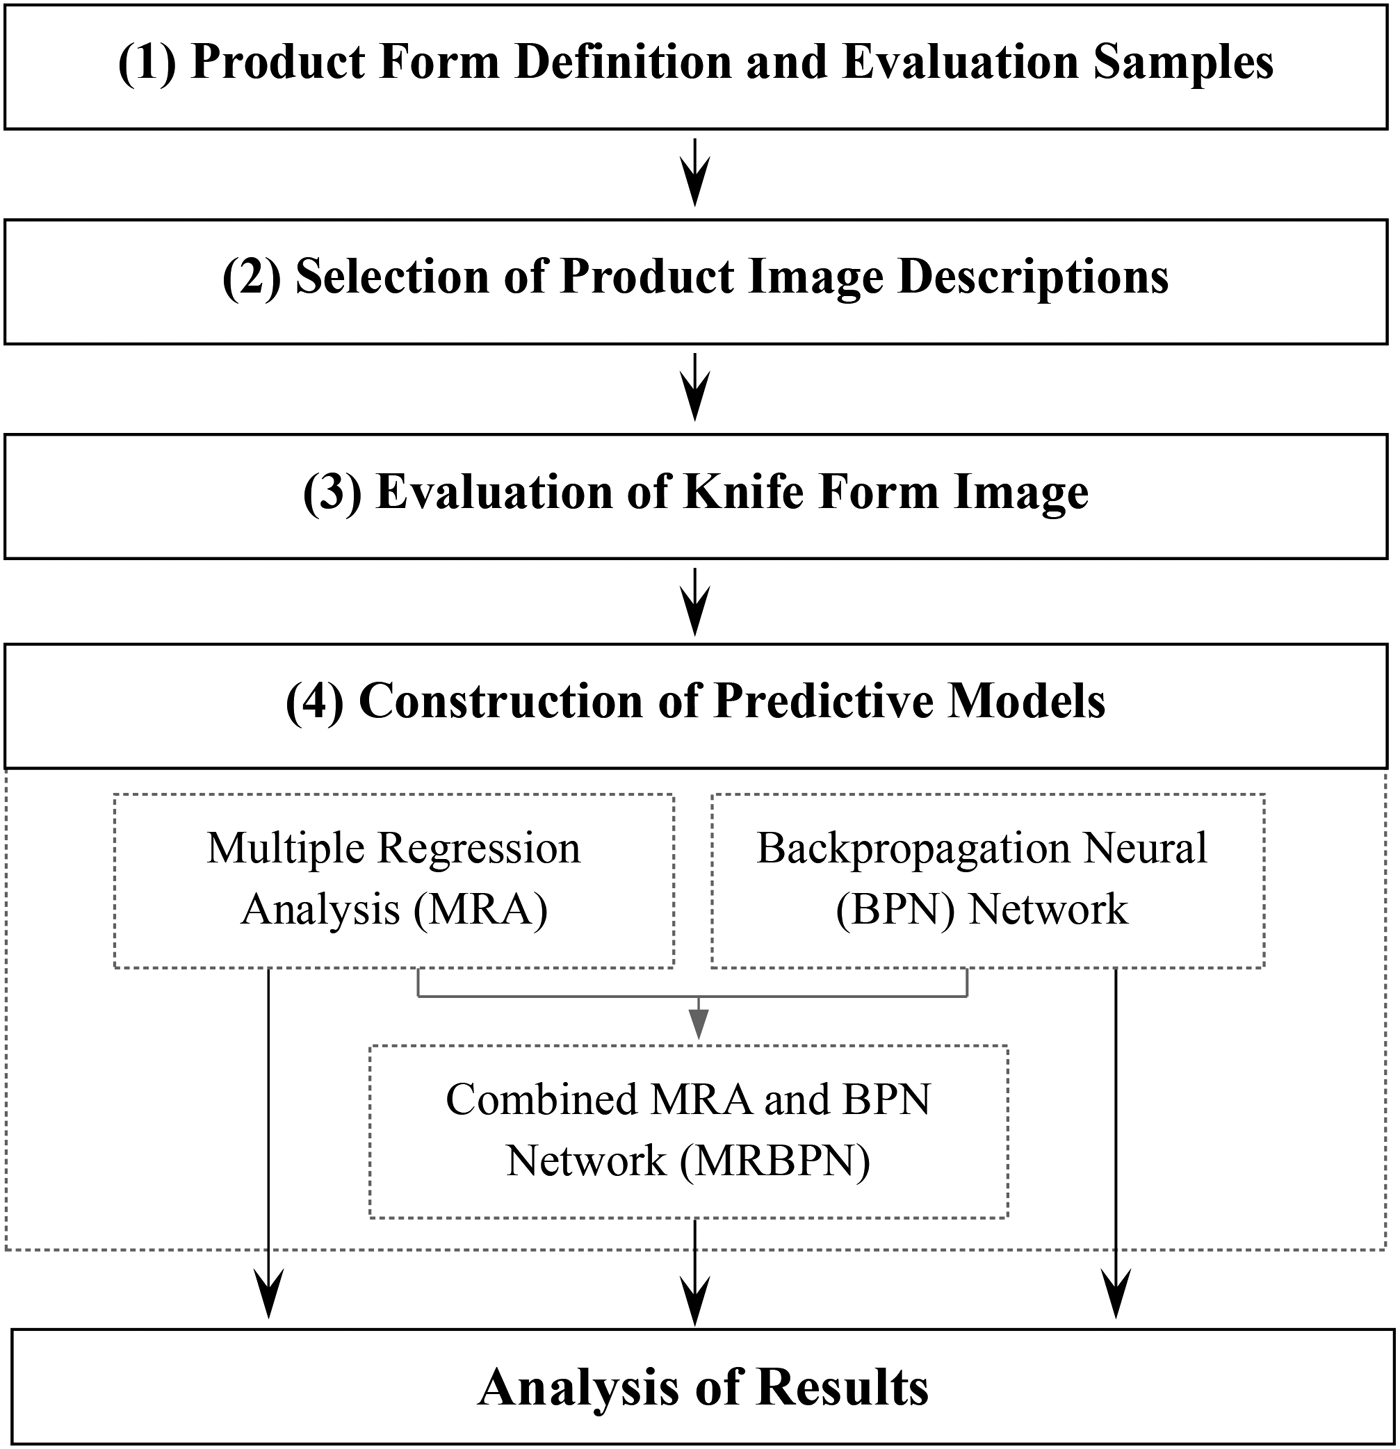
Figure 2 illustrates the modeling of the research procedure implemented in this study. As shown, the implementation procedure comprises the following four stages: product form definition and evaluation samples, selection of product image descriptions, evaluation of knife form image, and construction of predictive models. The relevant methods applied at each stage are explained in this section.
Modeling of the research procedure.
3.1. Product form definition and evaluation samples
The following subsections mainly describe the details, including the “preparation of numerical definition-based knife form samples” and the “define variation of each knife model from the criterion knife form,” so that the variations of design variables of each knife form models from the corresponding design variables of criterion knife form models can be applied in the sequential analytic stage.
3.1.1. Preparation of numerical definition-based knife form samples
The present study uses the NDA proposed by Chen and Chang (Reference Chen and Chang2009) to generate an explicit form representation of a generic knife for illustration purposes. As shown in Figure 3, a generic knife form is defined comprising two basic components, that is, a blade and a handle. To support the modeling of detailed variations in the curve profiles, the two curves of the blade profile are defined as NURBS curves, and are constructed using a total of seven control points (i.e., p1–p7). Control point p1, located at the intersection point of the upper and lower curves, is specified as the origin of the coordinate system used to describe the X- and Y-axis coordinate locations of each control point in the overall knife form definition. Variations in the form of the knife handle are modeled using six adjustable design elements, namely, a centric curve to define the contour of the lower edge of the handle, a width-to-height proportion parameter, a sectional area proportion parameter, a rounded radius parameter, a sectional inclination parameter, and a tail arc curve. The centric curve representing the central backbone of the knife handle is modeled using a three-degree NURBS curve with five control points (p8–p12). To facilitate the introduction of detailed variations in the form of the knife handle, five sections are uniformly distributed along its length, forming the foresection, second section, third section, fourth section, and tail section, respectively. Finally, detailed variations in the shape of the tail section are accomplished by adjusting the positions of the three control points p13–p15. The resulting 39 design variables for the numerical definition of the knife form are shown in Figure 3. Using these design variables, a total of 43 knife models are created using 3-D software by three experienced product designers. In order to reduce perceptual differences caused by the materials and textures of the 3-D model, the blade is assigned a simple gray material in every case, while the handle is assigned a black material.
Numerical variables used to create explicit definition of knife form.
3.1.2. Define variation of each 3-D knife model from the criterion knife form
Because the numerical data sets corresponding to the 43 knife models all vary in terms of their coordinate data, inclination angles, dimensional proportions, and rounded radius values, respectively, it is difficult to interpret the analytical results regarding the relationship between detailed variations in the knife form and the corresponding change in the consumers' emotional response to the product image. Consequently, an average 3-D knife form is generated using a shape averaging method (Chen & Parent, Reference Chen and Parent1989) to create a criterion against which to define the variation of each knife form. As shown in Figure 4, the criterion knife form is created by averaging the design variables of the 43 knife form models. The variation of the design variables of each of the 43 knife form models from the corresponding design variables of the criterion knife form models is then computed in order to create a relative numerical data set for each model to provide the independent variables (i.e., the design variables) used in the subsequent analysis of the correlation between the knife form and the corresponding product image.
Defining variation of 43 knife forms from the criterion knife form.
3.2. Selection of product image descriptors
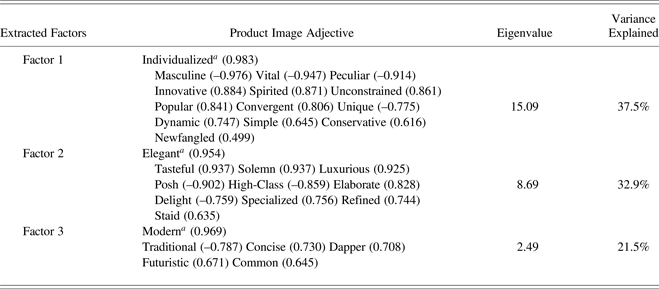
The adjectives used by consumers when expressing their perceptions of a particular product provide an explicit representation of their abstract emotional response to the product's form, and therefore furnish designers with valuable clues regarding the consumers' product image expectations and the likelihood of the success of the generated product form in meeting its design objectives. In this study, around 150 adjectives pertaining to knives of various types are collected from web sites, magazines, and so forth. These adjectives are sieved by the three industrial designers according to whether or not these adjectives relate entirely to the product form such that just 31 adjectives remained. The 31 adjectives are used as the initial image perceptions for a semantic differential experiment, in which consumers (8 male, 8 female; average age = 27) are asked to evaluate a small number of representative knife samples obtained from a Kawakida Jirou classification. The semantic differential data are then analyzed using a factor analysis technique. As shown in Table 1, the extracted factors accounted for 37.5%, 32.9%, and 21.5% of the explained variance. For each factor, a representative adjective is selected by picking the adjective with the largest absolute factor loading. The three extracted adjectives (elegant, modern, and individualized) are then used in a knife design evaluation experiment.
Extraction of representative adjectives
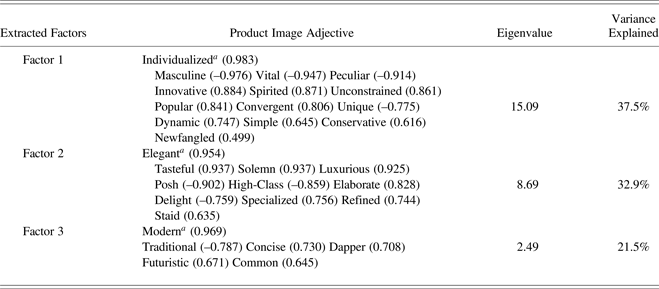
aThe representative image descriptor.
3.3. Evaluation of knife form image
Fifty-six subjects (31 male, 25 female; ages = 23–35) are invited to evaluate the product images projected by the 43 3-D knife models. In the manual evaluation procedure, the emotional responses induced by each model are quantified using three Likert scales, that is, one scale for each of the three product image descriptors. In accordance with the 7 ± 2 limit on an individual's capacity for processing information (Miller, Reference Miller1983), each scale is constructed with nine points. As shown in Figure 5, the 43 knife form samples and the three Likert scales are integrated into an evaluation interface constructed using Visual Basic software. After each subject has evaluated all of the samples, the evaluation data are recorded for analysis purposes.
Knife form evaluation interface.
3.4. Construction of predictive models
In this study, the image evaluation results obtained for the 3-D knife forms are analyzed using three separate analytical techniques: MRA, a BPN model, and MRBPN. In analyzing the data using each of the three methods, the independent variables correspond to the individual design variables in the numerical product form definitions, while the dependent variables correspond to the three product image descriptors given in Table 1 for the knife form.
4. ANALYSIS OF RESULTS
The analysis commences by discussing the use of the data collected from the knife form image perception evaluation trials in constructing functional models to relate the independent (i.e., the design variables) and dependent variables in the respective product form designs. The effects of the design variables in shaping the consumers' perceptions of the knife forms are then illustrated. This section concludes by discussing and comparing the performance of the prediction models for each image perception domain of the knife form.
4.1. Construction of predictive models
MRA, BPN, and MRBPN are used to construct predictive models relating the design variables of the knife form to the corresponding consumer response. The details of each analytical technique are described in the subsections below.
4.1.1. Regression (MRA) models
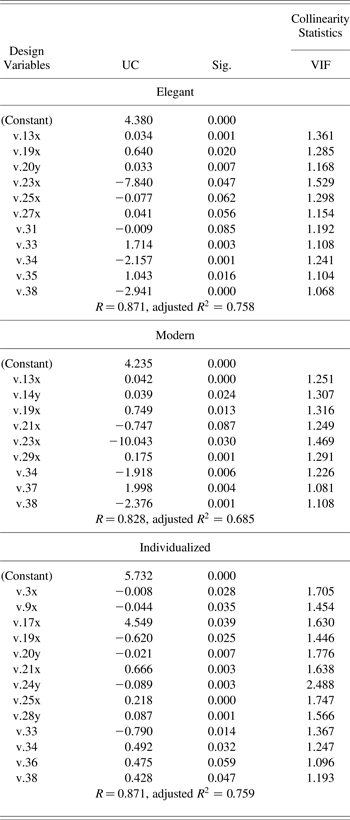
The product image evaluation data are analyzed using a MRA technique with a stepwise procedure in order to identity the design variables that have the most significant effect on the consumers' response to the knife form in each of the three product image domains. Table 2 shows that the determination coefficients (adjusted R 2) of the three product image perception domains are 0.758 (elegant), 0.685 (modern), and 0.759 (individualized). This result confirms that there exists a significant relationship between the 39 design variables and the three image perception domains. The significant design variables (as evaluated using a significance level of 0.1) are listed in the first column of the table, and the corresponding unstandardized coefficients are presented in the second. When conducting the regression analysis, the collinearity characteristics of the design variables are tested by examining the variance inflation factor. The corresponding results are shown in the rightmost column of the table. It can be seen that the variance inflation factor values are all less than 10 (min. = 1.068, max. = 2.488), and hence it can be inferred that the independent variables are free of the collinearity effect. As a result, the unstandardized coefficients values of the design variables can be used to construct reliable mathematical models formalizing the relationship between the values of the design variables and the corresponding product image perception induced in each of the three image perception domains.
Regression coefficients of significant design variables in three product image perception domains of knife form
4.1.2. BPN models
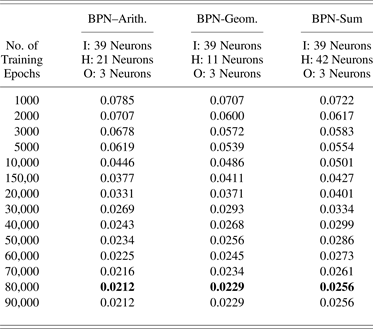
In constructing and training the BPNs to predict the likely consumer response to any 3-D knife form designed using the NDA, the 39 design variables for each knife form are supplied to the input neurons of the BPN, while the average values of the three product image evaluations obtained in the manual evaluation procedure are used as the target values for the output neurons. Three BPN models are constructed, in which the number of neurons in the single hidden layer is determined using the arithmetic mean (Arith.), geometric mean (Geom.), and sum (Sum) configuration rules, respectively. The configurations of the three BPNs are summarized in the second row of Table 3. The BPN models are trained using the numerical definition data of the 43 knife form samples and the corresponding image perception values established using the manual evaluation procedure. The training process is performed using a sigmoid transformation function and the delta-rule training rule, respectively. It is found that in all three BPN models, the root mean square error (RMSE) fell to a value of less than 0.08 after approximately 2000 epochs. The full set of training results are summarized in Table 3. It is observed that for each model, the minimum RMSE value is obtained after 80,000 training epochs. In general, the three models provide a similar level of predictive accuracy; that is, the difference in the three RMSE values is less than 0.005 (0.0256 – 0.0212 = 0.0044). From inspection, it is determined that the BPN-Arith. model yields the lowest prediction errors of the three models, that is, an RMSE value of 0.0212 after 80,000 epochs. Consequently, the BPN-Arith. model is adopted as the operational BPN model for predicting the knife form image values associated with any given numerical knife form definition.
RMSE of BPN models for knife form training data set
Note: I, H, and O, Input, hidden, and output layers, respectively.
4.1.3. MRBPN models
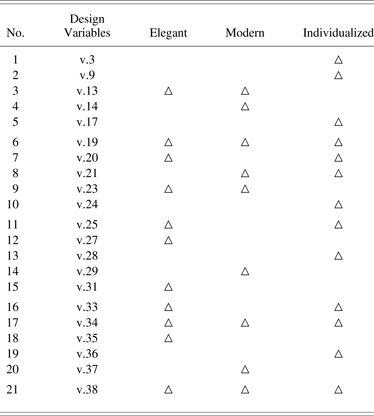
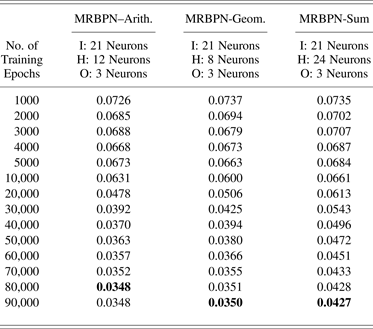
Table 4 shows the correlation between the 21 most significant design variables (as identified using the MRA procedure with a stepwise selection method) and the three product image domains of the 3-D knife form. In the training process, the 21 design variables for each knife form are supplied to the input neurons of the MRBPN models, while the average values of the three product image evaluations are used as the target values of the output neurons. The appropriate number of neurons in the single hidden layer is determined in accordance with the Arith., Geom., and Sum configuration rules. The configurations of the three MRBPN models are summarized in the second row of Table 5. The MRBPN models are trained using a sigmoid transformation function and a delta-rule learning rule. The training results are presented in Table 5. It can be seen that the RMSE values of the three MRBPN models reduce to less than 0.08 after just 1000 training epochs and reduce further to final values of 0.0348 (MRBPN-Arith.; 80,000 epochs), 0.0350 (MRBPN-Geom.; 90,000 epochs), and 0.0427 (MRBPN-Sum.; 90,000 epochs). From inspection, the difference between the RMSE values of the three MRBPN models is less than 0.008 (0.0427 – 0.0348 = 0.0079), and thus it is implied that the three models have a similar predictive performance. However, the MRBPN-Arith. model yields the lowest RMSE value of the three models, and it is therefore adopted as the operational MRBPN model for predicting the knife form image value in each of the three perception domains for any given numerical profile definition.
Mapping of retained design variables to product image domains of knife form model
Note: △, Correlation between retained design variables and each image perception domain.
RMSE of MRBPN models for knife form training data set
Note: I, H, and O, Input, hidden, and output layers, respectively.
4.2. Performance evaluation and comparison of prediction models
The following contents discuss the “performance evaluation” and the “performance comparison” of the three functional models (MRA, BPN, and MRBPN) in predicting the projected image of the knife form in each of the three image perception domains, respectively. The relevant details are explicitly described in the subsections below.
4.2.1. Performance evaluation
To verify the predictive ability of the functional MRA, BPN, and MRBPN models, six new knife forms are designed using the respective NDA schemes, as shown in Figure 6. In the verification process, the six knife form samples are input to the evaluative interface shown in Figure 5 and are evaluated by a second group of 30 subjects (19 male, 11 female; ages = 23–35 years) using three 9-point Likert scales. The product image perception in each of the three domains associated with the 3-D knife form is also predicted by substituting the relevant design variable values of each verification sample into the functional models. The discrepancy between the Likert scale evaluation scores assigned to each verification sample by the two groups of subjects and those predicted by the prediction models is assessed using the RMSE index (EI) given in Equation (1):
 $${\rm EI} = \sqrt {\displaystyle{{\sum\nolimits_{i = 1}^n {\lpar x_i - x_0 \rpar ^2 } } \over n}} \comma \;$$
where x i is the Likert scale point assigned by the ith subject, x 0 is the Likert scale point predicted by the corresponding model, and n is the number of participants involved in the validation experiments. The EI value in Eq. (1) gives the average difference between the evaluations of the subjects and those of the corresponding model, respectively, for a single point on the 9-point Likert scale. To enable the reliability of the prediction models to be more conveniently compared, a normalized EI value is obtained by dividing the result obtained from Eq. (1) by 9 to yield an error rate (ER) in the interval [0, 1] to enable the reliability of the three models to be more conveniently compared. Accordingly, a lower value of ER indicates an enhanced predictive capability.
Knife form models used for functional model verification purposes.
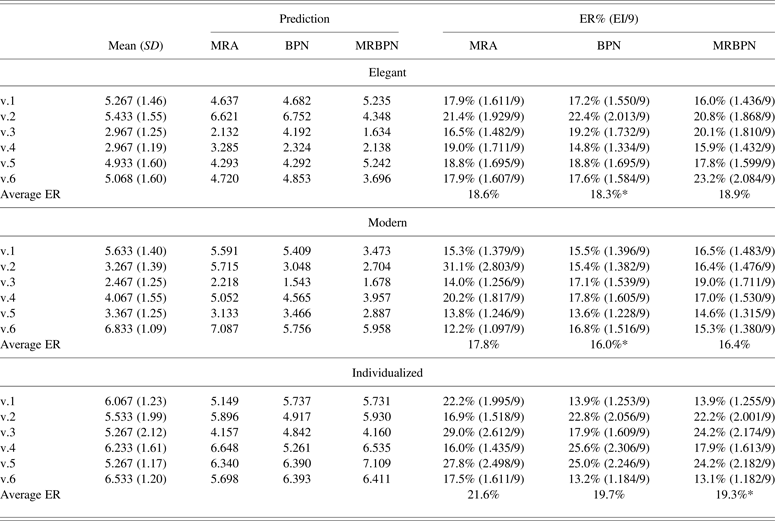
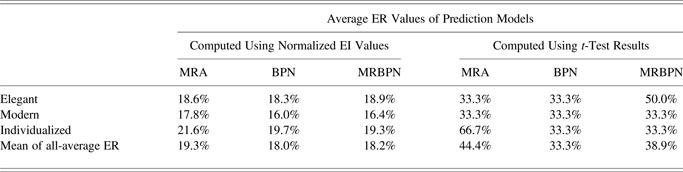
Table 6 summarizes the ER computation results obtained for the predictive performance of the MRA, BPN, and MRBPN models when applied to the 3-D knife form verification samples. In this table, the first column shows the mean and standard deviation of the evaluation data acquired for each sample in each of the three image perception domains. The second, third, and fourth columns indicate the Likert scores predicted by the three functional models. As shown in the fifth column of Table 6, the average ER values of the elegant, modern, and individualized MRA prediction models are 18.6%, 17.8%, and 21.6%, respectively. The average ER values of the three image perception domains as evaluated using the BPN prediction model are 18.3%, 16.0%, and 19.7% (see the sixth column of Table 6), while the average ER values of the three image perception domains as evaluated using the MRBPN prediction model are 18.9%, 16.4%, and 19.3% (see the right column of Table 6). These average ER values demonstrate the basic reliability of the three functional models in predicting the projected image of the knife form in each of the three image perception domains.
Manually assigned product image evaluation data, predicted evaluation results, and error rate analysis for three predictive models when applied to knife form
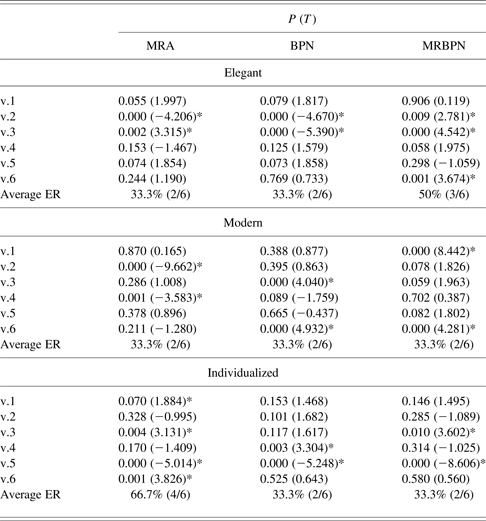
In order to further confirm the applicability of the three models to the design of a 3-D knife form, the one-sample t test is used to examine whether or not the subjects' evaluation results are significantly different from the predicted evaluation results. An assumption is made that if the p value of the t test is smaller than 0.05, the difference is statistically significant; that is, there exists a predictive error between the subjects' evaluation results and the predicted evaluation results. Then, the sum of the predictive error frequency divides by the totality of the verification samples to yield an average ER for enabling the prediction performance of the three models to be more conveniently compared. Table 7 summarizes the t test statistical results obtained for the predictive performance of the MRA, BPN, and MRBPN models. As shown in the first column of Table 7, the average ER values of the elegant, modern, and individualized MRA prediction models are 33.3% (2/6), 33.3% (2/6), and 66.7% (4/6), respectively. The average ER values of all three image perception domains as evaluated using the BPN prediction model are 33.3% (2/6); and the average ER values of the three image perception domains as evaluated using the MRBPN prediction model are 50.0% (3/6), 33.3% (2/6), and 33.3% (2/6; see the right column of Table 7). As a whole, the only exception to the average ER value (66.7%) in the individualized image domain of the MRA model and to the average ER value (50.0%) in the elegant image domain of the MRBPN model that exists is the respective higher ERs. Observing the other average ER values, these ER data demonstrate the basic ability of the three functional models in predicting the knife form image for each of the three image perception domains.
T-test results for three predictive models
*The difference between the subjects' evaluation data and the predicted evaluation results.
4.2.2. Performance comparison among the MRA, BPN, and MRBPN models
Table 8 summarizes the average ER values computed using two separate verification methods (i.e., computed using the normalized EI values and computed using the t test results) in the three functional models when applied to predict the consumer response to the knife form in each of the corresponding image perception domains. In terms of the average ER values computed using the normalized EI value, the results presented in the first, second, and third columns of Table 8 show that the average ER values of the BPN and MRBPN models are consistently lower than those of the MRA model in each image perception domain. The only exception to this tendency occurs in the elegant image perception domain associated with the knife form, in which the average ER value of the MRA model (18.6%) is slightly lower than that of the MRBPN model (18.9%). Observing the mean ER data presented in the lower row of the top three columns of the table, it is inferred that the nonlinear BPN and MRBPN models represent a better solution for predicting the consumers' likely response to a particular knife form than the MRA model. As shown in the second and third columns of Table 8, the mean average ER values of the two prediction models for the knife form are 18.0% and 18.2%. Comparing the mean average ER values of the BPN model with those of the MRBPN model, it is observed that the former is slightly lower (i.e., better) than the latter. The finding implies that the predictive performance of the conventional BPN model is superior to that of the hybrid MRBPN scheme. As to the average ER values computed using the t test result, the lower row of the rightmost three columns in Table 8 show that the average ER values of the BPN and MRBPN models are consistently lower than those of the MRA model. Further, comparing the mean average ER values of the BPN model with those of the MRBPN model, it is observed that the former is also lower than the latter. Accordingly, the verification result of the t test indicates that the BPN model provides more reliable predictions than the MRBPN model.
Comparison of average ER values of three prediction models when applied to 3-D knife form
Overall, although the results presented in the lower row (i.e., mean of all average ER) of Table 8 show that the two separate verification methods have apparent differences in the prediction performance of the three functional models (i.e., the verification results computed using normalized EI values are lower than those computed using t-test results), the verification results of the two separate methods have conspicuous tendencies; that is, the BPN model provides a better predictive performance than the MRBPN model. Consequently, it can be inferred that the BPN model represents a better solution for predicting the consumers' likely response to a particular knife form than the MRBPN model. However, while the inclusion of a large number of design variables enhances the efficiency of a general predictive model, it also increases the model complexity and therefore causes the designer problems in understanding the true nature of the relationship between the consumers' image perception and the individual design variables. Although the average ER values of the MRBPN model are inferior to those of the BPN, the MRBPN model has the advantage that it utilizes fewer design variables to predict the consumers' likely response to the knife form, and thus the functional relationships between the input design variables and the image perception values are not only more straightforward than those in the BPN model but also more intuitively understandable. From inspection, the difference in the mean average ER values of the BPN and MRBPN models is found to be less than 0.3% (computation of using the normalized EI values) and 5.7% (computation of using the t test results). Thus, overall, it seems reasonable to infer that the MRBPN model also represents an applicable solution for predicting the consumers' image perceptions of the knife form, because it achieves a predictive ability close to that of the BPN model, but with an improved efficiency and transparency.
5. DISCUSSION AND CONCLUSION
The problems of how best to satisfy consumers' expectations for a product form have attracted considerable interest in the literature in recent decades. In this study, these problems have been addressed via the development of the integrated design approach based on NDA. The relationships between the product form design variables and the consumers' perceptions of the product image are established using MRA, BPN, and MRBPN. However, the BPN model with its sophisticated nonlinear algorithms is often opaque (Petiot & Yannou, Reference Petiot and Yannou2004; Kwon et al., Reference Kwon, Omitaomu and Wang2008), and it is therefore frequently difficult to recognize the specific design variables or features that dominate the consumers' response to the product design. By contrast, MRA techniques allow designers to construct relationship models comprising only those independent variables that exert the most significant effect on the dependent values. Accordingly, the current study has proposed a hybrid MRBPN predictive model that combines the variable selection advantage of MRA and the sophisticated data analysis capabilities of BPN. The various models have all been verified by comparing the predicted consumers' perception of the product image in each product image domain with the corresponding manual evaluation results. The verification results presented in Table 8 have shown that the BPN and MRBPN models provide a better predictive performance than the MRA models. This result is consistent with the contention that a nonlinear model yields more accurate prediction results than does a general linear model (Lind & Sulek, Reference Lind and Sulek2000; Lu & Zhang, Reference Lu and Zhang2001; Lai et al., Reference Lai, Lin, Yeh and Wei2006; Kwon et al., Reference Kwon, Omitaomu and Wang2008).
One of the major contributions of this study consists in proposing a hybrid MRBPN model for constructing the relationship between product form and corresponding product image. The validation results have shown that the predictive performance of the resulting MRBPN model is similar to that of the BPN model. Furthermore, the use of the MRA technique identifies the significant design variables for clearly providing designers with an understanding of how these variables should be manipulated in order to obtain or reinforce the desired consumers' perception of product image by using the BPN prediction model, and therefore yields both more straightforward and more transparent relationships between the product form design variables and the consumers' perception of product image. Therefore, the basis of the NDA for describing product form, coupled with the medium of the MRBPN model constructing procedure, is suggested to develop a feasible integrated design approach.
In future studies, it would be worthwhile considering the use of alternative methods for establishing the relationship between the dependent variables and the independent variables in the product form design field. For example, fuzzy logic algorithms (Lin et al., Reference Lin, Lai and Yeh2007; Huang et al., Reference Huang, Tsai and Huang2011), fuzzy neural network algorithms (Petiot & Yannou, Reference Petiot and Yannou2004), the combination of the support vector regression technique (Wang, Reference Wang2011; Zhua et al., Reference Zhua, Pan, Chen and Zhang2012) and the support vector machine recursive feature elimination technique (Shieh & Yang, Reference Shieh and Yang2008), or the integration of fuzzy neural networks and genetic algorithms (Hsiao & Tsai, Reference Hsiao and Tsai2005) may provide a more suitable approach than the three techniques considered in the present study because such techniques are known to enable highly accurate predictions to be obtained even when the model includes a large number of independent variables. Finally, consumers' perceptions of a product are inherently complex and abstract in nature. Moreover, in the real world, they invariably differ significantly from one individual to another and change over time. As a result, there is no guarantee that the “optimal” result obtained using the integrated design approach today will satisfy the consumers' product image expectations in the future. Therefore, the full power of an integrated design approach can only be realized by performing a further series of investigations to develop a robust understanding of the core determinants of the consumers' product image expectations such that old products can be evolved and new products introduced to satisfy the product image expectations of the majority.
Hung-Yuan Chen is an Assistant Professor in the Department of Visual Communication Design at Southern Taiwan University of Science and Technology. He received his MS and PhD degrees in industrial design from National Cheng Kung University. Dr. Chen's interests include Kansei research for the design of product form and material, design cognition, affective design, and communication design research.
Hua-Cheng Chang is an Assistant Professor in the Department of Multimedia and Entertainment Science at Southern Taiwan University of Science and Technology. He received his MS and PhD degrees in industrial design from National Cheng Kung University. Dr. Chang's interests include consumers' Kansei research for product design, optimization design, affective design, and human–computer interaction in digital games.