

Traumatic brain injury (TBI) is a leading cause of death and disability (AIHW, 2007; Fortune, Reference Fortune and Wen1999; Ponsford, Sloane, & Snow, Reference Ponsford, Sloane and Snow2013), although most TBIs are categorised as mild (70–90%) (Cassidy et al., Reference Cassidy, Carroll, Peloso, Borg, Von Holst, Holm and Coronado2004). TBI is defined by the American College of Rehabilitation Medicine as an alteration in brain function, or other evidence of brain pathology, caused by an external force (Menon, Schwab, Wright, & Maas, Reference Menon, Schwab, Wright and Maas2010). Research has investigated the prevalence, predictors and treatments of concussive symptoms.
Many who suffer TBI experience post-concussion symptoms (PCS), including headache, nausea and dizziness (Faux & Sheedy, Reference Faux and Sheedy2008), cognitive functioning, including poor memory and concentration (Barker-Collo et al., Reference Barker-Collo, Jones, Theadom, Starkey, Dowell, McPherson and Feigin2015), mood issues (Herrmann et al., Reference Herrmann, Rapoport, Rajaram, Chan, Kiss, Ma and Lanctôt2009), sleep disturbances and fatigue (Ponsford et al., Reference Ponsford, Ziino, Parcell, Shekleton, Roper, Redman and Rajaratnam2012) and vision and balance problems (Kleffelgaard, Roe, Soberg, & Bergland, Reference Kleffelgaard, Roe, Soberg and Bergland2012; Laborey et al., Reference Laborey, Masson, Ribéreau-Gayon, Zongo, Salmi and Lagarde2014). These are well documented in cohorts with mild TBI (mTBI), but also affect those with more severe TBI (Carroll et al., Reference Carroll, Cassidy, Cancelliere, Côté, Hincapié, Kristman and Hartvigsen2014; Dean, O'Neill, & Sterr, Reference Dean, O'Neill and Sterr2012; Dikmen, Machamer, Fann, & Temkin, Reference Dikmen, Machamer, Fann and Temkin2010).
An important focus of clinical research has been investigating PCS recovery in mTBI. Findings have shown that whilst most people with mTBI recover to pre-injury levels within three to six months, problems remain ongoing for a sizable proportion (up to approximately 30%), impairing the person's psychosocial functioning, including difficulties with engaging in and maintaining work, relationships and leisure activities (Barker-Collo et al., Reference Barker-Collo, Jones, Theadom, Starkey, Dowell, McPherson and Feigin2015; Hadanny & Efrati, Reference Hadanny and Efrati2016; Kraus, Hsu, Schafer, & Afifi, Reference Kraus, Hsu, Schafer and Afifi2014; Lannsjö, Geijerstam, Johansson, Bring, & Borg, Reference Lannsjö, Geijerstam, Johansson, Bring and Borg2009; Lundin, de Boussard, Edman, & Borg, Reference Lundin, de Boussard, Edman and Borg2006; Potter, Leigh, Wade, & Fleminger, Reference Potter, Leigh, Wade and Fleminger2006; Rabinowitz et al., Reference Rabinowitz, Li, McCauley, Wilde, Barnes, Hanten and Levin2015).
Some researchers have proposed different trajectories of recovery for symptoms. For example, Ryan and Warden (Reference Ryan and Warden2003) suggested two sets of symptom clusters (‘early’ and ‘late’). They proposed early symptoms were typically experienced immediately following injury and included drowsiness, headache, dizziness and nausea. Late symptoms occurred some days or weeks following injury and included physical, cognitive and emotional symptoms, such as irritability, concentration difficulties, visual disturbances, noise sensitivity, depression and anxiety (Ryan & Warden, Reference Ryan and Warden2003). Some limited support has been found for this proposal and is discussed further below (Eyres, Carey, Gilworth, Neumann, & Tennant, 2005).
In addition to examining outcomes, research has sought to understand the predictors of PCS outcomes. For example, in a group of 84 adults with mTBI Ponsford et al. (Reference Ponsford, Willmott, Rothwell, Cameron, Kelly, Nelms and Ng2000) found approximately one-quarter continued to suffer significant PCS problems three months following injury. The associated factors were a history of previous head injury, neurological or psychiatric problems, being a student, being female and having been injured in a motor vehicle accident. Older age and being female appear to be higher risk factors for persisting PCS (King, Reference King2014; Rabinowitz et al., Reference Rabinowitz, Li, McCauley, Wilde, Barnes, Hanten and Levin2015). It has been suggested that the interaction of these other factors with the effects of TBI could exacerbate symptoms and distress, and in some cases underpin persistent PCS (Cnossen et al., Reference Cnossen, Winkler, Yue, Okonkwo, Valadka, Steyerberg and Manley2017; Ponsford et al., Reference Ponsford, Sloane and Snow2013; Theadom et al., Reference Theadom, Parag, Dowell, McPherson, Starkey, Barker-Collo and Group2016). Identification of individuals with persisting problems has prompted development of early intervention approaches.
Several early intervention trials have been evaluated, with mixed findings. While some studies have shown interventions such as education about injury, physiotherapy and encouragement to return to activities have helped reduce symptom severity and enabled earlier return to work (Bell et al., Reference Bell, Hoffman, Temkin, Powell, Fraser, Esselman and Dikmen2008; Relander, Troupp, & Af Björkesten, Reference Relander, Troupp and Af Björkesten1972), others have shown no clear beneficial effects for more intensive interventions (e.g., Elgmark Andersson, Emanuelson, Björklund, & Stålhammar, Reference Elgmark Andersson, Emanuelson, Björklund and Stålhammar2007; Ghaffar, McCullagh, Ouchterlony, & Feinstein, Reference Ghaffar, McCullagh, Ouchterlony and Feinstein2006; Matuseviciene, Borg, Stålnacke, Ulfarsson, & de Boussard, Reference Matuseviciene, Borg, Stålnacke, Ulfarsson and de Boussard2013). However, there is evidence that, whilst not universally beneficial, low cost interventions such as giving information about expected symptoms and discussing coping strategies has resulted in fewer reported symptoms, less disruption to social activities and lower levels of stress (Ponsford et al., Reference Ponsford, Sloane and Snow2013; Wade, Crawford, Wenden, King, & Moss, Reference Wade, Crawford, Wenden, King and Moss1997; Wade, King, Wenden, Crawford, & Caldwell, Reference Wade, King, Wenden, Crawford and Caldwell1998). Efforts to develop effective PCS treatments remain ongoing (e.g., Dexheimer et al., Reference Dexheimer, Kurowski, Anders, McClanahan, Wade and Babcock2017; Naeser et al., Reference Naeser, Zafonte, Krengel, Martin, Frazier, Hamblin and Baker2014). Clinical research and practice depend on well-developed measures of PCS, to understand outcomes and track treatment-related change.
The Rivermead Post Concussion Symptoms Questionnaire (RPQ)
A frequently cited and used measure in this area is the Rivermead Post Concussion Symptoms Questionnaire (RPQ, King, Crawford, Wenden, Moss, & Wade, Reference King, Crawford, Wenden, Moss and Wade1995; Sullivan & Garden, Reference Sullivan and Garden2011), a self-rating scale developed to measure the severity of PCS following TBI. Tate (Reference Tate2010) described the RPQ as having 16 items, within three categories. These were Physical symptoms, including headaches, dizziness, nausea/vomiting, sleep disturbance, noise and light sensitivity, blurred vision and double vision. Cognitive symptoms, included forgetfulness, poor concentration, slowed thinking. Finally, Behavioural symptoms comprised fatigue, irritability, tearfulness/depression, impatience and restlessness.
The RPQ is designed for completion by the individual with TBI, rating symptoms experienced in the past 24 hours. It is quick and easy to complete (Tate, Reference Tate2010), each item being rated on a five-point scale: 0 = not experienced at all, 1 = no more of a problem, 2 = a mild problem, 3 = a moderate problem, and 4 = a severe problem. In its original form, a total score was the sum of all item scores except scores of 1, as this corresponds to resolution of a previous symptom. The total score ranged from 0 to 64, with higher scores indicating more severe symptomology. Although the RPQ total score has been proposed as a measure of severity of PCS, to date no clinical cut-off score has been derived that might indicate the presence of post-concussion syndrome (Tate, Reference Tate2010).
Psychometric Properties of the RPQ
The RPQ's reliability and validity has been investigated as a unidimensional scale. Key psychometric properties have been reported across several studies. Within the domain of reliability, internal consistency, ɑ = .92, Split-half reliability, ɑ = .85 in a non-clinical sample (Sullivan & Garden, Reference Sullivan and Garden2011), test–retest reliability (24 hours), r = .90 (range r =.50–.91, with r > .80 for 8/15 items). With alternating interviewers (9 days apart), r = .87 (range r =.47–.10, with r >.80 for 4/15 items) (King et al., Reference King, Crawford, Wenden, Moss and Wade1995; Tate, Reference Tate2010).
Within the validity domain, convergent validity with the British Columbia Post-concussion Symptom Inventory, r = .59, Post-Concussion Syndrome Symptom Scale, r =.74 in a non-clinical sample (Sullivan & Garden, Reference Sullivan and Garden2011). Concurrent validity with Hospital Anxiety and Depression Scale (HADS) Anxiety, r = .45, HADS Depression, r = .32, IES Intrusions, r = .33, and IES Avoidance, r = .37 (King, Wenden, Caldwell, & Wade, Reference King, Wenden, Caldwell and Wade1999; Tate, Reference Tate2010). With the BDI II in a non-clinical sample, r = .66 (Sullivan & Garden, Reference Sullivan and Garden2011). Predictive validity RPQ at 7–10 days post-trauma with 6 month scores on RPQ, r = .37, with HADS Anxiety, r = .61, HADS Depression, r = .61, IES Intrusions, r = .33, and IES Avoidance, r = .50 (King et al., Reference King, Wenden, Caldwell and Wade1999; Tate, Reference Tate2010).
The results of these studies show the RPQ items together have good internal consistency, temporal stability and convergent validity. However, there has been disagreement regarding the construct validity, particularly the factor structure of the items. Several studies using classical test theory approaches, and Rasch analyses, have shown the RPQ is not well represented as a single scale (Eyres et al., Reference Eyres, Carey, Gilworth, Neumann and Tennant2005; Herrmann et al., Reference Herrmann, Rapoport, Rajaram, Chan, Kiss, Ma and Lanctôt2009; Lannsjö, Borg, Björklund, Af Geijerstam, & Lundgren-Nilsson, Reference Lannsjö, Borg, Björklund, Af Geijerstam and Lundgren-Nilsson2011; Lannsjö et al., Reference Lannsjö, Geijerstam, Johansson, Bring and Borg2009; Potter et al., Reference Potter, Leigh, Wade and Fleminger2006).
Research Examining the Structure of the RPQ
The first of these studies was by Eyres et al. (Reference Eyres, Carey, Gilworth, Neumann and Tennant2005) and used a sample of 369 adults. Internal construct validity was tested by item fit to a Rasch measurement model. The results indicated the items were not unidimensional (item fit mean –0.416, SD = 1.989, X2 = 172.486, p < .01). However, when the items headaches, dizziness and nausea were removed, the fit of the remaining 13 items was adequate, and Eyres et al. (Reference Eyres, Carey, Gilworth, Neumann and Tennant2005) suggested RPQ items were better represented as these two scales (RPQ 13 and RPQ 3). The test–retest reliabilities of the RPQ 13-item and RPQ 3-item scales were shown to be adequate r = .89 and .72 and to correlate with the Rivermead Follow-up Questionnaire r = .83 and r = .62 (Eyres et al., Reference Eyres, Carey, Gilworth, Neumann and Tennant2005). These results seemed consistent with the idea of ‘early’ and ‘late’ symptoms proposed by Ryan and Warden (Reference Ryan and Warden2003) and raised the question as to whether the structure of the RPQ remains constant over time following mTBI. Whilst Eyres et al. (Reference Eyres, Carey, Gilworth, Neumann and Tennant2005) provided evidence that the RPQ items were not properly represented as a single scale, the findings of this research have not been replicated adequately by other studies (e.g., Lannsjö et al., Reference Lannsjö, Borg, Björklund, Af Geijerstam and Lundgren-Nilsson2011).
In a study of 168 adults with TBI, Potter et al. (Reference Potter, Leigh, Wade and Fleminger2006) tested the fit of 1-, 2- and 3-factor models of the RPQ. They noted the distributions of the items were significantly skewed and employed a bootstrapping procedure and the Bollen–Stine probability value to determine whether the data fitted each model (fit if p ≥ 0.05). Results using this method were unaffected by problems of non-normally distributed data (Kim & Millsap, Reference Kim and Millsap2014). While the items were correlated, results indicated the data were a poor fit to the single factor model. The data fitted the ‘rationally-derived’ three dimensions proposed by Smith-Seemiller, Fow, Kant and Franzen (Reference Smith-Seemiller, Fow, Kant and Franzen2003). However, strong relationships were observed between mood and somatic items, leading the researchers to combine these items into a single factor, leaving the three cognitive items as a second factor. Good fit was found for this two-factor model. The finding that the RPQ double vision item was extremely skewed, led the researchers to remove it from all modelling analyses. Unfortunately, the approach used in this study could not differentiate between the two- and three-factor models, and the relatively small sample utilised may have produced unstable results (Tabachnick & Fidell, Reference Tabachnick and Fidell2013).
In research on 207 adults with mild to moderate TBI, Herrmann et al. (Reference Herrmann, Rapoport, Rajaram, Chan, Kiss, Ma and Lanctôt2009) reported factor analysis results, which identified three factors using eigenvalues >1 and Varimax rotation. Item loadings > .40 were selected into the model: Factor 1: Mood/Cognitive items accounted for 45.7% of the variance, Factor 2: General somatic accounted for 11.29% of the variance and Factor 3: Visual Somatic accounted for 7.49% of the variance. This model was similar to that reported by Potter et al. (Reference Potter, Leigh, Wade and Fleminger2006) (based on Smith-Seemiller et al. Reference Smith-Seemiller, Fow, Kant and Franzen2003), in separating the somatic, and visual items, from the cognitive items, but the grouping of cognitive and mood items together appeared different and pointed to the likely instability of the structure, possibly due to relatively small sample size.
Lannsjö et al. (Reference Lannsjö, Geijerstam, Johansson, Bring and Borg2009) reported results of factor analyses of a large sample (2523 Swedish adults with mTBI), surveyed three months following injury. Results identified symptoms compatible with a strong single common factor. The data adequately fitted Potter et al. (Reference Potter, Leigh, Wade and Fleminger2006) two-factor model, Smith-Seemiller et al. (Reference Smith-Seemiller, Fow, Kant and Franzen2003) three-factor model (examined using confirmatory factor analysis (CFA) by Potter et al. Reference Potter, Leigh, Wade and Fleminger2006), and a four-factor model, in which auditory and visual items formed a fourth factor. Whilst these findings supported separable somatic, cognitive and emotional symptoms following TBI (Lannsjö et al., Reference Lannsjö, Geijerstam, Johansson, Bring and Borg2009), the methods for identifying the adequacy of these different models were not clearly reported and no method was used to point to a preferred model. These researchers examined this sample utilising Rasch analyses in a separate study (Lannsjö et al., Reference Lannsjö, Borg, Björklund, Af Geijerstam and Lundgren-Nilsson2011). Like Eyres et al. (Reference Eyres, Carey, Gilworth, Neumann and Tennant2005), they concluded RPQ items could not be represented as a unidimensional scale and suggested there could be three or more dimensions. However, they did not present a final structure.
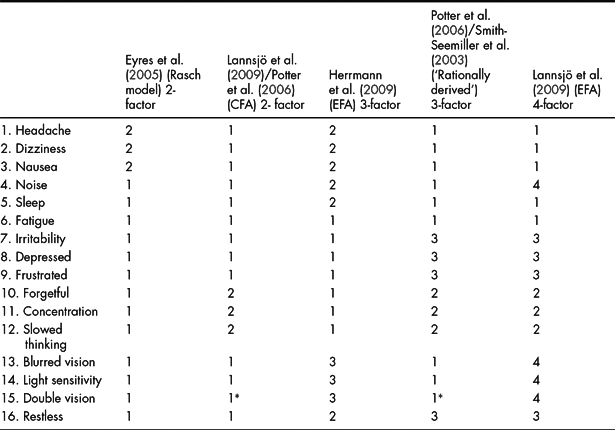
In summary, research has consistently pointed to RPQ items being inadequately represented by a single scale. The allocation of items to the different factors reported by these studies is presented in Table 1. Studies to date have not identified a preferred factor structure for use in clinical practice and clinical research. As clinical research depends on measures having clear construct validity, it is important that further research identifies the structure best supported by rigorous statistical analysis and with good clinical utility. Additionally, as there may be differences in the way participants from various cultural backgrounds interpret and respond to RPQ items, we felt it was important to conduct our study with a representative sample of Australians with TBI. The aims of the present study were to compare the fit of published RPQ factor structures with the structure suggested by exploratory factor analysis (EFA) in a representative Australian sample of adults with TBI and to examine outcomes on these factors to 12 months following injury.
Item Allocations to Factor Models of the RPQ

*The Double vision item was removed from Potter et al. (Reference Potter, Leigh, Wade and Fleminger2006) analyses, due to severe skew and kurtosis, but was included in Lannsjö et al. (Reference Lannsjö, Geijerstam, Johansson, Bring and Borg2009) analyses.
Method
The present study utilised a cross-sectional design to examine the RPQ responses of a sample of adults with TBI approximately one month after injury. From the results of these analyses, the fit of the best model and the recovery trajectories of participants on these factors were then examined at three months, six months and 12 months following TBI.
Participants
Archival data were provided by the Neurotrauma Register of Tasmania (NTR), a project funded by the Tasmanian Motor Accident Insurance Board. The NTR conducted a population-based prospective TBI outcome study in southern Tasmania, from December 2003. The project recruited adult volunteers who presented to the Department of Emergency Medicine and other wards at the Royal Hobart Hospital (RHH), and met criteria for a diagnosis of TBI (Langley, Johnson, Slatyer, Skilbeck, & Thomas, Reference Langley, Johnson, Slatyer, Skilbeck and Thomas2010).
This diagnosis was made by trained research staff who, after interviewing the participant, concluded there was evidence of a period of loss of consciousness, transient confusion or post-concussive symptoms following trauma involving the head. Participants were excluded from this data collection if they were younger than 16 years or had progressive neurological disease. Assessments were conducted in the offices of the NTR, on the RHH wards and on visits to participants’ homes. Participants were followed up with a battery of demographic, injury related, medical, cognitive and psychosocial measures at regular time intervals following injury (Langley et al., Reference Langley, Johnson, Slatyer, Skilbeck and Thomas2010). Data from 661 adults were utilised in the present study and characteristics of the sample are presented in the Results section.
Procedure and Analyses
Ethical approval was gained from the Southern Tasmania Health and Medical Human Research Ethics Committee. NTR research staff identified potential participants presenting with head injury from the Emergency Department Information System at the RHH. These patients were then interviewed to confirm their eligibility for the study. Consenting participants were initially screened with the Mini-Mental State Examination, (Folstein, Folstein, & McHugh, Reference Folstein, Folstein and McHugh1975) and if scoring 23 or greater, completed a battery comprising neuropsychological measures and other questionnaires. Participants experiencing more severe TBI were interviewed as soon as they emerged from post-traumatic amnesia (PTA).
The study utilised a data set comprising participants who completed the RPQ at approximately one month following injury. Admission to the study was restricted to those who had provided responses within a period of 21–42 days following injury. The final group of 661 participants admitted to the present study returned responses to the RPQ on average, 30.35 days following injury (SD = 4.80), with many of them also providing RPQ responses at 3, 6 and 12 months after injury. As already described, participants completed the RPQ as part of a larger battery of measures.
EFA was undertaken with the data of the first 330 participants in the data set, using a principal axis factor analysis, with varimax rotation. Orthogonal rotation is preferred when solutions will be used for further group comparisons (Tabachnick & Fidell, Reference Tabachnick and Fidell2013). As this research also compared the fit of this solution with these participants over several time points following injury, varimax rotation was used in this analysis.
The fit of the model suggested by the EFA was assessed and compared with the models identified in the literature using CFA undertaken on the second half of the present sample, n = 331 participants, with the Analysis of Moment Structures (AMOS v.20) software package. This model was initially assessed and subsequently refined using modification indices. As the RPQ items were significantly positively skewed, goodness-of-fit tests included bootstrapping for model comparison (Arbuckle, Reference Arbuckle2007; Bentler & Bonnet, Reference Bentler and Bonnet1980; Linhart & Zuchini, Reference Linhart and Zuchini1986; Randall, Thomas, Whiting, & McGrath, Reference Randall, Thomas, Whiting and McGrath2016; Thomas, McGrath, & Skilbeck, Reference Thomas, McGrath and Skilbeck2012).
Results
These are presented in six sections. First, the characteristics of the sample are described. The distributions of the RPQ items are examined within the full sample of 661 at approximately one month after TBI, followed by investigation of item inter-correlations. An EFA is then presented utilising the first half of the sample. Using data from the second half of the sample, a comparison of the fit of the various models identified in the literature is presented. Last, the fit of the preferred model and changes in factor scores are presented across time-points within the first year following TBI.
Characteristics of the Sample
Data from 661 adults were utilised in the present study, approximately two-thirds of the sample being male (63.84%). Participants’ mean age was 36.99 years (SD = 17.62, Median = 31.84), with a range of 16–91 years. They reported an average of 11 years of education (SD = 2.34). Participants were injured whilst undertaking a variety of activities, including transport accidents 268 (40.54%), assaults 169 (25.57%), falls 138 (20.88%) and sports activities 37 (5.60%). A relatively small number of participants were injured engaging in other activities (7.41%).
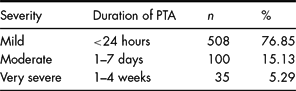
The proportion of participants in each category of severity of injury was based on length of PTA, described by the VA/DoD Clinical Practice Guideline taxonomy (VA/DoD, 2009) and is shown in Table 2. For inpatients, PTA was measured with the Westmead PTA Scale, with outpatient participants providing a retrospective estimate of the duration of their PTA. Demographic characteristics were generally similar to TBI samples studied in previous Australian epidemiological research (Hillier, Hiller, & Metzer, Reference Hillier, Hiller and Metzer1997; Tate, McDonald, & Lulham, Reference Tate, McDonald and Lulham1998).
Severity of Traumatic Brain Injury (based on VA/DoD Clinical Practice Guideline (VA/DoD, 2009))

Note. Missing records were returned for 18 participants (2.72%).
Distributions of the RPQ Items
The scale properties of the RPQ were considered in light of Eyres et al. (Reference Eyres, Carey, Gilworth, Neumann and Tennant2005) and Lannsjö et al. (Reference Lannsjö, Borg, Björklund, Af Geijerstam and Lundgren-Nilsson2011) suggestion that they may be improved by collapsing some response categories together. Whilst a full investigation of this issue is beyond the scope of the present study, we felt there were good reasons to collapse the first and second categories together into a single category (0 = not experienced and 1 = no more of a problem), to indicate no problem was experienced. In the original RPQ development study, King et al. (Reference King, Crawford, Wenden, Moss and Wade1995) recommended PCS scores were taken as the sum of all symptom scores, excluding ratings of 1, because these indicated that the symptoms were unchanged from before the injury. Further research has adopted this method (e.g., King et al., Reference King, Wenden, Caldwell and Wade1999). Collapsing these categories provided a more accurate reflection of participants’ current state on the RPQ items.
The present study utilised four categories on which participants rated the RPQ items/problems compared with their pre-TBI functioning (1 = no problem/no longer a problem, 2 = mild problem, 3 = a moderate problem, 4 = a severe problem). The distributions of RPQ items are presented in Table 3, showing items were significantly positively skewed, in that participants’ ratings were generally towards the mild end of the severity spectrum. The median scores were also noted to be 1.00, except for RPQ item 6-Fatigue, where a median score of 2.00 was noted. Inspection of these findings and histograms for the RPQ items confirmed they were not normally distributed.
Distributions of RPQ items (n = 661)

Note. Standard error of skew = .095. Skew ratio = Skew/Standard error of skew.
Inter-correlations of RPQ Items
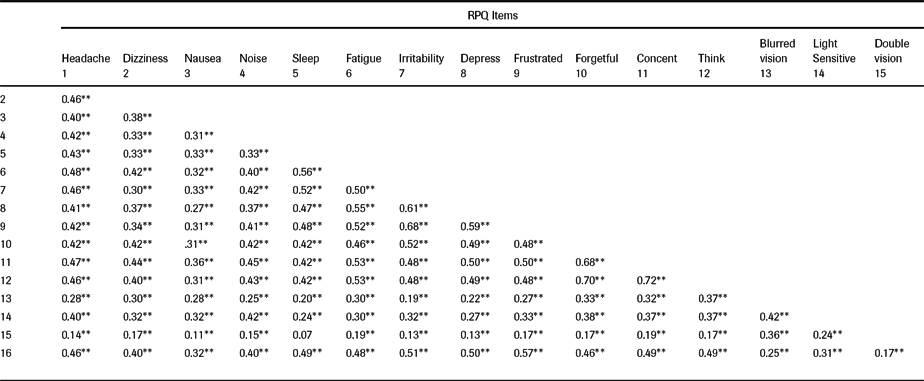
Inter-relationships of items were explored to understand the strength of correlation between items and to identify any groupings of particularly related items. Spearman's Rho was utilised as this method was not affected by non-normal item distributions. Table 4 shows that most items were significantly inter-correlated, with some appearing to be most closely inter-related. For example, cognitive items 10 (forgetfulness), 11 (poor concentration) and 12 (taking longer to think) were more strongly inter-correlated, ranging from .68 to .72, p < .001. There were also some strong relationships between mood items 7 (irritability), 8 (depression) and 9 (frustration), their moderate inter-correlations ranging between .59 and .69, p < .01.
Spearman's Rho Inter-correlations between RPQ Items (n = 661)

*p < .05, **p < .01
Exploratory Factor Analysis
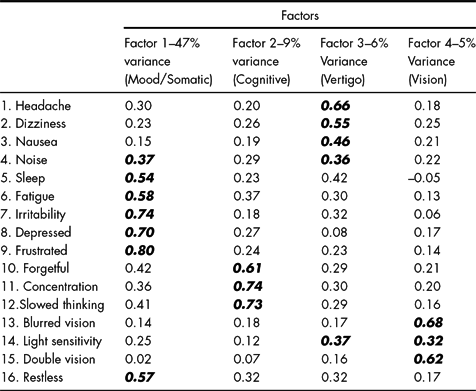
An EFA was undertaken on items using responses from the first half of the sample, n = 330, and principal axis factoring and varimax rotation. The results indicated two factors had Eigen values >1 and accounted for 56.19% of the variance. However, a further two factors accounted for more than 5% of additional variance, leading to the total variance explained by a four-factor solution to 67%. The scree plot indicated a four-factor solution was acceptable. Factor loadings for the items are presented in Table 5 and, as was shown in Table 4, some items were moderately inter-correlated, and a few items appeared to load onto more than one factor. Determination of which factors these latter items should be allocated to was by selecting the factor upon which each item loaded most strongly. Using this approach, each item was clearly allocated to a single factor, except for item 4-Noise sensitivity and item 14-Light sensitivity, where both loaded in the range .30–.40 for two factors. The strength of the relationships of these cross-loaded items with their respective factors was further examined using structural equation modelling.
Exploratory Factor Structure of the RPQ Approximately One Month following TBI (n = 330)

Note. Items with highest loadings on each factor are shown in bold and italics text.
Model Fit Comparisons
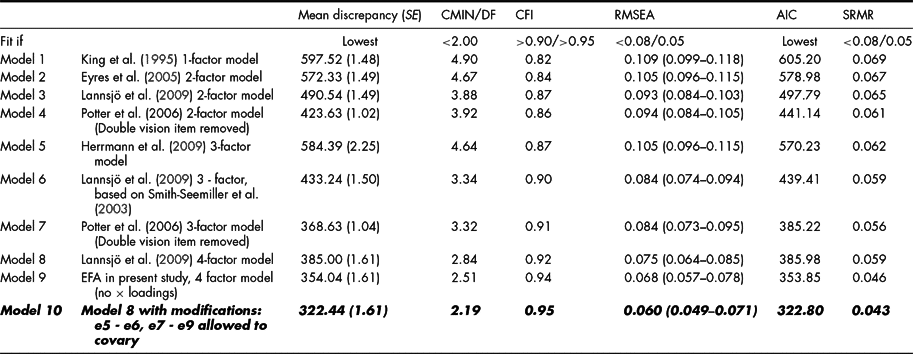
The main aim of this study was to compare the fit of RPQ data to the eight factor structures identified from the literature with the structure identified from the EFA conducted with the first half of the current sample. Each of the eight models had been established with factor analyses or Rasch analyses, in separate samples. Prior to undertaking this comparative analysis of factor structures, it was noted that the distributions of the RPQ domains were positively skewed. Therefore, a procedure that included bootstrapping for model comparison was adopted, as it is not affected by abnormally distributed data.
For each of the nine models, the mean discrepancy between implied moments obtained from the bootstrap sample and the moments from the bootstrap population were compared. The lowest mean discrepancy indicated the model with best fit (Arbuckle, Reference Arbuckle2007; Linhart & Zuchini, Reference Linhart and Zuchini1986). In addition, the hypothesised models were each tested using Chi square analysis, the results for each being significant. Whilst significance can indicate poor model fit, Ullman (Reference Ullman, Tabachnick and Fidell2001) asserted that differences between sample and estimated population covariance matrices can give inaccurate results and suggested using a range of Goodness-of-Fit Indices. Multiple Goodness-of-Fit tests included the minimum discrepancy divided by degrees of freedom (CMIN/DF, Ullman, Reference Ullman, Tabachnick and Fidell2001), Comparative Fit Index (CFI, Bentler, Reference Bentler1988), Root Mean Squared Error of Approximation (RMSEA, Browne & Cudeck, Reference Browne and Cudeck1993), Aikake Information Criterion (AIC, Akaike, Reference Akaike1987), and Standardised Root Mean Square Residual (SRMR, Hu & Bentler, Reference Hu and Bentler1999). The results of these analyses are presented in Table 6, comparing the fit of models ranging from one to four factors and including comparisons of fit for factor models with and without the RPQ double vision item.
Comparison of the Fit of RPQ Factor Models using CFA (n = 331)

Note. The data best fit the model with results in bold and italics text.
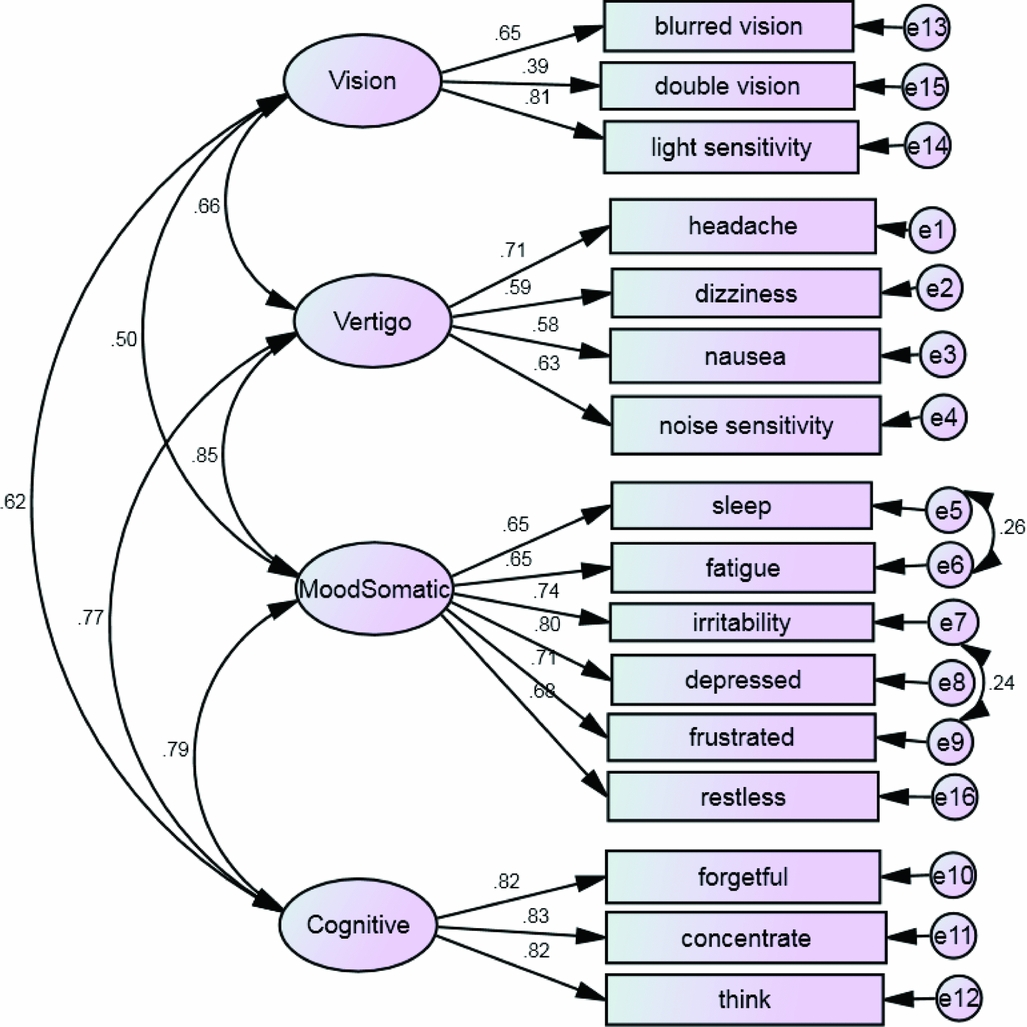
As already noted, the double vision item was removed from Potter et al.'s (Reference Potter, Leigh, Wade and Fleminger2006) analyses. In summary, the results showed the four-factor model, tested in the second half of the sample (n = 331) had best fit across the indices. Although two items were found to cross-load in the EFA (Noise sensitivity and Light sensitivity), in initial modelling, each was found to relate more strongly to a single factor. Noise sensitivity was most strongly related to the Vertigo factor β =.42 over β =.22 on Mood/Somatic, and light sensitivity most strongly related to the Vision factor β =.56 vs. Vertigo β =.25. Therefore, these items were allocated to the factor to which they most strongly related. The four-factor model is presented in standardised form in Figure 1.
Model 10: Four factor model of the RPQ.

Model Fit and Changes in Factor Scores in the First Year following TBI
The fit of the four-factor model was assessed within subsamples at 3, 6 and 12 months. Effect size changes (Cohen's d, with pooled SD) were calculated to compare the distributions at these time-points with the 1-month time-point and to compare changes serially over time. This provided information regarding the clinical utility of the four factors. Internal consistencies for the first three factors appeared adequate, while the fourth was marginally acceptable over the time-points. These results are presented in Table 7, showing the data to 12 months post-TBI, generally fit the four-factor model.
Comparison of RPQ factor scores over time points following TBI

Note. Effect sizes: Cohen's d between each time-point (d serial), Cohen's d between 1 Month and subsequent time-points (d 1 Month)
Weak to moderate effect size changes were observed over the time points, with the strongest effects seen for Factor 1: Mood/Somatic and weakest for the Factor 4: Vision. The differences in recovery trajectory between the factors over these time-points following TBI pointed to the clinical usefulness of use of this multi-factorial model of the RPQ items.
Discussion
The aim of this study was to compare the fit of the published factor structures for the RPQ with the structure suggested from EFA in a representative Australian sample of adults with TBI. The study also examined outcomes on these factors to 12 months following injury. A number of studies have reported a variety of factor structures for the RPQ, which has created confusion about which was most statistically robust and clinically useful. It was therefore important that the fit of each of these structures was compared, utilising data from a sufficiently large local sample. Additionally, the present study provided an updated review of the research literature regarding the construct validity of the RPQ and utilised statistical methods capable of distinguishing a best fitting model.
The present study identified a four-factor structure and compared this with one-, two-, three- and four-factor structures identified from the literature. The main finding was that the data were best fit to the four-factor structure identified from exploratory analyses within a separate local sample. There were also a number of other interesting findings, which helped to illuminate the nature of RPQ items and to explain the existence of the differences in the structure of the scales identified in previous research.
Within the preliminary analyses, examination of the distributions of items showed all were severely skewed, a finding reported by other key studies (Lannsjö et al., Reference Lannsjö, Geijerstam, Johansson, Bring and Borg2009; Potter et al., Reference Potter, Leigh, Wade and Fleminger2006). Positively skewed item distributions were expected, as higher ratings on items indicate greater problems and most of the present sample suffered mTBI. Statistical methods which either relied on non-parametric methods or were robust to non-normal data were therefore utilised in the present study.
Utilising Spearman's correlations, all items were significantly interrelated, except for 5- Sleep and 15- Double vision. With the exception of vision items, most items were moderately inter-correlated. The strength and pattern of relationships between items were consistent with those reported by Lannsjö et al. (Reference Lannsjö, Geijerstam, Johansson, Bring and Borg2009) and Potter et al. (Reference Potter, Leigh, Wade and Fleminger2006). Of particular note in the present study were the relatively stronger relationships between items representing cognitive functioning 10-Forgetfulness, 11-Poor concentration and 12-Taking longer to think, and mood 7- Irritability, 8- Depression and 9- Frustration, pointing to the likelihood of them forming factors.
An interesting finding across previous studies, replicated in the present study, was that principal components analyses of the RPQ items extracted a first major factor, which accounted for a very large proportion of the total variance. For example, Herrmann et al.’s (Reference Herrmann, Rapoport, Rajaram, Chan, Kiss, Ma and Lanctôt2009) first factor accounted for 45.7% of the variance and had an eigenvalue of 7.29 and Lannsjö et al. (Reference Lannsjö, Geijerstam, Johansson, Bring and Borg2009) first factor had an eigenvalue of 7.92. In the present study, Factor 1 accounted for 47% of the variance. The items extracted for Factor 1, were generally similar to those found in a previous study by Lannsjö et al. (Reference Lannsjö, Geijerstam, Johansson, Bring and Borg2009), with some minor differences. These differences in structure may be explained by the relatively strong inter-relationships between RPQ items and small differences in responses to items that naturally occur across samples.
A four-factor structure was identified and confirmed as best fitting in the present study, generally similar to the four-factor structure reported by Lannsjö et al. (Reference Lannsjö, Geijerstam, Johansson, Bring and Borg2009), although there were some marginal differences in the constituent items that loaded onto the factors. As already noted, in Lannsjö et al.’s study items 5- Sleep and 6- Fatigue were extracted with the vertigo items (1-Headache, 2-Nausea and 3-Dizziness), whereas in the present study these items accompanied the mood items in the first factor. The results of both studies appeared very similar, in that mood, vertigo, cognitive and visual items constituted the factors. The cause of this slight difference in the constitution of the factors can be explained by the shared variance between most RPQ items, and it seems likely the results of any future factor analyses may produce marginal variability around these four main factors.
Results seemed consistent with the more general identification of these key factors among the items. Review of the pattern of results for the reported structures in Table 1 showed there were likely to be four key factors. These included a factor containing vertigo items (1-Headache, 2-Nausea and 3-Dizziness), seen in both Lannsjö et al.’s four–factor structure (2009) and Potter et al.’s (Reference Potter, Leigh, Wade and Fleminger2006) three-factor structure, with mood items and cognitive functioning items forming separate factors. Additionally, Herrmann et al.’s (Reference Herrmann, Rapoport, Rajaram, Chan, Kiss, Ma and Lanctôt2009) and Lannsjö et al. (Reference Lannsjö, Geijerstam, Johansson, Bring and Borg2009) studies both identified a separate factor consisting of the visual items.
The results of previous research supported the separation of the visual items from the other RPQ items. For example, only a small proportion of the samples in previous studies had endorsed problems with these visual items (Herrmann et al. Reference Herrmann, Rapoport, Rajaram, Chan, Kiss, Ma and Lanctôt2009; Lannsjö et al., Reference Lannsjö, Geijerstam, Johansson, Bring and Borg2009; Potter et al., Reference Potter, Leigh, Wade and Fleminger2006). The visual items also tended to be less strongly related to other items, so it seemed separation of these items made good clinical sense. The present study supported the existence of a visual scale within the results of the CFA, and these items had marginally acceptable internal consistency.
The data across time points to 12 months following TBI fitted the four-factor structure, demonstrating its stability within the first year after injury. The full sample (n = 661) was utilised at the 1 month time-point. Examination of differences in effect size changes across the time points showed there were some differences between the four factors in the trajectories of recovery. Most improvement of symptoms occurred across all four factors by six months following TBI, consistent with previous research examining recovery of PCS (Carroll et al., Reference Carroll, Cassidy, Peloso, Borg, Von Holst, Holm and Pépin2004).
There were some important differences noted in the relative strength of changes observed between the factors over time post injury. The largest improvement in functioning occurred on Factor 1: Mood/Somatic, with similar effect size changes seen between one and three, and three and six, months. A relatively strong improvement was seen on Factor 3 Vertigo to three months, and modest improvement on Factor 2: Cognitive items to three months and six months. These findings do not support Ryan and Warden's (Reference Ryan and Warden2003) proposed ‘early’ and ‘late’ symptoms. That is, that the vertigo symptoms would be experienced most strongly immediately post injury and that the mood, cognitive and somatic symptoms would develop over days/weeks after injury. However, the time points of the present study were not consistent with those originally proposed by Ryan and Warden (Reference Ryan and Warden2003).
Relatively smaller changes were noted on Factor 4: Vision, probably because fewer people rated problems with vision. It may also be that those with problems in aspects of visual functioning did not experience similar levels of improvement as they did in other functions, over these time points. Overall, the four-factor structure provided important clinically useful information to assist in differentiating between four key aspects of functioning after TBI.
There were some limitations in the present study, including the representativeness of the sample, caution regarding the metric and distributions of RPQ items and the use of cross-sectional samples to indicate the trajectory of recovery. The present study sought responses from adult volunteers who presented with TBI to the RHH. The sample obtained was generally representative of the TBI population across key demographic and injury variables. However, it was acknowledged there were a proportion of people with TBI who were not sampled in this study, as they did not present to hospital and either did not to seek treatment or sought care from primary health sources. Future research could seek to replicate the results of the present study in cohorts with TBI, particularly mTBI who did not present to hospital.
The ordinal categorical, four-point response scale challenged the assumptions of structural equation modelling. Research has shown that non-normal categorical data generally leads to underestimation of fit, inflating chances of a Type II error. This was effectively managed via bootstrapping for model comparison, which identified the best fitting model. The additional fit indices produced robust results, possibly aided by the large sample size and relatively small number of items (Byrne, Reference Byrne2013; Finney & DiStefano, Reference Finney and DiStefano2006).
Another limitation was the use of cross-sectional samples at time points to 12 months following TBI. Although it would have been preferable to utilise a longitudinal sample, the dataset size was severely restricted when data were selected from individuals who attended every time point of the study. As such, we calculated mean effect size changes between one month and subsequent time points, and between adjacent time points, to understand the recovery trajectories for the four factors. An important focus for future research will include understanding short- and longer-term TBI outcomes for these four factors.
There are several other interesting directions for future research, including replication of the four-factor structure in a range of international samples to investigate any differences in structure across countries. Future EFAs of the RPQ may have difficulty exactly replicating the results of the present study, but could confirm the validity of the four key factors in new samples. Research could investigate whether factor structure is affected by severity of injury and focus on understanding predictors of these four factors. Further work could establish predictive models that identify individuals at risk of persisting PCS. New interventions may prove to be effective in addressing specific groups of PCS and conceivably, measurement of outcomes is likely to be more sensitive using the appropriate RPQ factors over the RPQ total score.
In this study, we have addressed confusion as to the best factor structure for the RPQ. Research over the past 10 years has identified a number of viable models, but has not produced evidence for a preferred model. Our results identified a four-factor structure in a large sample of Australian adults with TBI. We compared the fit of this model with structures identified from the research literature within a separate representative sample, using analyses that were robust to problems of non-normal categorical data. Following research to replicate these results in international samples, clinicians and clinical researchers may use this model to provide more specific measurement of the severity of PCS.
Financial Support
This research received no specific grant from any funding agency, commercial or not-for-profit sectors.
Conflict of Interest
None.
Ethical Standards
The authors assert that all procedures contributing to this work comply with the ethical standards of the relevant national and institutional committees on human experimentation and with the Helsinki Declaration of 1975, as revised in 2008.