


Introduction
Entomological radars of both the azimuthally-scanning type (Drake, Reference Drake1981) and the newer vertically-pointing, nutating beam systems (Smith et al., Reference Smith, Reynolds and Riley2000; Drake, Reference Drake2002; Chapman et al., Reference Chapman, Reynolds and Smith2003) are designed to detect individual high-flying insects weighing more than a few milligrams. One of the most consistently observed features detected by these radars is mass emigration at certain times of day, manifested by huge numbers of insects ascending to heights of several hundred metres above ground. Although various taxa of insects may undertake flights at different times during the diel cycle (Lewis & Taylor, Reference Lewis and Taylor1964; Johnson, Reference Johnson1969), it is clear from radar observations that most high-altitude migratory flight starts either with (a) an almost ubiquitous mass take-off around dusk (see references in Gatehouse, Reference Gatehouse1997), stimulated by falling illumination levels (Schaefer, Reference Schaefer and Rainey1976; Riley & Reynolds, Reference Riley and Reynolds1979; Riley et al., Reference Riley, Reynolds and Farmery1983), or (b) take-off over a more extended period in the morning, typically after the sun has started to warm the surface giving rise to convective activity. Of these two types of migration, nocturnal migrants have been far more intensively studied by entomological radars than have insects which fly during the day, and the build-up of insect activity associated with thermal convection is perhaps best illustrated by time/height displays from vertically-pointing meteorological radars of various types (Ottersten, Reference Ottersten1970; Bean et al., Reference Bean, McGavin, Chadwick and Warner1971; Richter et al., Reference Richter, Jensen, Noonkester, Kreasky, Stimmann and Wolf1973; Campistron, Reference Campistron1975; see also below). However, some daytime observations have been made with entomological scanning radars, for example, on concentrations of insects organised into cellular patterns under the influence of convective processes (e.g. Schaefer, Reference Schaefer and Rainey1976; Reid et al., Reference Reid, Wardhaugh and Roffey1979).
Occasionally, however, a third type of emigration event is observed, where insects engage in a usually short-lived migratory or dispersal flight around dawn. For example, regular dawn flights have been observed in African armyworm moths (Spodoptera exempta (Walker)) in Kenya (Riley et al., Reference Riley, Reynolds and Farmery1981, Reference Riley, Reynolds and Farmery1983) and in micro-insects (particularly planthoppers, leafhoppers and heteropterans) associated with rice cultivations in the Philippines (Riley et al., Reference Riley, Reynolds and Farrow1987) and China (Riley et al., Reference Riley, Cheng, Zhang, Reynolds, Xu, Smith, Cheng, Bao and Zhai1991, Reference Riley, Reynolds, Smith, Rosenberg, Cheng, Zhang, Xu, Cheng, Bao, Zhai and Wang1994). Mass flight at dawn is usually less intense than the corresponding dusk flight; and it can be absent altogether, particularly in temperate regions, presumably because dawn temperatures are too low for take-off (Riley et al., Reference Riley, Cheng, Zhang, Reynolds, Xu, Smith, Cheng, Bao and Zhai1991).
Although all the dawn flights are probably triggered by steadily rising illumination, they may occur under radically different light levels. For example, the dawn flights of S. exempta started when it was still very dark to the human eye (irradiance values of 5×10⁻⁷ to 2×10⁻⁸ Wm−2 nm–1 in the 450–800 nm band) and were observed to end abruptly by the end of dawn twilight (irradiance of ~7×10⁻⁵ Wm−2 nm–1) as the moths landed and rapidly sought day-time shelters, presumably as an adaptation against bird predation. In contrast, the dawn emigration flights of rice micro-insects in China, largely the planthopper Nilaparvata lugens (Stål), started when it was relatively light (middle distance features were becoming visible to the human eye); these flights could continue for an hour or two into the day, and sometimes formed discrete layers (Riley et al., Reference Riley, Cheng, Zhang, Reynolds, Xu, Smith, Cheng, Bao and Zhai1991, Reference Riley, Reynolds, Smith, Rosenberg, Cheng, Zhang, Xu, Cheng, Bao, Zhai and Wang1994). Richter et al. (Reference Richter, Jensen, Noonkester, Kreasky, Stimmann and Wolf1973), observing in southern California, noted a post-sunrise increase in insect numbers between about 50 and 300 m above ground, which continued for about three hours.
It should be noted that dawn flights, in the sense used here, arise from take-off around dawn and are to be distinguished from migratory flights that have apparently continued all night and have persisted (as elevated layers) into the daylight (Greenbank et al., Reference Greenbank, Schaefer and Rainey1980; Drake et al., Reference Drake, Helm, Readshaw and Reid1981; Drake, Reference Drake1984; Riley et al., Reference Riley, Cheng, Zhang, Reynolds, Xu, Smith, Cheng, Bao and Zhai1991). One circumstance where this occurs is when nocturnal migrants find themselves over the sea at daybreak (Laird, Reference Laird1962; Drake et al., Reference Drake, Helm, Readshaw and Reid1981; Wolf et al., Reference Wolf, Sparks, Pair, Westbrook, Truesdale and Danthanarayana1986a). In some cases, both types of layer (i.e. from a dawn emigration and from all-night flight) are present at the same time (Irwin & Thresh, Reference Irwin and Thresh1988; Riley et al., Reference Riley, Cheng, Zhang, Reynolds, Xu, Smith, Cheng, Bao and Zhai1991).
The recent deployment of vertical-looking entomological radars (VLRs) in the UK has allowed us to systematically observe high-altitude insect movement in northern Europe for the first time, and we are presently in the process of characterizing the various phenomena made visible (mass emigration, layering, instances of common orientation, etc.) (Chapman et al., Reference Chapman, Reynolds and Smith2003; Reynolds et al., Reference Reynolds, Chapman, Edwards, Smith, Wood, Barlow and Woiwod2005, Wood et al., Reference Wood, Chapman, Reynolds, Barlow, Smith and Woiwod2006). Analysis of long-term data sets from the VLRs showed that a radar-detectable dawn take-off was quite common during the summer months in the UK, but that it was often brief and poorly developed. Occasionally, however, the dawn emigration gave rise to very well-defined and striking layers, which persisted at altitude for some hours. Because this phenomenon has received little systematic study from an entomological point of view, we believe it is worthwhile to place these observations of dawn layers on record, even though the insect species involved have yet to be determined.
Methods
Radar data
The entomological radars were sited at Rothamsted, Harpenden, Hertfordshire (lat. 51°48′32″N, long. 0°21′27″W ca. 120 m asl) and at Malvern, Worcestershire (at lat. 52°7′54″N, long. 2°19′55″W ca. 86 m asl in the case studies before September 2001, and after at a nearby site 52°06′04″N, long. 2°18′38″W ca. 59 m asl). Both radars (VLRs) project a vertical-looking, circularly-symmetric beam in which the plane of linear polarisation is continuously rotated at about 5.8 Hz. In addition, the beam nutates due to a slight offset (0.1 beam widths) in the antenna feed, producing a narrow-angle conical scan. Data was recorded during 5-min sampling periods, repeated every 15 min, 24 h per day. Return signals from individual insect targets flying through the radar beam were detected in one of 15 range-gates (sampling volumes), which together gave coverage from 150 m to 1188 m above the ground. The radar analysis programme routinely extracted a range of parameters from the detected targets (horizontal speed, displacement direction, body alignment, and terms from which the target's mass and shape can be estimated, Chapman et al., Reference Chapman, Smith, Woiwod, Reynolds and Riley2002a). Some of these parameters can only be estimated reliably if targets are well described by the underlying analysis model (Smith et al., Reference Smith, Riley and Gregory1993); for these ‘good’ targets (Reynolds et al., Reference Reynolds, Chapman, Edwards, Smith, Wood, Barlow and Woiwod2005), it is practicable to convert numbers detected into aerial densities (expressed here as the number of insects per 107 m3) (Chapman et al., Reference Chapman, Smith, Woiwod, Reynolds and Riley2002a). Normally, only targets of mass >10 mg were included when calculating the aerial density profiles in the present study because insects of this size were readily detectable at all the heights at which dawn layers were observed.
The VLR system also records the percentage of time the received signal power is above certain threshold levels (Reynolds et al., Reference Reynolds, Chapman, Edwards, Smith, Wood, Barlow and Woiwod2005). These ‘percentage above threshold’ values provide a measure of the biomass of insects flying and are particularly useful in situations where aerial densities are too high for individual targets to be resolved by the radar. ‘Percentage above threshold’ values, presented in this paper, refer to those taken from the −80 dBm level only (a convenient point above the receiver noise level). Further details of the radar system, its mode of operation and analysis protocols, including target identification procedures, have been described elsewhere (Smith et al., Reference Smith, Riley and Gregory1993; Smith et al., Reference Smith, Reynolds and Riley2000; Chapman et al., Reference Chapman, Smith, Woiwod, Reynolds and Riley2002a, Reference Chapman, Reynolds and Smith2003; Reynolds et al., Reference Reynolds, Chapman, Edwards, Smith, Wood, Barlow and Woiwod2005).
The radar database was scanned for evidence of layering using a ‘Visual Basic’ module, which returned a ‘Layer Quality’ code (a number from 0–7) indicating the layering status of each vertical profile (see Reynolds et al., Reference Reynolds, Chapman, Edwards, Smith, Wood, Barlow and Woiwod2005), taking into account the numbers of all resolvable targets and the ‘percentage above threshold’ values. The structure and intensity of insect activity around dawn was also examined by looking at time/height diagrams (‘Quickviews’, see fig. 2) generated for each day by a ‘MatLab’ programme which used colour to depict insect aerial abundance categories. If strong layering was seen to develop after a dawn take-off, the relevant profiles were then examined in more detail.
Meteorological data
Upper air data from operational radiosonde stations in the UK synoptic network were acquired, mainly from a University of Wyoming website (http://weather.uwyo.edu/upperair/sounding.html). However, the phenomena described here took place between the standard midnight and 06.00 h sonde ascent times; and, in any case, there has been a trend towards fewer radio-soundings in the UK (fewer operational stations and fewer observations per day). Therefore, we have relied, to a large extent, on hourly predictions of meteorological variables generated from the operational mesoscale version of the Meteorological Office's Unified Model (UM) for the air columns over each of the radar sites (Wood et al., Reference Wood, Chapman, Reynolds, Barlow, Smith and Woiwod2006).
The ‘Weather Log’ published in Weather magazine (Royal Meteorological Society) and Roger Brugge's Weather Diary (http://www.met.rdg.ac.uk/~brugge/) were useful for general descriptions of the weather on the occasions studied.
Times referred to in this paper are in Coordinated Universal Time (UTC) (equal to Greenwich Mean Time), which is one hour earlier than British Summer Time.
Results
The diel pattern of insect activity recorded by the vertical-looking radar
Figure 1 is a time/height plot of insect numbers showing a good example of the diel pattern recorded by the VLRs in warm weather in summer. The sequence starts at about 11.00 h when there was considerable daytime activity with targets up to about 800 m, although the highest counts were at the lowest observable altitude (150–195 m). The mass take-off around dusk is an obvious feature in fig. 1, with large numbers of insects ascending from about 20.00 h onwards (sunset was at 20.34 h), and the peak of emigration was at about 20.45–21.00 h (the apparent decrease in the lowest range-gates at this time is probably due to a target ‘saturation’ effect). By 21.45 h, total insect numbers had declined; but an elevated layer formed at about 600 m, which persisted until about 01.00 h. The dawn take-off is evident at about 03.15 h, with a distinct increase in numbers in the lower range-gates (civil twilight began at 03.01 h); peak numbers occurred at about 03.30 h, and numbers had declined again by 04.15 h (sunrise was at 03.50 h). Although the dawn emigration was well developed on this occasion, activity was largely confined to below 400 m, and there was no evidence of persistent flight at altitude or the development of insect layers.
‘Quickview’ time/height plot of insect numbers recorded by the vertical-looking radar (VLR) at Malvern from 11.00 h on 25 June to 10.00 h on 26 June 2003. The colour key refers to the number of resolvable insect targets detected at each sampling height during each 5-min sampling period.

Presence of a dawn emigration
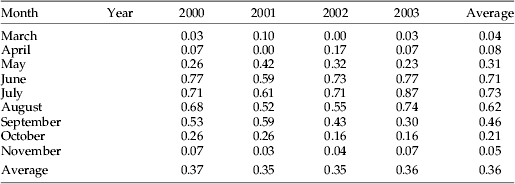
The frequency of a dawn emigration was assessed (by looking for the presence of a ‘blip’ in the daily time/height profiles around dawn) for the years 2000–2003 at Malvern (table 1). This showed that a dawn emigration, reaching radar-observable heights, occurred most commonly (~60–70% of mornings) in the months of June, July and August, less commonly (~20–50%) in May and September–October, and it was absent in winter. When present, the emigration was generally detectable soon after the beginning of civil twilight, with peak numbers occurring about 10–20 min before sunrise. Although the dawn emigration was usually easy to detect due to the lack of other insect activity on the radar at this time, it was generally a rather weak feature; and densities were low compared to those often recorded during daytime activity or following the dusk emigration. Sometimes, as in fig. 1, densities reached 250 per 107 m3 (~40 targets per 5-min sample) at ca. 300 m height; and occasionally (~2 or 3 times per year) the dawn take-off led to a persistent and well-defined layer at altitude (figs 2–7). This rather striking phenomenon forms the main subject of this paper.
‘Quickview’ time/height plots of insect activity recorded by the radar showing dawn and daytime insect layers. Insect numbers (see legend for fig. 1) on (a) 3 July 2001 at Malvern, (b) the same day at Rothamsted, (c) 7 August 2003 at Rothamsted (d) ‘Percentage above threshold’ values (see Methods section) for 7 August 2003 at Rothamsted.

Vertical distribution of insects as represented by numbers of targets recorded by the radar at Malvern at various times between 02.30 h and 06.15 h on the morning of 26 June 2001. The inset shows the semi-logarithmic relation of target numbers (n+1, plotted on a log scale) with height up to about 530 m, at 03.00 h. The R2 value for the regression line is shown on the graph.

Vertical distribution of insects and meteorological variables on the morning of 26 June 2001. (a) ●, Number of insects; ■, density of insects (numbers per 107 m3); and  , ‘percentage above threshold’ values, all derived from Malvern radar data recorded at 05.00 h. (b) ▼, Air temperature and x, wind speed profiles for Malvern at 05.00 h, derived from the Unified Model. (c) Air temperatures from radio-soundings at Aberporth (Ab), Larkhill (L), Nottingham (N) and Woodvale (W) at 06.00 h.

Vertical distribution of insects and meteorological variables on the morning of 3 July 2001. ●, Number of insects; ■, density of insects (numbers per 107 m3); and , ‘percentage above threshold’ values, recorded by the radar at (a) Malvern (04.30 h) and (b) Rothamsted (04.45). Unified Model estimates of (c) air temperature and (d) wind speed for: ◆, Malvern; and ▲, Rothamsted at 05.00 h.

Vertical distribution of insects and meteorological variables on the morning of 7 August 2003. ●, Number of insects; ■, density of insects (numbers per 107 m3); and , ‘percentage above threshold’ values, recorded by the Rothamsted radar at (a) 05.30 h and (b) 07.30 h. Unified Model estimates of (c) air temperature profile at Rothamsted at: ▼, 06.00 h; and ★, 08.00 h. (d) Air temperature profile for Malvern at 06.00 h.

Vertical distribution of insects and meteorological variables on the morning of 17 June 2000 at Malvern. ●, Number of insects; ■, density of insects (numbers per 107 m3); and , ‘percentage above threshold’ values, recorded by the radar at (a) 06.45 h and (c) 09.00 h. Unified Model estimates of: ◆, air temperature; and ▲, wind speed for Malvern (b) at 07.00 h and (d) at 09.00 h.

Proportion of days in the month when a dawn emigration was visible on the Malvern radar.
The radar database was examined for occasions in the summers of 2000–2004 when layers (arising from the dawn emigration) persisted as a distinct feature for two hours or more. Ten of these occasions were then chosen for more detailed analysis (table 2). This produced 12 cases for study because on two of the mornings the dawn layer was strongly developed at both the Malvern and the Rothamsted radar sites.
Examples of dawn layer occasions at Malvern or Rothamsted in summers 2000–2004.

An example: the evolution of the vertical distribution of insects on 26 June 2001
An example of the changes in the vertical distribution of insects during the dawn take-off and subsequent development of a high-altitude layer is shown for the morning of 26 June 2001 at Malvern (fig. 3). On this occasion, the number of insects in flight before dawn was very small at all altitudes (fig. 3a) and the dawn emigration was, therefore, easy to observe. By the beginning of civil twilight (03.03 h), insect numbers had increased dramatically at the lowest observable altitudes (fig. 3b), and the decline in numbers with height up to about 500 m was semi-logarithmic in form (fig. 3, inset) as often occurs during mass ascents following dusk take-off (Drake, Reference Drake1984). Many of the emigrants continued to ascend, and at 03.15 h there appeared to be a local density maximum at about 300 m above ground (fig. 3c). By 03.30 h, a local maximum was starting to form at 600 m, and this had become quite distinct by 03.45 h (fig. 3d). (Sunrise was at 03.50 h.) The 15-min intervals between radar observations were not frequent enough to make particularly accurate estimates of the insects' climb rate but many of them were able to ascend at least at 0.2 m s−1. The numbers of insects at the lowest observable altitudes declined quickly after 04.00 h, and most of the insects continuing in flight at altitude did so in the layer which was now centred at about 530 m and which persisted as a very distinct feature for the next two hours (e.g. figs 3e and 4a). After about 06.15 h, the profile of insect numbers became more complex, with concentrations of insect at heights above and below the main layer height (fig. 3f) although a layer continued to be distinguishable (particularly in the ‘percentage above threshold’ values) at 530 m, or later at 600 m, up until 08.45 h.
Persistence and termination of the flights
Flight termination in the insects forming the dawn layers was often difficult to observe due to the build-up in numbers of daytime migrants occurring from about 06.00–08.00 h onwards (probably associated with the development and upward extension of convection). The dawn layer was generally enveloped in these daytime insect concentrations and, sooner or later, ceased to exist as a separate feature (see fig. 2). Whether the dawn migrants continued in flight under daytime convective conditions was, thus, unclear.
The persistence of the dawn layers over several hours (median=2.5 h), together with the high displacement speeds of the constituent insects on some occasions, indicates that the layers were not geographically localized features. This conclusion is supported by the fact that dawn layers were sometimes detected simultaneously at Malvern and at Rothamsted, for example on 3 July 2001 when they persisted at 400 m altitude for three or four hours at each site (figs 2a,b and 5a,b).
Weather during the dawn layer occasions
Examination of the synoptic surface charts at midnight (00 UTC) (http://www.wetterzentrale.de/topkarten/fsfaxbra.html) reveals that on the selected dawn layer occasions, southern England was usually under the influence of an anticyclone often centred over the North Sea, with the southerly/south-easterly airflow on the west side of the anticyclone giving rise to fine weather and warm nights (see table 3, appendix). However, on a few of the selected occasions, the weather was more disturbed. For example, severe thunderstorms affected part of southern Britain on 4 July 2001, and thundery showers spread in during the day on 22 June 2003. It would appear that warm, thundery weather was conducive to dawn layers, as long as there was no actual precipitation during the dawn flight period.
(appendix). Weather associated with dawn layer occasions.

* Inversion strength is the temperature difference between the base and top of an inversion. In this case, we are only concerned with inversions occurring within ~1 km of the surface.
** (✓) inversion present; (I) isothermal layer; (×) no inversion at relevant altitude; (–) no data.
The dawn layer occasions studied here were often rather warm, especially considering that surface temperatures are often reaching a minimum at that time of the morning. The average temperature at ca. 2 m height around the time of take-off, over all the occasions/sites (n=12), was 15.7±1.5°C (s.d.). The corresponding average obtained from the UM data (for a height of 10 m) was 16.1±1.5°C. Some of the occasions studied had abnormally high minimum temperatures, as commented on in R. Brugge's Weather Diary for 26 June and 3 July 2001. On the latter occasion, for example, a surface temperature of 19°C was recorded around dawn take-off time at the Malvern site. Due to the presence of inversions (see below), temperatures aloft were usually even higher than those near the surface. Having said this, the lowest surface temperature at take-off, among the occasions studied, was 11.6°C – so, unusually high minimum temperatures were not essential for the phenomenon to occur.
As might be expected below a temperature inversion, surface wind speeds were always low on the dawn layer occasions (average=1.2 m s−1±0.6). Wind speeds at altitude were highly variable, however, depending on whether a strong nocturnal jet developed (Drake, Reference Drake1985).
Vertical profiles of temperature and wind speed during the dawn layer periods
Temperature profiles generated by the Unified Model (UM) for the radar sites during the dawn layer occasions usually revealed the presence of a distinct (~2°C) temperature inversion (or at the very least a small isothermal region) (table 3, appendix), which had formed during the previous night and continued for some hours into the daytime. The presence of inversions was confirmed by temperature profiles from the nearest radiosonde stations (table 3, appendix), particularly from the ascents made at 06.00 h. Thus, it was very probable that the insect layers were caused by dawn emigrants accumulating near the top of an inversion or in an isothermal region. For example, the strong layer which persisted at ca. 530 m height on the morning of 26 June 2001 at Malvern (described above) was near the top of a temperature inversion and at a wind speed maximum, according to the UM-generated meteorological profiles for the Malvern site, and according to radiosonde temperatures from various upper-air stations (fig. 4).
The UM temperature profiles at the radar sites were examined in detail, and they could be categorised as follows. On the mornings of 26 June 2001 (Malvern), 3 July 2001 (Malvern and Rothamsted) and 28 July, 31 July and 1 August 2004 (Rothamsted), the temperature profile showed a fairly typical surface inversion with its top at ~200–500 m, above which temperatures declined monotonically up to at least 1100 m. The insect layer was located near (or somewhat above) the top of the inversion, and sometimes it was also close to a wind speed maximum (figs 4 and 5).
The profile for 4 July 2001 (Malvern) differed in minor ways from the above-mentioned occasions; the top of the inversion occurred at higher altitudes (600–700 m) and the maximum temperatures were found at the surface rather than at the inversion top. The insect layer present between 04.15 and 06.50 h at ca. 600–700 m on this morning was apparently associated with the top of the elevated inversion. Wind speeds here were strong but there were no particular features in the speed profile at the layer altitude. On 23 July 2004 (Rothamsted), a rather weak inversion (0.6°C to isothermal) was situated between the heights of 200 and 300 m, and temperatures were again warmer at the surface. The association between the insect layer (which formed at 04.00 h at about 380 m but soon rose to about 450 m) and the weak inversion was not very convincing, and it is conceivable the insects were instead reacting to a wind speed maximum which was located between 300 and 450 m.
A very different profile to the above-mentioned occasions occurred on 17 June 2000 (Malvern) and on 7 August 2003 (Rothamsted) when a warm airmass moved in aloft, and maximum temperatures occurred at 1000 or 1200 m. Therefore, on these mornings, the insect layers were apparently associated with local maxima in the temperature profile and not with the highest temperatures per se. Events on 7 August 2003 at Rothamsted were interesting because the insect layer was detectable for a much longer period than normal, albeit with some distinct changes in altitude (ca. 250 m, rising eventually to ca. 700 m – see below and fig. 2c, d). In the late morning, the layer was more obvious in the ‘percentage above threshold’ time/height plot (fig. 2d) because aerial densities were high enough to cause ‘saturation’ affects in the ‘target numbers’ profiles. The layer was observed to form by 04.30 h, and it continued until about 06.15 h (fig. 6a), apparently associated with a local maximum in the temperature profile at about 300 m (see the 06.00 h profile, fig. 6c). After about 06.15 h, the insect layer gradually rose in altitude, and it was centred at about 530 m by 07.30 h (fig. 6b). During this period, the temperature maximum at about 300 m had disappeared, and temperatures increased monotonically from about 200 m up to 1 km (cf. the temperature profiles for 06.00 h and 08.00 h in fig. 6c). So, the insects forming the layer which had persisted for some time at the altitude of the (locally) warmest temperature may have moved to higher altitudes in order to (approximately) maintain these temperatures. However, the layer did not continue to rise, tracking upwards into steadily warmer temperatures; but, instead, it persisted as an unusually strong feature at about 530 m from 07.30 h until about 10.15 h, perhaps forming a layer at a preferred temperature. From about 10.30 h, the layer ascended again, eventually to about 700 m, before it dissipated at about noon probably due to the development of the convective boundary layer. On the same morning at the Malvern site, temperatures were generally lower (fig. 6d), and dawn layering here was not stable or persistent.
The initial development of the layer at Rothamsted on 7 August may have been facilitated by a wind maximum observed in the UM profile at 200 m at 05.00 h. However, the evolution of the layer after 06.15 h (detailed above) was not related to any wind speed feature, hence temperature appeared to be a more important influence than wind speed on the insects constituting the layer.
On 17 June 2000 at Malvern, a narrow layer at an altitude of ca. 400 m was associated with a well-defined local temperature maximum, and a strong wind jet (up to 13.5 m s−1) at approximately the same altitude (fig. 7a,b). Around 07.30 h, the insect layer was replaced by insect concentrations at various heights, including at the lowest observable altitudes (indicating daytime take-off); but, by 08.15 h, layering had reappeared but now at the higher altitude of 600 m. The layer was well defined around 09.00 h, when there was a local temperature maximum at the same altitude (fig. 7c,d). The wind jet intensified during this period, with speeds up to 16–17 m s−1, although the maximum speeds occurred above layer height (fig. 7d).
The question arises as to whether the insects in the dawn migration were forming layers due to the influence of warm temperatures near the top of an inversion or were reacting to a maximum in the wind speed (e.g. caused by a low-level jet), which is often present under inversion conditions. In the examples studied here, the former seems more likely because a significant proportion of the variance in layer altitude was explained by regression on the altitude of the temperature maximum (F=10.48, P=0.012, R2=0.567), while the equivalent regression on the altitude of the maximum wind speed was not significant (P=0.363, R2=0.104) (see fig. 8). Nonetheless, there were occasions when the temperature and wind maxima coincided, and the insects in the layer achieved rapid displacement in the strong southerly/south-easterly winds, e.g. 26 June 2001 (fig. 4) and 17 June 2000 (fig. 7a,b).
The relation between the altitude of the insect layer and the altitude of a maximum in (a) air temperature or (b) wind speed. The meteorological data was derived from Unified Model outputs generated for the radar sites for times when the layers were observed.

Displacement speeds
As mentioned above, the insects comprising the layers were often being displaced at high ground speeds (means ranged from 8 to 22 m s−1, table 2), and this was consistent with a migration event rather than with non-migratory behaviours, such as stationary mating swarms of Diptera over landmarks at dawn (one of these has been observed to form a column up to several hundred metres above ground; J.R. Riley, 1978, unpublished observation in Mali, West Africa). In most cases, the displacement due to the wind was augmented by a component of the insects' self-powered flight speed due to their approximately downwind orientation – see below. The highest ground speeds in the layers (mean of ca. 20 m s−1) occurred on 17 June 2000, 26 June 2001 and 22 June 2003, when the insects were flying in strong southerly winds which, on the first two occasions, probably represented a low-level nocturnal jet (see above, and figs 4 and 7). The slowest insect displacements in the layers studied occurred on 28 July and 1 August 2004 when the mean ground speed was 8–9 m s−1. Assuming insects were flying for 2.5 h (the median time of persistence of the layers), they would have moved ~70–180 km in the observed range of displacement speeds. Any tendency for individuals to continue in flight later in the morning, when the dawn layers were no longer distinguishable as distinct features, would considerably extend the distances moved.
Orientation direction
The flight orientations (body alignments) of insects in the layers were not random, i.e. their distributions showed a significant degree of common orientation (fig. 9). Tight orientation distributions with a consistent direction were maintained for several hours on some mornings. For example, at Malvern between 04.00 and 07.05 h on 7 August 2003, when the mean resultant length ‘R’ (a measure of the clustering of the angular distribution, which can vary between 0 and 1) had a value of about 0.80, the alignment stayed close to 170/350°. Where layers were present at Malvern and Rothamsted on the same morning, the orientation directions were similar, e.g. on 22 June 2003 when the mean alignment axis was 144/324° at both sites.
Examples of the distribution of displacement directions (upper diagrams) and body-alignment (lower diagrams) of insects in dawn layers at Malvern and Rothamsted. The mean direction and circular standard deviation are given above each diagram. Note that the body-alignment measurements are subject to a 180° ambiguity.

Although the radar measurements of orientation are subject to a 180° ambiguity, the actual headings taken up by the insects must have had a large downwind component, because the mean insect displacement speeds always exceeded the associated wind speed. A tendency to head approximately downwind has often been observed in large nocturnal migrants flying in layers in the UK (Wood et al., Reference Wood, Chapman, Reynolds, Barlow, Smith and Woiwod2006) and elsewhere (Riley & Reynolds, Reference Riley, Reynolds and Danthanarayana1986; Riley, Reference Riley1989; Feng et al., Reference Feng, Wu, Cheng and Guo2004a, Reference Feng, Wu, Ni, Cheng and Guo2005). Having said this, it should be noted that in the present study the ‘crab-angle’ (difference between the displacement and orientation directions) averaged 37±19° (c.s.d.) – in other words, the dawn layer migrants sometimes showed a considerable amount of crosswind orientation. Occasions with the larger crab-angles tended to be those with lower displacement speeds (Pearson correlation coefficient of −0.641, p<0.05, n=12).
As in previous studies, the environmental directional cues used by the high-flying insects to select and maintain their orientations were not evident (Drake, Reference Drake1983; Riley & Reynolds, Reference Riley, Reynolds and Danthanarayana1986; Riley, Reference Riley1989). If the insects determine displacement direction by visual perception of ground features (via an optomotor reaction), this would be facilitated by high wind speeds (producing higher angular velocities of ground image flow over the insect retina). Interestingly, however, there was a tendency for tighter orientation distributions to occur in lighter winds, as indicated by a correlation coefficient of −0.594 (p<0.05) between the mean resultant length (‘R’ value) of the orientation distributions and the mean displacement speed. Detection of drift in daylight would obviously be much easier than it would be under starlight illuminance (Riley, Reference Riley1989), and it would seem not to be a limiting factor in the present case. The environmental cues used to achieve the off-wind headings remained mysterious – the insects were not, for example, simply orientating towards the rising sun.
The identity of the migrants forming the dawn layers
The best way to identify the insects comprising layers seen on the radar is to capture specimens by aerial sampling at the appropriate height. In our studies, this has generally been achieved by a net suspended from a tethered helium-filled balloon (Chapman et al., Reference Chapman, Reynolds, Smith, Smith and Woiwod2004). This procedure has been successful in identifying components of the day-flying fauna (e.g. Chapman et al., Reference Chapman, Reynolds, Smith, Riley, Telfer and Woiwod2005) and that flying after dusk (Chapman et al., Reference Chapman, Reynolds, Smith, Riley, Pedgley and Woiwod2002b, Reference Chapman, Reynolds, Brooks, Smith and Woiwod2006 and unpublished data). However, aerial sampling from kytoons has hardly been attempted at dawn in the UK, and the infrequency of well-developed dawn layers does not encourage spending time and effort on such a sampling programme. Additionally, the altitude of many of the layers was above the height (200–300 m) accessible to our current aerial netting system. As a consequence, clues to the identity of the dawn layer migrants have been largely confined to information derived from the radar returns from the insects.
Estimates of mass can be obtained from individually-resolvable targets where these provide a good fit to the underlying VLR analysis model, i.e. they have correlation coefficients >0.9 (Smith et al., Reference Smith, Reynolds and Riley2000; Chapman et al., Reference Chapman, Smith, Woiwod, Reynolds and Riley2002a). It was found that the insects comprising the dawn layers included a variety of sizes but masses lay preponderantly in the 16–32 mg range (fig. 10), i.e. considering the various layering occasions, between 54% and 88% of the targets lay within this mass range. Whether there was a genuine peak in this mass category needs further consideration, however, as the results could merely represent the systematic under-sampling by the radar of insects smaller than 16 mg. This effect is likely to occur with insect masses below about 8 mg (Smith et al., Reference Smith, Reynolds and Riley2000), but it might also affect the apparent number of insects in the 8–16 mg category, especially if there was much inter-target interference in the layers.
Examples of mass distributions (combined aerial density of insects in various mass categories) for various dawn layer occasions. Only targets with masses >8 mg are included. (a) ■, 26 June 01 Malvern;  , 22 June 03 Malvern ; (b) ■, 3 July 01 Malvern; , 3 July 01 Rothamsted;
 , 4 July 01 Malvern; (c) ■, 23 July 04 Roth; , 28 July 04 Roth; , 31 July 04 Roth; □, 1 August 04 Roth.
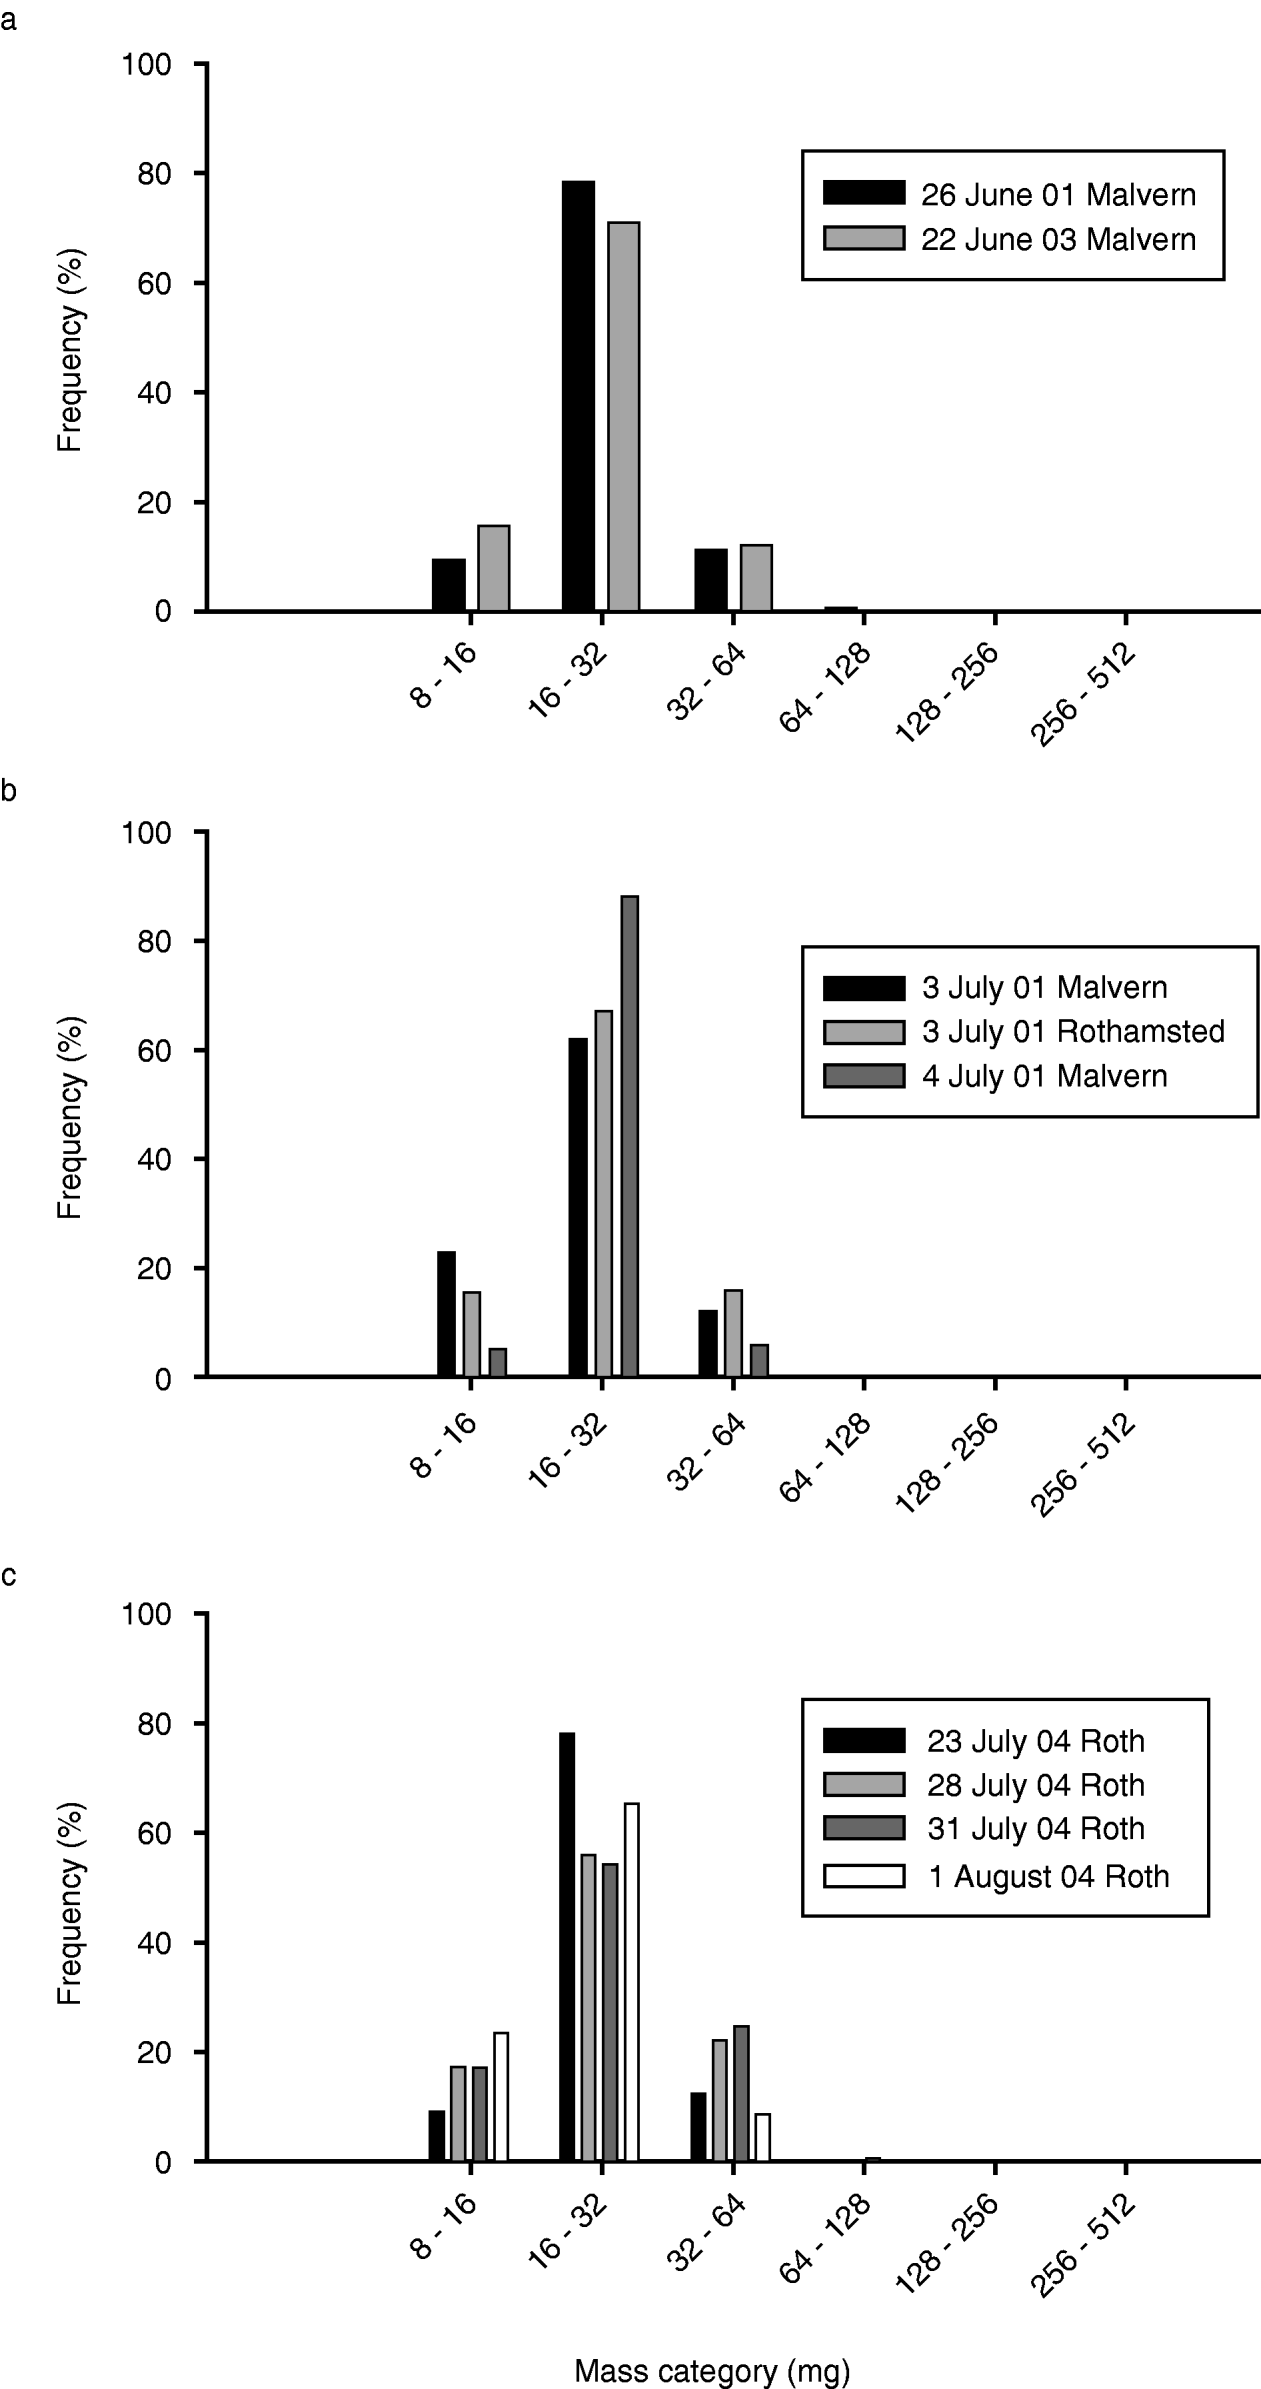
However, on 1 August 2004 at Rothamsted, a nocturnal layer that ended at about 04.05 h (i.e. shortly before the dawn layer started at 04.45 h) was found to be comprised mainly of insects weighing 8–16 mg. This observation suggests that insects in this size category were not being strongly suppressed, even though there was a fair amount of interference in this nocturnal layer (only about a third of the recorded targets were classed as ‘good’, i.e. with correlation coefficients >0.9).
More generally, we note that there were several dawn layer occasions (22 June 2003, 28 July 2004 and, to a lesser extent, 3 July 2001, all at Rothamsted) where there was little evidence for significant levels of inter-target interference (few ‘poor’ targets); and, consequently, the detection of 8–16 mg targets would be expected under these circumstances. Therefore, the indications are that on most, if not all, occasions the comparative scarcity of insects weighing 8–16 mg in the dawn layers was a real effect.
We can be much more confident that the rather small percentages of insects in the mass categories above 32 mg represented reality, and that there were virtually no large ‘noctuid moth-type’ targets which might have been present if nocturnal migration had persisted into the daylight to any extent (cf. Drake et al., Reference Drake, Helm, Readshaw and Reid1981). Indeed, in the few cases where nocturnal migration continued all night and came close to overlapping with the dawn layers, there was, as expected, a distinct change between the mass distributions of insects observed at the end of the night-time migration and those from the dawn layer. On 17 June 2000 at Malvern (fig. 11a), for example, targets forming a layer at 500–600 m between 01.00 h and 02.50 h exhibited a peak in the mass range 64–256 mg (or, more precisely, 80–140 mg), which was attributable to noctuid moths (Reynolds et al., Reference Reynolds, Chapman, Edwards, Smith, Wood, Barlow and Woiwod2005). These targets were, however, completely absent from the mass distribution for targets in the dawn layer itself (03.30–06.05 h). Another example occurred on 22 June 2003 (fig. 11b), where targets forming a nocturnal layer at 600 m between 02.00 h and 03.05 h included a peak in mass range 140–200 mg, but these formed no part of the well-defined dawn layer observed at the same height between 03.15 h and 05.45 h. Thus, in both cases, the large moth-type targets disappeared rapidly around the beginning of civil twilight (ca. 03.00 h on the mornings in question).
Comparison of the mass distributions for insects forming: ○, nocturnal (pre-dawn) layers; and ●, dawn layers on (a) 17 June 2000 at Malvern and (b) 22 June 2003 at Malvern. Only targets with masses >8 mg are included.

In contrast, there was apparently no distinct change in target mass distribution towards the end of the dawn layering period/start of the period of daytime flight activity. To mention one example, the mass distribution of insects forming the layer present from 03.30 h to 04.50 h on 22 June 2003 at Malvern was not noticeably different from the distribution for insects flying at 05.15–08.35 h on the same morning.
The returned signals from individual insect targets can also provide information on their body shape, e.g. by means of the ratio of their principal scattering cross-section terms (σxx/σyy). The majority of the targets in the dawn layer had cross-section ratios between 5 and 15 (see frequency distributions in fig. 12), which is what would be expected for ‘typically-shaped’ insects. For example, carabids, hoverflies and small moths, whose cross-sections have been measured in our laboratory, had mean ratios in this range (Chapman et al., Reference Chapman, Reynolds, Smith, Riley, Pedgley and Woiwod2002b, 2005, and unpublished data). For comparison, hemispherical insects, such as the coccinellid beetles, Coccinella septempunctata L. and Adalia bipunctata (L.), had ratios of ~2–3; while rather long and thin species, such as green lacewings of the Chrysoperla carnea group, had a mean ratio of about 20 (Chapman et al., Reference Chapman, Reynolds, Brooks, Smith and Woiwod2006).
Frequency distributions of an insect ‘body-shape factor’, i.e. the ratio of the radar scattering cross-section terms (σxx/σyy) for targets in the dawn layer on three occasions at Rothamsted.

Discussion
Falling illumination at dusk and rising illumination levels at dawn are triggers for mass take-off and emigration in a wide variety of insect taxa, each responding to a different range of light levels (Lewis & Taylor, Reference Lewis and Taylor1964). In some species, these emigration flights are known to reach heights of hundreds of metres, and they form conspicuous features on entomological radars (Drake & Farrow, Reference Drake and Farrow1988; Gatehouse, Reference Gatehouse1997). As mentioned in the Introduction, the dusk and dawn emigration flights of large insects, such as noctuid moths (e.g. those of Spodoptera exempta moths in Kenya), take place under rather dark conditions, in contrast to rice micro-insects where emigration occurred when it was relatively light to the human eye. In the tropics, dawn flights of micro-insects (e.g. those in the Philippines; Riley et al., Reference Riley, Reynolds and Farrow1987) were usually short-lived, but rather similar faunas in China engaged in flights for one or two hours on some mornings (Riley et al., Reference Riley, Cheng, Zhang, Reynolds, Xu, Smith, Cheng, Bao and Zhai1991, Reference Riley, Reynolds, Smith, Rosenberg, Cheng, Zhang, Xu, Cheng, Bao, Zhai and Wang1994). The dawn layers observed in the present study are similar to those of rice micro-insects in China, in that flight was taking place largely in daylight – indeed, they could be more precisely described as ‘post-dawn flights’. They were clearly very different from the S. exempta flights, which are essentially over before daylight.
A mass take-off at dawn, where the insects ascended to at least 150–200 m (and which were consequently detectable on our vertical-looking radars) occurred quite commonly during the summer months in southern England, but it was usually rather brief. Much less frequently, the dawn take-off led to the formation of notable layer concentrations of insects, which then persisted for quite extended periods (~2–5 hours). The dawn take-off was normally distinct from any night-time migration, as nocturnal migrants had usually declined to very low numbers before daybreak. On the rare occasions that layering persisted all night and almost extended into the dawn layer period, there was an obvious change in the faunal composition (as shown by changes in the mass distribution of the detected targets) between the pre-dawn (nocturnal) migrants and those which had taken off at dawn.
The dawn layers were centred at altitudes between ca. 240 m and 700 m above ground (median=450 m). They appeared to be typically ~100–200 m thick, although 100 m currently represents the minimum height interval required to delimit a layer on the radar; and, therefore, some of the layers may have been shallower than this.
It will be apparent from the foregoing sections of this paper that we have interpreted the behaviour of the ‘dawn flight’ insects in terms of migration, and it might be worth briefly rehearsing the reasons for this view. The radar data showed that there was a general and widespread ascent of insects to high altitude, after which they maintained themselves for some time in wind streams which were usually faster than the insect air-speeds; and this resulted in movement over considerable distances. There was no evidence of station-keeping behaviour, or the formation of localised swarms or groups of interacting individuals, which would be indicative of non-migratory, appetitive movement (Dingle, Reference Dingle1996). In fact, considering typical target sizes and layer heights observed by us, insects which were individually detected by the radar must have been separated from one another by at least 22 m vertically and 10 m horizontally. Therefore, it seems unlikely that individuals were in visual contact as would occur in a mating swarm, for example.
Warm night-time temperatures at the surface and at altitude were evidently favourable for a good dawn emigration. This is not surprising because, in the cool maritime climate of Britain, low temperatures around dawn must often inhibit insect flight to some extent. Given a reasonable emigration at dawn, the formation of persistent insect layers was shown to be associated with the presence of stable zones in the atmosphere, usually temperature inversions. Inversions are commonly involved in the formation of insect layers occurring at other times of the day, e.g. night-time (references in Drake & Farrow, Reference Drake and Farrow1988 and Reynolds et al., Reference Reynolds, Chapman, Edwards, Smith, Wood, Barlow and Woiwod2005) and during the day (Richter et al., Reference Richter, Jensen, Noonkester, Kreasky, Stimmann and Wolf1973; Campistron, Reference Campistron1975), but there seem to be few published examples for the period just after dawn. A case study of triple layering observed over Illinois, USA, on the morning of 9 August 1984 is pertinent here, because the middle layer was partly composed of aphids which must have taken off after the end of solar darkness (04.28 h local time) (Hendrie et al., Reference Hendrie, Irwin, Liquido, Ruesin, Mueller, Voegtlin, Achtemeier, Steiner, Scott, MacKenzie, Barfield, Kennedy, Berger and Taranto1985; Irwin & Thresh, Reference Irwin and Thresh1988). This layer (located between ca. 500 and 650 m) coincided with a temperature maximum at the top of a strong subsidence inversion (Hendrie et al., Reference Hendrie, Irwin, Liquido, Ruesin, Mueller, Voegtlin, Achtemeier, Steiner, Scott, MacKenzie, Barfield, Kennedy, Berger and Taranto1985). Gossard & Strauch (Reference Gossard and Strauch1983) present an example of an insect layer at ca. 500 m at 06.55 h (local time) over Colorado, USA; but, in this case, the relation to the temperature profile was not very clear. Finally, insect layers have been reported between 08.30 h and 10.30 h at high altitudes (2000 m and 2900 m) over inland Australia (Drake & Farrow, Reference Drake and Farrow1985). These layers were above the zone of convection, but they did not coincide with any obvious feature in the temperature profile.
Temperature and wind velocity are the environmental cues often invoked to account for nocturnal layers of insects observed by radar (Drake, Reference Drake1985; Drake & Farrow, Reference Drake and Farrow1988; Gatehouse, Reference Gatehouse1997; Feng et al., Reference Feng, Wu, Cheng and Guo2003, Reference Feng, Wu, Cheng and Guo2004a; Reynolds et al., Reference Reynolds, Chapman, Edwards, Smith, Wood, Barlow and Woiwod2005). However, it can be difficult to separate the effects of these two factors where temperature and wind speed maxima are found at similar altitudes, as can occur at the top of a nocturnal surface inversion. It might be expected that the fundamental temperature requirements for flight at altitude have to be satisfied first; but, if air temperatures are generally favourable for sustained flight, then the migrant may be free to ‘select’ a height of flight which is optimal for another factor, e.g. strong wind speeds (Wolf et al., Reference Wolf, Westbrook, Sparks and Sparks1986b; Beerwinkle et al., Reference Beerwinkle, Lopez, Witz, Schleider, Eyster and Lingren1994; Riley et al., Reference Riley, Reynolds, Smith, Edwards, Zhang, Cheng, Wang, Cheng and Zhai1995; Feng et al., Reference Feng, Wu, Cheng and Guo2004b, Reference Feng, Wu, Ni, Cheng and Guo2005). In Britain's relatively cool climate, nocturnal layering is usually (Reynolds et al., Reference Reynolds, Chapman, Edwards, Smith, Wood, Barlow and Woiwod2005), though not invariably (Wood et al., Reference Wood, Chapman, Reynolds, Barlow, Smith and Woiwod2006), associated with warm air near the top of an inversion. Air temperatures experienced at the onset of the dawn layering period are likely to be even lower than for the nocturnal layers; and so it was no surprise that well-developed dawn layers in the UK were rather uncommon and that, when they did form, they showed more of an association with profiles of temperature rather those of wind speed.
The layers formed from dawn emigrants eventually merged into the general build-up of day-flying insects which occurred later in the morning, and were no longer identifiable as a separate feature. Therefore, the later development of the insect layers appeared to be strongly influenced by the evolution of the nocturnal atmospheric boundary layer into the daytime convective boundary layer including, for example, the disruption of inversions by the upward progression of convective plumes (Campistron, Reference Campistron1975; Farrow, Reference Farrow and Danthanarayana1986).
Unfortunately, we have little idea of the taxonomic composition of the insects forming the dawn layers in the present study. It is clear that the dawn layers are not composed of large moth-type targets (such as those attributable to noctuids), as the case studies indicate that even when these have been in flight late into the night, they disappear from the radar records around dawn. The dawn layer insects which were individually resolvable by the radar included a range of sizes; but masses were predominantly in the 16–32 mg range, and the insects appeared to be of typical insect body shape, i.e. neither particularly hemispherical nor particularly elongated. Also, they were evidently capable of reacting to environmental cues to maintain a common orientation direction.
It might be expected that the take-off of species which comprised the dawn layers would have been detected in Lewis & Taylor's (Reference Lewis and Taylor1964) extensive study on insect flight periodicity in the UK (about 400 species considered over several sites and years). However, few of the taxa covered in Lewis and Taylor's paper fitted the size criterion, showed the right type of periodicity distribution and occurred in the right months. One candidate group appeared at first sight to be the tipulid Diptera. For example, some Nephrotoma spp. have a bimodal flight periodicity, and the morning activity peak occurs soon after dawn (see p. 454 of Lewis & Taylor, Reference Lewis and Taylor1964); and some species are certainly windborne migrants because Nephrotoma flavescens (L.) has been caught by us at altitude (ca. 200 m) during the dusk flight period (D.R. Reynolds, unpublished). N. flavescens itself is rather small to correspond with the 16–32 mg mass range predominating in the dawn layers, but the mass of the larger tipulids would give a good fit. Unfortunately, however, the mean radar cross-section ratio (see Results section above) of these long, thin-bodied insects would be expected to be ~20 (Aldhous (Reference Aldhous1989) obtained a cross-section ratio of 19 for a specimen of Tipula oleracea L.), and this does not correspond well with the peak of the distribution of cross-section ratios estimated for the dawn layer migrants (fig. 12). Some radar targets do indeed have ratios of ~20, but these are in the minority. Therefore, it would appear that tipulids could only have comprised a minor component, at most, of the dawn layer phenomenon.
Other dipteran families, which have some moderate-sized species and also show some evidence of a morning flight period, might conceivably include the Empididae, Hybotidae and Dolichopodidae. Any suggestions from readers as to the possible identity of the dawn migrants would be welcomed by the authors, but further studies are evidently required to resolve this question.
In conclusion, we note that radar remains the only technique with which dawn layering can be studied; and, although the insect species involved have yet to be identified, we draw attention to the dawn layers phenomenon for its intrinsic interest and for its relevance to our understanding of high-altitude migration of insects over Britain and northern Europe.
Acknowledgements
We are indebted to Mr Peter Clark of the Mesoscale Modelling Group, Joint Centre for Mesoscale Meteorology, Reading, for providing the Unified Model outputs for the radar sites. Rothamsted Research receives grant-aided support from the Biotechnology and Biological Sciences Research Council (BBSRC).



