Introduction
The physic nut, Jatropha curcas L. (Euphorbiaceae), is one of the most promising oilseed plants for biodiesel production (Kumar & Sharma, Reference Kumar and Sharma2008). The mites Polyphagotarsonemus latus (Banks) (Prostigmata: Tarsonemidae) and Tetranychus bastosi Tuttle, Baker and Sales (Prostigmata: Tetranychidae) are the most relevant physic nut pests (Sarmento et al., Reference Sarmento, Lemos, Dias, Kikuchi, Rodrigues, Pallini, Sabelis and Janssen2011; Anitha & Varaprasad, Reference Anitha, Varaprasad, Carels, Sujatha and Bahadur2012; Cruz et al., Reference Cruz, Sarmento, Teodoro, Erasmo, Neto, Ignácio and Júnior2012). These mites are widely distributed geographically and attack several plant families (Zhang, Reference Zhang2003; Moraes & Flechtmann, Reference Moraes and Flechtmann2008). However, the dynamics of colonization of these mites in crops is unknown, as well as the influence of one species over another.
Studies on the spatial distributions of crop pests help to identify the locations of their most frequent attacks on the crops (Diaz et al., Reference Diaz, Barrios and Fereres2012). These studies also enable us to understand and predict pest movement between plantations, as well as within the different regions of the same plantation (Hortal et al., Reference Hortal, Roura-Pascual, Sanders and Rahbek2010). Thus, sampling and control efforts can be focused on these locations (Barrigossi et al., Reference Barrigossi, Young, Crawford, Hein and Higley2001; Bacca et al., Reference Bacca, Lima, Picanço, Guedes and Viana2006).
The spatial distribution patterns of insect pests can be classified as aggregated, random or uniform (Elliott, Reference Elliott1983; Krebs, Reference Krebs1989). These spatial distribution patterns have been measured using mathematical frequency distribution models (Elliott, Reference Elliott1983; Krebs, Reference Krebs1989). However, they are not representative of the density distribution of these organisms in space, as they are based on the relationship between the variance and the mean, irrespective of where the samples are located (Binns et al., Reference Binns, Nyrop and Werf2000). One suitable option is to use geostatistics in the spatial distribution studies of pests, which incorporates the geographic location of the samples (Rijal et al., Reference Rijal, Brewster and Bergh2014; Rogers et al., Reference Rogers, Guimarães, Evans and Rogers2014).
Geostatistics enables the measurement of the degree of dependence among the samples over space using semivariance and permit to infer about spatial distribution patterns of insect pests (Silva et al., Reference Silva, Picanço, Bacci, Crespo, Rosado and Guedes2011; Rijal et al., Reference Rijal, Brewster and Bergh2014; Veran et al., Reference Veran, Simpson, Sword, Deveson, Piry, Hines and Berthier2015). By observing the behavior of a variable in space, it can be noticed that the closer the sample points, the greater the similarity between them and thus lower the semivariance. Thus, the greater the distance between two points used to calculate the higher will be the semivariance (Matheron Reference Matheron1963; Gumprecht et al., Reference Gumprecht, Muller and Rodriguez-Diaz2009). According to Gumprecht et al. (Reference Gumprecht, Muller and Rodriguez-Diaz2009) the characteristics measured by geostatistics include the nugget effect (a measure of sampling error), the sill (maximum semivariance value in spatially dependent samples) and the range (the distance over which the samples are correlated).
Currently, only a few studies are available that describe the spatial distribution of mite populations (Napierała et al., Reference Napierała, Błoszyk, Kozak and Bruin2006; Yarahmadi & Rajabpour, Reference Yarahmadi and Rajabpour2013), despite their great significance for pest management. Such studies involving two species are even rarer to find in the literature (Napierała et al., Reference Napierała, Błoszyk, Kozak and Bruin2006). The aim of this work was to measure the spatial distributions of the pest mites P. latus and T. bastosi in the physic nut plantations.
Materials and methods
Experimental conditions
This study was conducted over two years in two different plantations. Crop 1 was located in Caseara (9°20′24″S, 49°50′51″W, at an altitude of 174 m) and Crop 2 in Palmas (10°9′227″S, 48°29′27″W, at an altitude of 280 m), in the state of Tocantins, Brazil.
Nine months after planting the seedlings to the field, physic nut plants start producing fruits, reaching peak production from the second year and produce viable fruit for oil production by up to four decades (Saturnino et al., Reference Saturnino, Pacheco, Kakida, Tominaga and Gonçalves2005; Arruda et al., Reference Arruda, Queiroz, Costa, Saraiva and Erasmo2013; Saraiva et al., Reference Saraiva, Dornelas, Dornelas, Goncalves, Erasmo, Sarmento and Nunes2013). At the commencement of this study, the plants were 4 years old. The fields were approximately 4 ha, and the plants were spaced approximately 2 × 3 m apart. The crops were grown according to Sato et al. (Reference Sato, Bueno, Esperancini and Frigo2009), and no pesticides were used. Air temperature and total rainfall (mm) were monitored during the whole experimental period. The mite and natural enemies’ populations were monitored monthly over a period of 2 years.
Characteristics analyzed
Measurements were taken on the lower (abaxial) surface of the 4th most apical leaf of the plant branch, using a 20× magnifying glass (Rosado et al., Reference Rosado, Sarmento, Pedro-Neto, Galdino, Marques, Erasmo and Picanço2014). We evaluated 300 equally spaced plants to obtain systematic samplings that would ensure total coverage of the plantation without directional bias (Midgarden et al., Reference Midgarden, Youngman and Fleischer1993).
Each plant thus analyzed was georeferenced using a global positioning system (GPS 12XL, Garmin, Othale, Kansas, USA). The density of P. latus was measured in the leaf blade region near the petiole, while the density of T. bastosi was measured in the middle region of the leaf blade (Rosado et al., Reference Rosado, Sarmento, Pedro-Neto, Galdino, Marques, Erasmo and Picanço2014).
Data analysis
We calculated the mean density and the percentage of the plants affected, for each species, at each location, for each date. We selected the dates (39 dates) on which the mites attacked the plants. In geostatistics, the semivariogram is the tool used to evaluate the spatial dependence between two samples (Matheron, Reference Matheron1963). In the semivariogram the semivariances between two points are calculated to generate the paired differences between points at different distances. Therewith, it is determined the empirical semivariogram, obtained from the sample data.
The empirical semivariogram is used to best fit the model for the theoretical semivariogram (Rijal et al., Reference Rijal, Brewster and Bergh2014). When a semivariogram has a defined sill the adjusted models can be spherical, exponential and Gaussian (Isaaks & Srivastava, Reference Isaaks and Srivastava1989). Because of this, we then fitted three teorical semivariogram models, namely, spherical, exponential and Gaussian, to the mite density data to choose the best model (Liebhold et al., Reference Liebhold, Rossi and Kemp1993). The models with the best fit were chosen by cross-validation. The models chosen were those with intercepts close to zero, slopes close to one and those having the lowest residual sum of squares. The nugget effect, range, sill and coefficient of determination were calculated for each model (Murphy & Sternitzke, Reference Murphy and Sternitzke1979; Isaaks & Srivastava, Reference Isaaks and Srivastava1989).
The Kriging method was used to construct maps of the spatial distributions of the mites in the plantations (Farias et al., Reference Farias, Roberto, Lopes and Perecin2004). Spatial analyses were performed using the GS+ Geostatistics for the Environmental Sciences software, Version 9.0 (Robertson, Reference Robertson2008). We calculated the range of spatial dependence (RSD) using the following formula: RSD = C 0/(C 0 + C), where C 0 = the nugget effect and C + C 0 = the sill (Cambardella et al., Reference Cambardella, Moorman, Novak, Parkin, Karlen, Turco and Konopka1994). Spatial dependence is considered to be strong when RSD ≤ 0.25, moderate when 0.25 < RSD ≤ 0.75 and weak when RSD > 0.75 (Cambardella et al., Reference Cambardella, Moorman, Novak, Parkin, Karlen, Turco and Konopka1994; Sciarretta & Trematerra, Reference Sciarretta and Trematerra2006).
The average densities of both species were calculated for the studied crops. Because each field presented a different range for each mite in each sample date (spatial analysis), we set an increasing range model according to the increasing density of the mites (P < 0.05). These data were used to verify the influence of mites density in the spatial dependence among samples.
Results
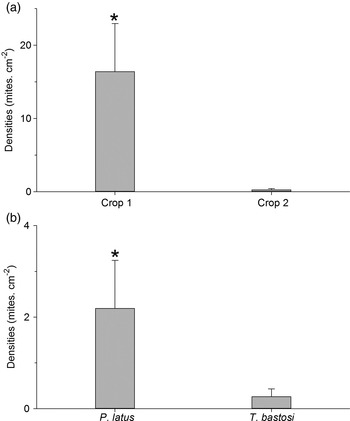
In Crop 2, we observed the presence of both P. latus and T. bastosi. However, only T. bastosi was observed in Crop 1. The total mite density was higher in Crop 1 than in Crop 2. The P. latus density was higher than that of T. bastosi in Crop 2 (figs 1 and 2).
Seasonal variation in the density of Tetranychus bastosi in Crop 1 (A) and in Crop 2 (B) and of Polyphagotarsonemus latus in Crop 2 (C).

(A) Total density (mean ± SD) of the mites in two locations. (B) Density (mean ± SD) of Polyphagotarsonemus latus and Tetranychus bastosi in Crop 2. Bars with an asterisk (*) are significantly higher by the F-test at P < 0.05.

Populations peaked for a short time period (30–45 days). The mite density varied widely during peak population periods for both P. latus (0 to 8.7 mites cm−2) and T. bastosi (0 to 4.3 and 0 to 73.6 mites cm−2 in Crops 2 and 1, respectively). In Crop 2, we observed peak P. latus and T. bastosi populations at two different time periods. During the first infestation (from March to April, 2011), the P. latus population peaked first, followed by T. bastosi. During the second infestation (from October 2011 to March 2012), the T. bastosi population peaked first, followed by P. latus. In Crop 1, we observed only a single population peak for T. bastosi, corresponding to the largest mite population peak (from September to November, 2011) (figs 1, 4 and 5).
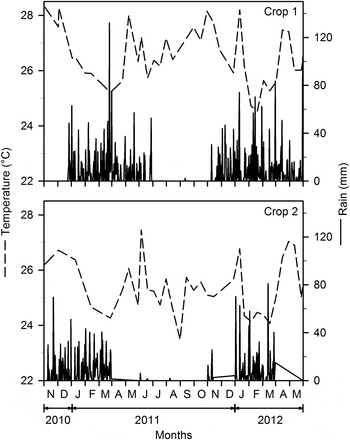
The highest densities of T. bastosi on phisic nut coincided with warmer periods. However, this was not observed to P. latus. On the other hand, P. latus was more frequent in periods with higher rainfall, whereas T. bastosi in lower rainfall periods (fig. 3).
Seasonal variation of climatic elements in Crops 1 and 2.

In both crops the natural enemies densities were low during the whole studied period (mean 0.01 ± SE 0.0011 for Crop 1 and 0.01 ± SE 0.0014 for Crop 2). These densities did not allow adjustment of the semivariogram. The natural enemies found were the predatory mite Euseius concordis Chant (Acari: Phytoseiidae), spiders, ladybirds Stethorus sp. (Coleoptera: Coccinellidae) and Lacewings Chrysoperla sp. (Neuroptera: Chrysopidae).
The spatial distribution of the mites was uniform for 30 samples (10 for P. latus and 20 for T. bastosi) and these models revealed only the pure nugget effect. However, the models showed ranges of spatial dependence of 0.17–0.51 in nine samples (four for P. latus and five for T. bastosi), indicating an aggregated mite distribution at these locations. Three of the aggregated distribution models for P. latus were exponential and one was Gaussian. Four of the aggregated distribution models for T. bastosi were exponential, while one was spherical. The spatial distribution models for the mites were isotropic (table 1).
Density (mean ± SE) and characteristics of the spatial distribution models for Polyphagotarsonemus latus and Tetranychus bastosi in Crops 1 and 2.

In the heading: β0 = intercept of the curve, β1 = slope, RSS = residual sum of the squares, C 0 = nugget effect, C + C 0 = sill, R = range (cm), R 2 = coefficient of determination and RSD = Range of Spatial Dependence.
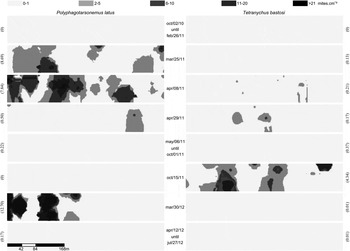
The mite populations were found to be uniformly distributed under two circumstances: (i) when the densities were very low (up to 0.22 and 0.13 mites cm−2 for P. latus and T. bastosi, respectively) and (ii) when the densities were high (greater than 24 mites cm−2 for T. bastosi). The mite populations showed aggregated spatial distributions for intermediate densities. The patches (plantation areas) with high mite densities were seen to concentrate at the periphery of the area under study (figs 4 and 5).
Maps of the spatial distribution of Polyphagotarsonemus latus and Tetranychus bastosi in Crop 2. The mean densities in the plantation are given in parentheses (mites cm−2).

Maps of the spatial distribution of Tetranychus bastosi in Crop 1. The mean densities in the plantation are given in parentheses (mites cm−2).

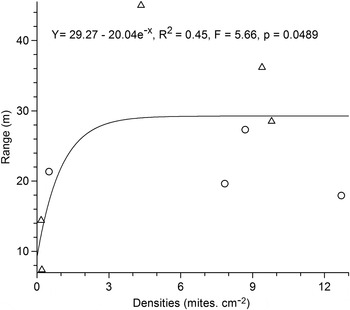
The ranges in the aggregated spatial distribution models varied from 7.37 to 45 m (table 1). We did not observe any significant differences for the ranges of the aggregated spatial distribution models as a function of mite species (F 1;7 = 0.37; P = 0.5622) or as a function of location (F 1;7 = 1.37; P = 0.2794). However, we found that the ranges in the aggregated distribution models increased as a function of mite density until they reached a plateau at a density of approximately 3 mites cm−2 and a range of approximately 30 m (fig. 6).
Range variation in the spatial distribution models for Polyphagotarsonemus latus (○) and Tetranychus bastosi (Δ) as a function of their densities.

Discussion
This study presents the first spatial distribution maps for P. latus and T. bastosi in physic nut plantations. The resulting spatial distribution maps enabled us to understand the spatiotemporal dynamics of these mite populations. The spatial distribution was uniform at the extremes of the densities (low or high), as we did not observe large differences in mite density between the plants. However, the mite spatial distribution was aggregated at intermediate population densities because we observed patches (plantation areas) of plants that revealed high mite densities, while other plants showed low mite densities.
Aggregation of the mite populations at the specific time periods may have occurred due to their high reproductive rates and their propensity to exhaustively explore their current location before migrating to other areas (Moraes & Flechtmann, Reference Moraes and Flechtmann2008). Thus, the P. latus and T. bastosi populations only spread to new locations after reaching high densities in their original location.
The large variation in the distribution patterns of the P. latus and T. bastosi populations over time and space is typical of the r-strategist species. R-strategist species explore resources in temporary patches, reveal high population growth rates and minimize interspecific competition (Southwood, Reference Southwood1962; Begon et al., Reference Begon, Townsend and Harper2005). Both P. latus and T. bastosi exhibit these traits, as they have high reproductive rates (Lopes, Reference Lopes2009; Evaristo et al., Reference Evaristo, Venzon, Matos, Freitas, Kuki and Dias2013; Pedro-Neto et al., Reference Pedro-Neto, Sarmento, Oliveira, Picanço and Erasmo2013) and have characteristics that reduce the interspecific competition, including their behavior of attacking plants at different time periods.
During colonization, individuals identify locations favorable to their offspring (Karban & Agrawal, Reference Karban and Agrawal2002). The fact that the spatial distribution models are isotropic indicates that the mite populations spread in all directions in the plantation. During this process, these arthropods migrate to the neighboring plants as the leaves deteriorate due to the intense infestation by them. This migration is possible because the leaves of the neighboring plants are in contact with each other. Thus, dispersion links the local population cycles of colonization and extinction of the individuals in ephemeral environments (Hanski, Reference Hanski1999). P. latus and T. bastosi colonize the leaves at their preferred site, the apex of the physic nut plants (Lopes, Reference Lopes2009; Evaristo et al., Reference Evaristo, Venzon, Matos, Freitas, Kuki and Dias2013; Pedro-Neto et al., Reference Pedro-Neto, Sarmento, Oliveira, Picanço and Erasmo2013). Another reason for the mite migration to other plant species is that the physic nut plants are deciduous (Ulyshen, Reference Ulyshen2011). Thus, when these plants lose their leaves (from mid-June to mid-September), the mites, of necessity, need to migrate to other plant species.
Polyphagotarsonemus latus and T. bastosi infestations were observed to concentrate at the periphery of the plantation. The colonization process includes an infestation source and a sink. The source of the infestation could be the plantation itself or other areas. For arthropods, the most common situation is one where the source is another area (Yarahmadi & Rajabpour, Reference Yarahmadi and Rajabpour2013). In the situation studied here, both the plantations and the other areas could have been the source of the mite infestation. Mites may spread between areas via wind, transportation of contaminated plants or by phoresy on other insects (Moraes & Flechtmann, Reference Moraes and Flechtmann2008). When the mites originate from the plantation itself, the source is normally the weeds in the area (Sutherland et al., Reference Sutherland, Gill, Norris, Bullock, Kenward and Hails2002). These two hypotheses are not mutually exclusive, as P. latus and T. bastosi have already been observed on weeds (Cruz et al., Reference Cruz, Sarmento, Teodoro, Erasmo, Neto, Ignácio and Júnior2012), and a few studies reporting mite dispersion between plantations are available in the literature (Moraes & Flechtmann, Reference Moraes and Flechtmann2008). We previously found that the weeds Sida rhombifolia, Bauhinia angulata, Calopogonium mucunoides, Urena lobata, Waltheria americana, Helicteres guazumifolia, Sida cordifolia and Sida urens act as source of phytophagous mites infesting physic nut plantations (Cruz et al., Reference Cruz, Sarmento, Teodoro, Erasmo, Neto, Ignácio and Júnior2012, Reference Cruz, Sarmento, Teodoro, Pedro Neto and Ignácio2013; Saraiva et al., Reference Saraiva, Sarmento, Erasmo, Pedro-Neto, DeSouza, Teodoro and Silva2015). Thus, we favor the possibility that the physic nut plants may act as a sink, whereas the other plant species, such as weeds, act as the source for the P. latus and T. bastosi populations (Hanski, Reference Hanski1999).
The range value obtained in the spatial distribution analysis of a pest allows the use of geostatistics in pest management programs (Rijal et al., Reference Rijal, Brewster and Bergh2014). Thus, the range should be the minimum distance between the samples that make up the sampling plans. Adopting these sample distances, the data of a sample does not suffer from the pest spatial distribution (Young & Young, Reference Young and Young1998), allowing the use of classical methodologies consisting of conventional and sequential samplings.
The evaluation of the spatial pattern by using geostatistical tools is also important to correct the flaws of methods that are traditionally used to determine the spatial distribution of pests (Young & Young, Reference Young and Young1998; Rijal et al., Reference Rijal, Brewster and Bergh2014). Such frequency distribution methods provide no information on the spatial pattern of pests in the field, for not taking into account the geographical location of the sampling points (Young & Young, Reference Young and Young1998; Rijal et al., Reference Rijal, Brewster and Bergh2014). Using geostatistics, this can be verified by semivariogram models and clearly displayed on the maps generated by the Kriging method (Liebhold et al., Reference Liebhold, Rossi and Kemp1993; Bacca et al., Reference Bacca, Lima, Picanço, Guedes and Viana2006).
The facts that mites colonization are concentrated at the periphery and each sample depends on those located about 30 m in its diameter can affect how these arthropods need to be sampled (Barrigossi et al., Reference Barrigossi, Young, Crawford, Hein and Higley2001). Mites must be sampled commencing from the edge of the plantation and the samples should be drawn from closely located plants. Next, the sampling should be extended to the whole plantation, and samples need to be taken approximately 30 m apart. In addition, a random walk is recommended in this case (Rosado et al., Reference Rosado, Sarmento, Pedro-Neto, Galdino, Marques, Erasmo and Picanço2014).
The spatial distribution of the mites in the plantations over time was observed to be affected by interspecific competition. Species that compete interspecifically inhabit the same ecological niche and tend to occur at lower densities when they are found in the same location (Sarmento et al., Reference Sarmento, Lemos, Dias, Kikuchi, Rodrigues, Pallini, Sabelis and Janssen2011). Both P. latus and T. bastosi inhabit the same ecological niche, as they both suck out the cellular contents from the lower leaf surfaces and prefer to attack the young leaves (Lopes, Reference Lopes2009; Evaristo et al., Reference Evaristo, Venzon, Matos, Freitas, Kuki and Dias2013; Pedro-Neto et al., Reference Pedro-Neto, Sarmento, Oliveira, Picanço and Erasmo2013). Another supporting piece of evidence for the existence of interspecific competition is the fact that the total mite density was higher when only one species occurred (figs 1 and 2). To reduce interspecific competition, species generally exploit the resources available at distinct time periods (Hammen et al., Reference Hammen, Montserrat, Sabelis, de Roos and Janssen2012). This effect was observed in the current study, as P. latus and T. bastosi attacked the plants at different time periods, when both were found to occur in the same crop (fig. 1).
The climatic factors such as rainfall and temperature varied along the year and the mite species studied varied accordingly. Several arthropods species improve their biological performance with increasing temperature. In this context, high temperature increases reproduction, as well as, the developmental rate of several tetranichid mites, such as we found to T. bastosi (Liu & Tsai, Reference Liu and Tsai1998, Bounfour & Tanigoshi, Reference Bounfour and Tanigoshi2001; Silva, Reference Silva2002). Because P. latus presents large thermal limits of development (14–32°C) (Ferreira et al., Reference Ferreira, Oliveira, Haji and Gondim2006), the temperature variation in the study sites (23–28°C) should not have been enough to affect the populations size of this mite.
Among the negative effects of rain is the death of small arthropods such as mites by knocking them to the ground or drowning (Leite et al., Reference Leite, Picanço, Zanuncio and Ecole2006). The rain may also decrease the mobility of arthropods reducing encounters between sex partners for mating (Bacca et al., Reference Bacca, Lima, Picanço, Guedes and Viana2006) and provide conditions for development of entomopathogenic fungi that are important natural enemies of mites (Van der Geest et al., Reference Van Der Geest, Elliot, Breeuwer and Beerling2000). Some arthropods may be more susceptible to these factors and thus be adversely affected. This may explain the difference in the effect of rain on the two studied species.
Conclusion
In conclusion, our study sheds light on the spatiotemporal dynamics of the P. latus and T. bastosi mite populations in the physic nut plantations. Mite colonization begins at the periphery and spreads towards the center, in uniform patches. The spatial distribution of the mites is influenced by interspecific competition, and the total density of the mites is observed to be higher when only one species is present. When both the mite species are present, their populations peak at different times. The spatial distribution of the mites is uniform at extreme densities (low or high), although it is aggregated at intermediate densities.
Acknowledgements
We thank the Coordination for the Improvement of Higher Education Personnel (Coordenação de Aperfeiçoamento de Pessoal de Nível Superior – CAPES – Projects PROCAD-NF 187/2010 and PNPD), the National Council for Scientific and Technological Development (Conselho Nacional de Desenvolvimento Científico e Tecnológico – CNPq) and the Research Support Foundation of Minas Gerais (Fundação de Amparo à Pesquisa do Estado de Minas Gerais – FAPEMIG) for the fellowships and financial resources granted to the authors.