Nomenclature
- A
buffer factor accounting for congestion delay
- A f,p,r
actual time stamp
- B
buffer factor accounting for time in queue
- f
time stamp or duration flight: Arrival (A) or Departure (D)
- p
time stamp or duration node: Gate (G), Spot (S), Hardstand (H), or Runway (R)
- e
runway usage time prediction error
- E f,p,r
earliest time stamp
- n s
aircraft count within a particular area of the airport surface
- r
time stamp or duration route: Original (O) or Hardstand (H)
- s
area of the airport surface: Gate (G), Ramp, Active Movement Area (AMA), Hardstand (H)
- t
simulation time
- t ready
time when a flight is ready to push back from the gate
- T f,p,r
target time stamp
- U f,p,r
unimpeded time duration
- β
gate separation buffer
- δ
gate separation delta
- τ s
transit time within a particular area of the airport surface
1.0 INTRODUCTION
The development of concepts and algorithms for efficiently managing airport surface operations is a critical area of Air Traffic Management research supporting the Next-Generation Air Transportation System. Time-based metering or surface scheduling concepts currently in development are expected to improve not only airport efficiency but also predictability, enabling integration with time-based concepts managing other phases of flight. Surface schedulers are used to predict when flights will use capacity-constrained surface resources such as runways and gates, and generate advisories informing controllers when to clear or hold flights at key surface locations to minimize congestion and maximize throughput.
NASA develops and tests surface scheduling concepts with both fast- and real-time (human-in-the-loop) simulations. Real-time simulations provide critical data about interactions between the automation and human operator components of a concept. However, real-time simulations have relatively high software development and staffing costs compared to fast-time simulations, limiting the number of scenarios and variables that may be studied this way. Although fast-time simulation allows a much larger problem trade space to be studied compared to real-time, human-centric operations must be modelled and are often difficult to validate. Together, real-time and fast-time simulation improve the understanding of surface scheduling and operations by using fast-time simulation to expand the scope of understanding and real-time simulation to refine understanding in areas of human interaction. NASA has developed a fast-time simulation of airport surface operations called the Surface Operations Simulator and Scheduler (SOSS)Reference Windhorst, Montoya, Zhu, Gridnev, Griffin, Saraf and Stroiney 1 to rapidly develop and test surface scheduling concepts.
SOSS simulates aircraft moving through a network of surface taxiways between gates and runways. Aircraft must conform to operating rules such as separation constraints. SOSS also has the ability to connect to a scheduler, to which it passes aircraft state information and from which it may receive commands such as release times for specific flights at specific nodes along their surface route. This ability enables researchers to use SOSS to develop and test new surface scheduling concepts and algorithms. SOSS airport surface models have been used to study future operations at airports in the U.S.A. (Dallas Fort Worth International Airport (DFW)Reference Wood, Kistler, Rathinam and Jung 2 – Reference Windhorst 4 and Charlotte Douglass International Airport (CLT)Reference Griffin, Saraf, Yu, Stoiney, Levy, Solveling, Clarke and Windhorst 5 – Reference Zelinski and Windhorst 9 ) and outside (Hamburg Airport in GermanyReference Zhu, Okuniek, Gerdes, Schier, Lee and Jung 10 and Incheon Airport in South KoreaReference Eun, Jeon, Lee, Zhu, Jung, Jeong, Kim, Oh, Hong and Lee 11 ). Currently, researchers are using SOSS to develop surface metering schedulers to support the NASA Air Traffic Management Technology Demonstration 2 (ATD-2) project’s field demonstration of time-based surface metering at CLT.Reference Zelinski and Windhorst 8 , Reference Zelinski and Windhorst 9 , Reference Zelinski and Coppenbarger 12
Much of SOSS development for this work has been driven by the challenges in modelling and simulating CLT operations. First, CLT’s surface configuration, including dual use runways, intersecting runways, converging runways, and taxiways crossing runways, requires a complex set of runway operating constraints for safe operations. CLT also has limited taxiways including several single lane taxiways that make managing operations to prevent surface gridlock a challenge. Finally, CLT is a busy hub airport characterized by tightly spaced arrival and departure banks (temporary rise in demand), which result in heavy use of limited gates. The departure banks precede the arrival banks just in time for departures to vacate gates for arrivals. If a departure pushback from the gate is late or an arrival using the same gate is early, this causes a gate conflict, which, if left unmanaged, can lead to surface gridlock. In real operations, hardstand areas are used to temporality park aircraft out of the way to avoid gate conflicts. Surface metering concepts like ATD-2 have the potential to increase gate conflicts as more flights are held at the gates to keep taxiways free of congestion, therefore, this is an important phenomenon to model and include in simulations used to develop metering algorithms.
This paper describes the SOSS simulation platform and the modelling approach taken for each of the aforementioned challenges associated with CLT surface operations, particularly gate conflicts. Models of CLT hardstands and new SOSS functionality were developed to address gate conflicts. Several approaches to managing gate conflicts with and without the use of hardstands were simulated and their effects on surface operations compared.
2.0 SURFACE OPERATIONS SIMULATOR AND SCHEDULER
This section provides an overview of the SOSS simulation platform. The overview describes the airport surface model and how aircraft move through this model and adhere to various separation constraints. A description of how SOSS interacts with an externally modelled surface scheduler is also provided.
2.1 Airport model
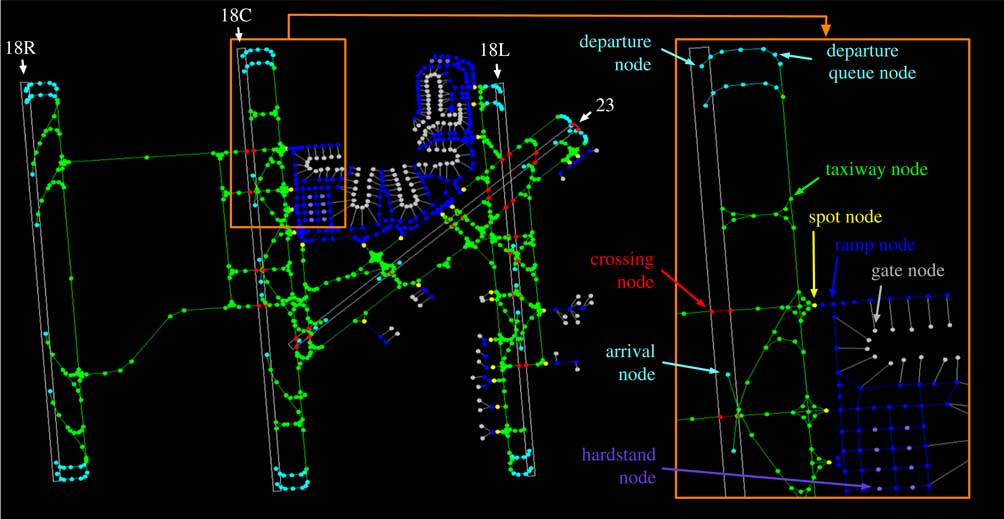
A SOSS airport model specifies a network of nodes and links as an undirected graph, where nodes represent points on the airport surface and links represent straight paths between nodes. Figure 1 shows a diagram of the SOSS airport model for CLT. Long rectangles outline CLT’s four runways labelled for South configuration, where runways 18R and 23 are used only for arrival operations, and runways 18C and 18L are used predominantly for departure operations. Nodes and links are colour-coded by type, which reflects their operational function. A flight taxi route is specified by a sequence of nodes, connected by links, traversing the airport model. Because links define straight paths between nodes, curved route segments are approximated by a series of shorter links between closely spaced nodes. A departure route always begins at a gate node (grey) and moves through a sequence of ramp nodes and links (blue) to a spot node (yellow), which marks the transition point between the ramp area (controlled by air carriers) and the active movement area (AMA) (controlled by the air navigation service provider). From the spot node, the departure then moves through a sequence of taxiway nodes and links (green) and departure queue nodes and links (cyan) until it reaches a departure node (cyan) from which it will take off. An arrival route always begins at an arrival node (cyan), then moves through a sequence of taxiway nodes and links to a spot node, then through a sequence of ramp nodes and links until it reaches a gate node. Some arrival routes may need to taxi across a runway, in which case they will pass through crossing entry and exit nodes (red) on either side of the runway. For this work, another node type was introduced to represent hardstands (purple), where aircraft may park temporarily within the ramp area out of the way of other ramp traffic. A total of 11 hardstand nodes were included in the airport model shown in Fig. 1, eight in the lower left of the ramp area near runway 18C, and three in the uppermost ramp area near runway 18L.
Airport model of CLT.

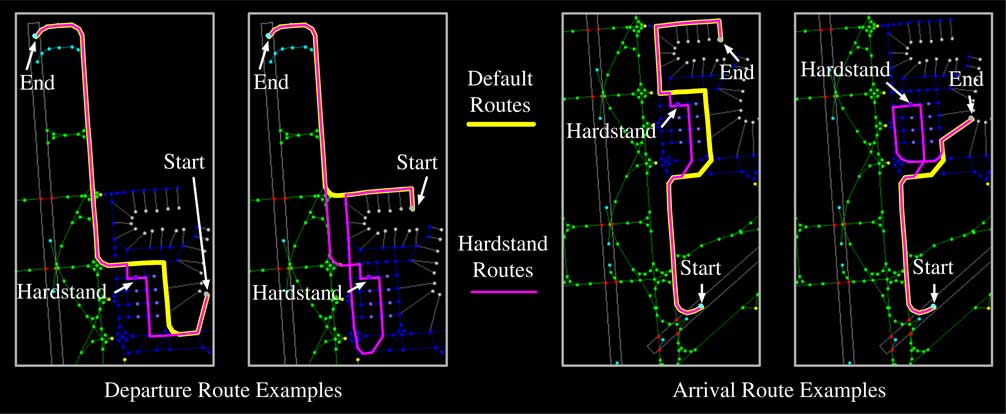
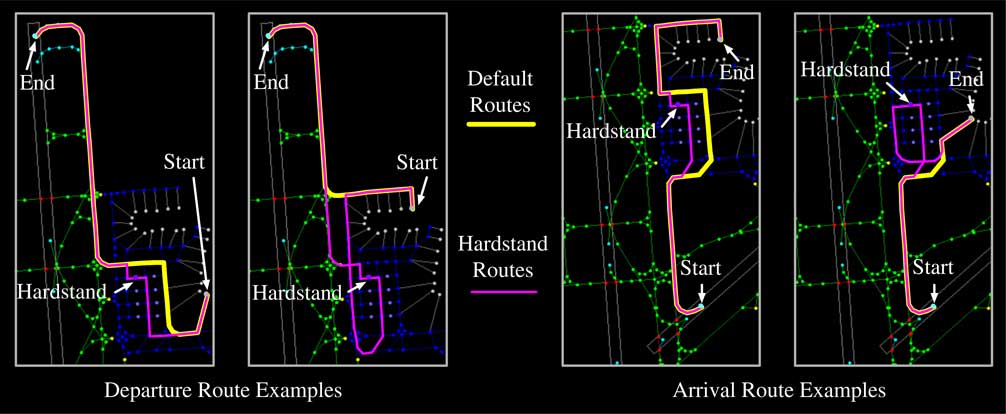
A flight scenario contains information about all the flights in the simulation, including simulation entry time, gate and runway assignment, aircraft type, and flight plan. A list of all routes that flights are allowed to traverse within a simulation is specified in a separate route set. For each departure specified in the flight scenario, the route set must contain at least one route from the assigned gate to a departure node for the assigned runway. Similarly, for each arrival specified in the flight scenario, the route set must contain at least one route from an arrival node for the assigned runway to the assigned gate. The first route specified in the route set for each unique gate-to-runway or runway-to-gate assignment pair is the default route for that assignment pair. If the route set specifies more than one route for an assignment pair, any flight with that assignment pair may be rerouted to one of the specified alternate routes during the simulation. Alternate routes were used to model hardstand operations. For each default route, 11 alternate hardstand routes were defined, each passing through one of the 11 hardstand nodes with start and end nodes identical to those in the default route. Routes were designed to keep traffic along each link flowing in one direction as much as possible. Figure 2 shows examples of default and hardstand routes. Two examples each are given for departures and arrivals. Each example shows only one of several hardstand routes defined for the default route. The other hardstand routes are similar but pass through other hardstand nodes. The example shows how some hardstand routes may be comparable in length to their default routes, whereas some are much longer than their default routes – most are longer.
Example default and hardstand routes for departures and arrivals.
2.2 Aircraft movement
SOSS’s aircraft movement model uses kinematic equations of motion to move flights along their assigned routes. Aircraft parameters specify acceleration and deceleration values and a set of target speeds for different areas of the surface for each aircraft type (e.g. B737, A380, etc.). As the aircraft transitions from one area of the surface to another and the target speed changes, the model will use the specified acceleration or deceleration values for that aircraft type to speed up or slow to the new target speed. Ref. Reference Windhorst4 describes the aircraft movement model in more detail and Ref. Reference Montoya, Windhorst, Zhu, Gridnev, Griffin, Saraf and Stroiney6 provides an example speed profile using aircraft parameters.
2.3 Conflict detection and resolution
Aircraft movement may be interrupted by other traffic when taxi separation constraints are imposed. SOSS predicts when two aircraft will come into conflict and resolves the conflict by slowing or stopping one of the flights based on right-of-way rules. Taxi separation constraints in CLT’s complex and often congested ramp area surrounding the gates were not included in early CLT surface scheduling studies due to gridlocking issues.Reference Griffin, Saraf, Yu, Stoiney, Levy, Solveling, Clarke and Windhorst 5 , Reference Montoya, Windhorst, Zhu, Gridnev, Griffin, Saraf and Stroiney 6 Later, SOSS’s conflict detection and resolution functionality was enhanced as described below to impede gridlock and allow these constraints to be included.
In-trail conflicts, in which an aircraft is predicted to overtake another traveling in the same direction, are handled by slowing the trailing aircraft to avoid getting too close to the one in front. Merging conflicts, in which two aircraft paths intersect, are handled by slowing or stopping the aircraft predicted to arrive at the intersection last, to let the other one pass. Head-on conflicts, in which two aircraft are predicted to lose separation travelling in opposite directions on the same link, are handled as follows: first, the set of links that make up the common path between the two aircraft is determined; then, the aircraft predicted to reach its nearest link in the common set last is slowed or stopped outside the common path to let the other aircraft pass.
Conflict detection and resolution is performed for only two aircraft at a time. There is a potential for three or more aircraft entering into a gridlock situation, especially where there is a tight network with short links or if one of the aircraft involved is large and requires a large taxi separation. High-demand flight scenarios often gridlock in simulation. In some cases, the flight scenario may be modified to allow a simulation to complete without gridlock by removing flights or changing their simulation entry time or aircraft type. The gate conflict management approaches described later reduce the occurrence of simulation gridlock without having to modify the flight scenario.
2.4 Runway separation model
In the previous work, SOSS runway separation operations were implemented by purely time-based constraints (specified by tables of minimum time required for one runway operation type and aircraft weight class to follow another) and the scheduler used the same time-based constraints to calculate metering control times.Reference Griffin, Saraf, Yu, Stoiney, Levy, Solveling, Clarke and Windhorst 5 Many surface separation rules are distance-based in actual operations. Therefore, uncertainty introduced by the discrepancy between distance-based separation rules for operations and time-based separation rules for scheduling was lost. The SOSS runway separation model has since been enhanced to more accurately reflect the tactical runway separation rules used in actual operations with the addition of distance-based rules. Three types of operations use runways: arrival, departure, and taxi crossing. Arrivals enter the simulation on final approach several miles from the runway threshold with no opportunity to hold before landing at the arrival node. Consecutive arrivals are assumed to be sufficiently separated by their simulation entry times in the flight scenario. SOSS implements all other runway separation constraints by holding or releasing departures at the departure node and by holding or releasing crossers at the crossing entry node. Departure and crossing operations are handled tactically in first-come-first-served order. All time-based separation rules are used by the scheduler as well. However, the scheduler uses time-based approximations of the more recently implemented distance-based separation rules included below. The scheduler time-based approximations are tuned based on observations of the simulated operations following the distance-based rules.
Aircraft are held or released for takeoff based on the following rules:
• Consecutive departures on the same runway must be time separated based on the weight class. All departures following Small or Large weight class departures must be separated by at least 60 s. Small or Large departures following Heavy or B757 departures must be separated by at least 90 s. Heavy or B757 departures following Heavy or B757 departures must be separated by at least 120 s.
• A departure following an arrival or a crosser on the same runway may be released for takeoff no earlier than one second after the other aircraft reaches its runway or crossing exit node, respectively.
• A departure preceding an arrival on the same runway may be released for takeoff only if the arrival is at least 1500m from reaching the runway entry node.
• A departure on 18L preceding an arrival on the intersecting runway 23 may be released for takeoff only if the arrival is at least 1500m from reaching its runway entry node.
• A departure on 18L following an arrival on the intersecting runway 23 may be released for takeoff only if the arrival is at least 600m past its runway entry node. This puts the arrival past where the runways intersect.
• A departure on 18C preceding an arrival on the converging runway 23 may be released for takeoff only if the arrival is at least 3334m (1.8 nmi) from reaching its runway entry node.
• A departure on 18C following an arrival on the converging runway 23 may be released for takeoff no earlier than 1 s after the arrival reaches its runway entry node.
Aircraft are held/released for crossing a runway based on the following rules:
• Consecutive releases from the same crossing entry node must be separated by at least 5 s.
• A crossing aircraft preceding an arrival may be released from its crossing entry node only if the arrival is at least 1000m from reaching its runway entry node.
• A crossing aircraft following an arrival or departure operation may be released from its crossing entry node only if the other aircraft has passed where the taxiway crosses the runway. This condition is implemented as a unique minimum distance past the runway threshold based on the crossing location.
2.5 Scheduler interface
SOSS may connect to schedulers via a socket using a protocol called the Common Algorithm Interface (CAI). The user sets the frequency of scheduler calls. For each call, SOSS sends the scheduler information for all flights currently active in the simulation as well as flights that will enter the simulation within a user-specified planning horizon. Flight information includes information about the aircraft (e.g. call sign, weight class, type), state (e.g. location, heading, speed), route, and any constraints imposed by external traffic management initiatives. A key piece of departure information included is the time the departure expects to push back from the gate, also known as its Earliest Off Block Time (EOBT). The scheduler uses the flight information it is given to calculate and send back to SOSS times of release at specific nodes along each flight’s route. If a flight arrives at a node before its scheduled release time, SOSS holds the flight at the node until the release time. If a flight arrives at a node without an assigned release time or the release time has already passed, SOSS allows the flight to continue along its route. It is up to the scheduler to set or update release times for specific flights at nodes along their routes. The tactical scheduler for the ATD-2 departure metering concept nominally sets release times for departures at gate nodes. This release time is known as the departure’s Target Off Block Time (TOBT).
The scheduler may also use the CAI to change a flight’s taxi route as long as the flight has not been released from its first node yet (gate node for departures or arrival node for arrivals). All flight reroutes to hardstands are implemented before the flight is released from its first node. Any departure may be rerouted to a hardstand prior to pushing back from the gate by changing its route from the default to one of the associated alternate hardstand routes. Similarly, any arrival may be rerouted to a hardstand by changing its route before reaching the arrival node. Once the route is changed, the scheduler may set release times at nodes along the new route. For the purposes of modelling hardstand operations integrated with departure metering, the scheduler will set release times not only for departure gate nodes but also for departure and arrival hardstand nodes.
At every scheduler call, for each flight f and each node p along the flight’s assigned route r, there are three types of times stamps. Earliest time E f,p,r is the earliest time f can arrive at, or be released from, p calculated by projecting unimpeded transit time from current position along r. The target time T f,p,r is the time produced by the tactical scheduler for f to be released from p. The T f,p,r is always greater than or equal to E f,p,r . Only some T f,p,r are sent to SOSS as controlled release times (e.g. for departure gate nodes and hardstand nodes). Others are merely predictions of when f will be released from p based on scheduling constraints. Actual time A f,p,r is the actual time f was released from p in simulation. The time duration U f,p1,p2,r is the unimpeded or minimum time it would take for f to travel from p 1 to p 2 along r in the absence of other flights, which is equal to the time duration between E f,p1,r and E f,p2,r . All flight routes contain at most one of each of the node types, gate, spot, hardstand, departure, and arrival. All route options for the same flight use the exact same gate, spot, and departure or arrival nodes. Only the hardstand nodes and intermediate ramp nodes between the spot and the gate via the hardstand differ between route options for the same flight. Let a p denotation of G, S, and H represent the gate, spot, and hardstand nodes along r, respectively. Let a p denotation of R represent either the departure or arrival node on the runway. Using this notation, the abbreviations EOBT and TOBT, commonly used in the previous work, are represented by E f,G,r and T f,G,r , respectively. This deviation from previously used nomenclature is adopted to add clarity in describing gate conflict management logic considering more than one flight or route. For each gate conflict, two flights are considered, one arrival and one departure, for which f is denoted as A and D, respectively. For each flight, at most two routes are considered, the original route assigned to the flight and next available hardstand route, for which r is denoted as O and H respectively. Table 1 summarizes denotations described above.
Denotations for surface time stamps and time duration

3.0 MODELLING HARDSTAND OPERATIONS
Hardstands are temporary parking areas for flights that do not have access to a gate. Hardstands are often used as remote gates, and passengers are bussed between terminals and hardstands for boarding and deplaning. Hardstands are also used to temporarily park a flight out of the way when its gate is not available, and is how they are used in this study to avoid predicted gate conflicts.
3.1 Predicting gate conflicts
In actual operations, a gate conflict is typically discovered and resolved as follows. Ramp Control is contacted by an arrival flight at the spot asking for clearance to enter the ramp. At this point, Ramp Control would either see that the arrival gate is empty and give the arrival clearance to proceed through the ramp to its gate, or discover that the gate is still occupied, which constitutes a gate conflict. Because in simulation, the decision to change an arrival’s route must be made prior to entering the arrival node, the scheduler must predict gate conflicts rather than react to them as they occur.
When the scheduler is called, it will first update the runway schedule for all flights (T f,R,O), then update T f,G,O for all departures based on the runway schedule. The scheduler will then search for all pairs of arrivals/departures assigned to the same gate and check for gate conflicts. A gate conflict is predicted for a given arrival/departure pair (A, D) when E A,G,O is within a given gate separation buffer β of T D,G,O for the same gate as follows.
 $${\rm Gate}\,{\rm conflict}\,\colon\,E_{{{\rm A,G,O}}} \,\lt\,T_{{{\rm D,G,O}}} {\plus}{\rm \rbeta }.$$
In the previous workReference Zelinski and Windhorst 8 before SOSS hardstand models were developed, gate conflicts were detected using a β equal to 1 min and resolved by updating the time T D,G,O to equal max(E A,G,O – 1 min, E D,G,O). For this work, gate conflicts were predicted using a more conservative β of 5 min. Interviews with CLT ramp controllers suggested 5 min was a reasonable buffer for defining gate conflicts in actual operations.
3.2 Gate conflict management
Four gate conflict management approaches were developed and modelled for this work: No Hardstand, Departure Hardstand, Arrival Hardstand, and Dual Use Hardstand. These approaches allow different combinations of resolutions involving the departure and/or the arrival in a given gate conflict.
Two types of departure resolutions are used in this study: early release from the gate without changing the taxi route and early release from the gate while rerouting to the hardstand. Departure resolutions are implemented when the departure is ready for pushback, referred to as ready time. In operations, ready time is indicated by a voice call from the pilot to Ramp Control. In SOSS, departures are initialized and occupy the gate for a user-specified time duration prior to ready time. The departure’s ‘arrival’ at the gate node is only recognized and recorded at ready time. SOSS has the capability to model ready time uncertainty relative to E f,G,r , however, ready time uncertainty was not modelled in this study and, therefore, ready time equalled E f,G,r for all departures.
The only type of arrival resolution used in this study is rerouting to the hardstand. Arrival resolutions are implemented when the arrival is predicted to land within 100 s to ensure that there is time to change the arrival’s taxi route before it lands.
1. No hardstand
This approach resolves predicted gate conflicts by releasing the departures from the gate once they are ready for pushback by setting T D,G,O equal to current time. Because only departure early release resolutions are allowed, under this approach, gate conflicts are identified and resolutions implemented at departure ready time only.
2. Departure Hardstand
The problem with the No Hardstand approach is that it gives an unfair advantage to departures with gate conflicts and it can potentially make the runway schedule less predictable. The Departure Hardstand approach addresses this issue by allowing the departure to push back from the gate at ready time and to be metered from a hardstand rather than at the gate, thus freeing up the gate for use by the arrival flight. The departure is assigned the next available hardstand route r=H and T D,H,H is calculated to allow the flight to reach the runway at its original target time T D,R,O. The T D,H,H calculation is similar to the T D,G,O calculation for gate hold advisories described in the previous workReference Zelinski and Windhorst 9 by back calculating release time from T D,R,O and inserting delay buffer factors A and B as follows:
 $$T_{{{\rm D,G,O}}} {\equals}T_{{{\rm D,R,O}}} -A\left( {U_{{{\rm D,G,R,O}}} } \right)-B$$
 $$T_{{{\rm D,H,H}}} {\equals}T_{{{\rm D,R,O}}} -A\left( {U_{{{\rm D,H,R,H}}} } \right)-B,$$
where A ≥ 1 and B ≥ 0. Factor A accounts for congestion delay the flight may encounter along its taxi route and assumes this delay is directly proportional to the flight’s remaining unimpeded travel time. Factor B captures queue delay incurred when flights line up from the end of the runway. Because most hardstand routes are longer than default routes, there is a possibility that by the time the flight is ready to pushback, the hardstand route does not enable the flight to meet its original target runway time. This is checked by comparing the difference in unimpeded transit time (buffered by A) and the gate release times between the original route and hardstand route. At ready time, if A(U D,G,R,H–U D,G,R,O) ≤ T D,G,O–current time, the departure is released right away and sent to the hardstand. Otherwise, the resolution is identical to No Hardstand, where the departure retains the original route and is released from the gate right away. Because only departure early release and departure-to-hardstand resolutions are allowed, under this approach, gate conflicts are identified and resolutions implemented at departure ready time only.
3. Arrival Hardstand
Whereas the Departure Hardstand approach may resolve a gate conflict caused by holding a ready departure, it will not resolve a gate conflict that occurs before the departure is ready. The Arrival Hardstand approach addresses this issue by sending conflicting arrivals to the hardstand instead of departures. In this approach, every time a gate conflict is predicted, the arrival is assigned a hardstand route. An Arrival Hardstand approach was used in the previous workReference Zelinski and Windhorst 9 to avoid the impact that departure resolutions might have on departure metering results being studied. Whereas in the previous work, the arrival was released from the hardstand when actual departure pushback was detected, in this work, the T A,H,H is designed to get the arrival to the gate β after departure pushback. The T A,H,H is calculated as
 $$T_{{{\rm A,H,H}}} {\equals}T_{{{\rm D,G,O}}} -A\left( {U_{{{\rm A,H,G,H}}} } \right){\plus}{\rm \beta }.$$
Because only arrival-to-hardstand resolutions are allowed, gate conflicts are identified and resolutions are implemented only when the arrival is predicted to land within 100 s.
4. Dual Hardstand
Although the Arrival Hardstand approach appears to be a simple way to resolve gate conflicts without disrupting departure metering, getting arrivals to the gate on time is a higher priority for airlines than minimizing active taxi time for departures or maintaining a predictable runway schedule. CLT is a hub airport where most of the passengers arriving have ~45 min to deplane and transit the busy terminals to make a connecting departure. Delaying arrival gate time increases the probability of missed connections. The Dual Use Hardstand approach is designed to strike a balance between Departure Hardstand and Arrival Hardstand by sending departures or arrivals to the hardstand when most appropriate. In this approach, if a gate conflict is predicted when the arrival is predicted to land within 100 s, the arrival is sent to the hardstand only if the E A,G,O is within β of the departure E D,G,O. If a gate conflict is predicted at departure ready time, the logic first checks to see if the arrival is already being held at or is on its way to a hardstand. If not, the arrival either has not yet been rerouted to a hardstand, or has already been released from the hardstand, in which case the departure is sent to the hardstand in accordance with the Departure Hardstand logic. Because the resolutions may involve the arrival or departure, gate conflicts are identified and given resolution opportunity both when the arrival is predicted to land within 100 s, and at departure ready time. Therefore, it is possible to use both an arrival and departure resolution action for the same conflict. This may be necessary if conditions change after implementing the first action or the first action could not fully resolve the conflict. A specific example is discussed in results Section 5.1.
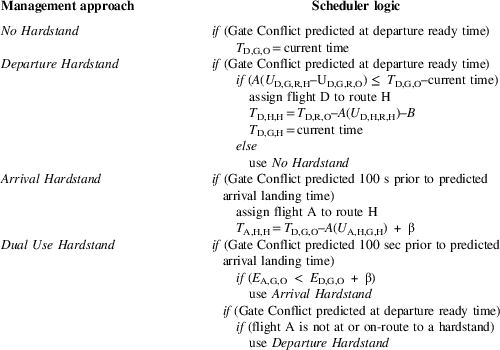
Table 2 summarizes the scheduler logic used in each of the above gate conflict management approaches.
Scheduler logic for managing predicted gate conflicts

4.0 EXPERIMENT SETUP
4.1 Simulation parameters
Four SOSS simulations were completed and compared, one for each gate conflict management approach in Table 2, each using a β of 5 min. Each simulation was run using a time step of 0.5 s and the tactical scheduler was called every 10 s. In all simulations, the tactical scheduler used values of 1.05 for A and 2.0 min for B. A detailed description of the tactical scheduler can be found in the previous work.Reference Zelinski and Windhorst 9
One simulation was attempted without any gate conflict management (i.e. no early gate releases or hardstand rerouting actions), but a group of flights gridlocked in the ramp area near 18L, and the simulation could not be completed. Therefore, no results are presented for this incomplete simulation.
4.2 Traffic scenario
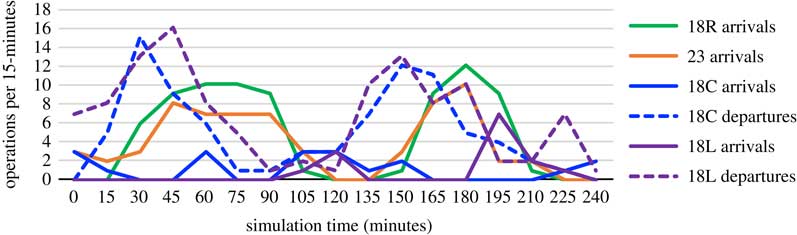
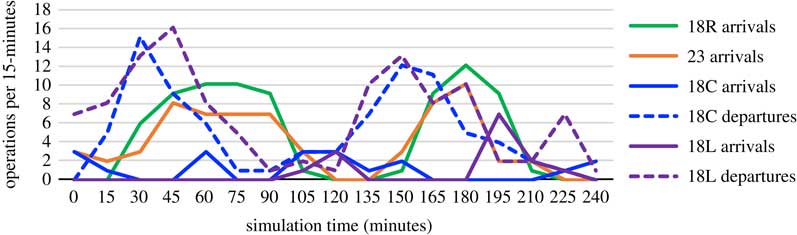
As a hub airport for American Airlines, CLT traffic is characterized by tightly spaced departure and arrival banks. A 4-h traffic scenario was generated using CLT surface surveillance data from 11 March 2016, covering two such banks when CLT was operating in South flow. This traffic sample was chosen as a high-volume period with low weather impact to produce a high-traffic demand scenario that would generate long departure queues and congested surface conditions if left unmanaged. Because this scenario was generated from surveillance data, arrival and departure demand reflects actual operations in which arrivals landed early or departures pushed back late relative to their airline schedules, which is why predicted gate conflicts were expected to occur naturally in the scenario. The scenario contains a total of 175 arrivals and 199 departures. Figure 3 shows the arrival and departure demand on each runway in 15-min bins.
Runway demand.
4.3 Evaluation metrics
Four categories of metrics were used to evaluate and compare each gate conflict management approach: gate time separation, scheduler predictability, surface transit times, and surface counts. These are defined as follows.
1. Gate time separation
Actual gate time separation is the difference in actual gate times between the arrival and the departure involved in an identified gate conflict. The actual separation delta δ is calculated by subtracting β from the actual gate separation
 $${\rm \delta }{\equals}A_{{{\rm A,G},r}} -A_{{{\rm D,G},r}} -{\rm \beta }.$$
2. Scheduler predictability
Scheduler predictability measures how well the departure runway usage time can be predicted at ready time. Scheduler predictability is measured at ready time because this is the last opportunity the scheduler has to update the T D,G,O, after which they are frozen to provide stable gate hold advisories for ramp controllers. Let a departure’s runway usage time prediction error be the difference between its actual runway time and target runway time when it became ready for pushback calculated as
 $$e{\equals}A_{{{\rm D},{\rm R},r}} -T_{{{\rm D,R,O}}} \left( {t_{{{\rm ready}}} } \right),$$
where t ready indicates that the T D,R,O was calculated at the flight’s ready time.
3. Surface transit times
Surface transit time τ s (f) measures the length of time that flight f spent in surface area s. Surface areas times includes active taxi times in the ramp and in the AMA, and hold times spent at the gate and hardstand. Gate hold τG(f) and hardstand hold τH(f) times for flight f are calculated as the difference between when the flight arrived at and was released from the gate or hardstand, respectively. Calculations for arrivals and departures are indicated with f denotations of A and D, respectively:
 $${\rm \tau }_{{\rm G}} {\rm (D)}{\equals}A_{{{\rm D,G},r}} -t_{{ready}} ,$$
 $${\rm \tau }_{{\rm H}} {\rm (A)}{\equals}A_{{{\rm A,H},r}} -t_{{\rm H}} ,$$
 $${\rm \tau }_{{\rm H}} {\rm (D)}{\equals}A_{{{\rm D,H},r}} -t_{{\rm H}} ,$$
where t H is the time the flight arrived at the hardstand node. Note that gate hold is calculated for departures only and the departure’s ready time t ready is the same as when it ‘arrives’ at the gate node in simulation. Hardstand hold is calculated similarly for arrivals and departures. Ramp taxi τRamp(f) and AMA taxi τAMA(f) times are calculated for arrivals (f=A) and departures (f=D) as follows:
 $${\rm \tau }_{{{\rm Ramp}}} {\rm (D)}{\equals}A_{{{\rm D,S},r}} -A_{{{\rm D,G},r}} -{\rm \tau }_{{\rm H}} (D),$$
 $${\rm \tau }_{{{\rm Ramp}}} {\rm (A)}{\equals}A_{{{\rm A,G},r}} -A_{{{\rm A,S},r}} -{\rm \tau }_{{\rm H}} (A)$$
 $${\rm \tau }_{{{\rm AMA}}} {\rm (D)}{\equals}A_{{{\rm D,R},r}} -A_{{{\rm D,S},r}} ,$$
 $${\rm \tau }_{{{\rm AMA}}} {\rm (A)}{\equals}A_{{{\rm A,S},r}} -A_{{{\rm A,R},r}} $$
Note that both arrival and departure ramp taxi calculations exclude hardstand hold, so that only time in active taxi is captured. Arrival and departure calculations differ only in their direction of travel between surface nodes.
4. Surface counts
Surface count
 $n_{s} $
(t) is the number of flights within each area of the airport surface s at time t. Areas of the airport surface used for counts are the same as those used for surface transit times. They include gate hold count
 $n_{{\rm G}}^{{\rm A}} $
(t), hardstand hold counts
 $n_{{\rm H}}^{{\rm A}} $
(t) and
 $n_{{\rm H}}^{{\rm D}} $
(t), ramp taxi counts
 $n_{{{\rm Ramp}}}^{{\rm A}} $
(t) and
 $n_{{{\rm Ramp}}}^{{\rm D}} $
(t), and active movement area taxi counts
 $n_{{{\rm AMA}}}^{{\rm A}} $
(t) and
 $n_{{{\rm AMA}}}^{{\rm D}} $
(t), with each segregated between arrivals and departures, indicated with superscripts A and D, respectively. Whereas surface transit times measure elapsed time for each flight, surface counts measure numbers of flights for each simulation time step.
5.0 RESULTS
This section discusses the results for each of the four evaluation metrics described in Section 4.3. Because these results were produced using a model of CLT, they may not hold for another airport with other runway and traffic conditions.
5.1 Gate conflict resolutions and gate time separation
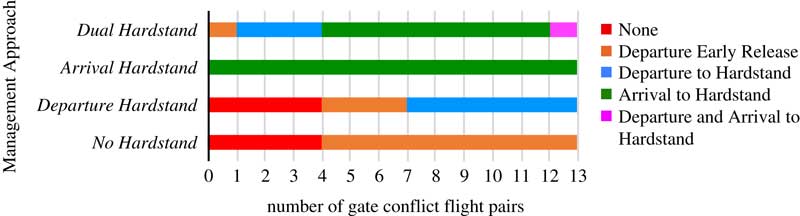
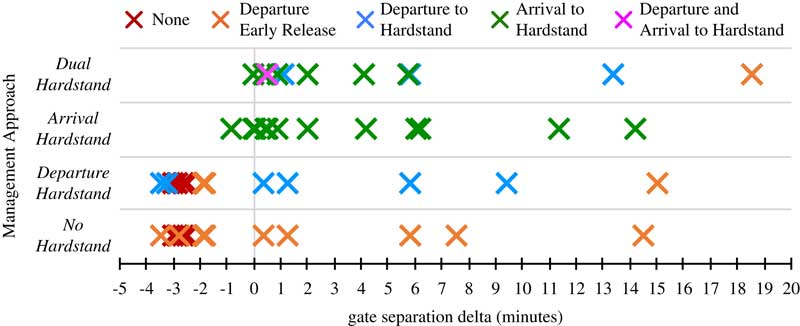
Each simulation produced gate conflicts between the same 13 flight pairs. Figure 4 shows the number of flight pairs in each simulation belonging to each of five types of resolutions. Values are stacked such that each row sums to 13 total number of flight pairs. Figure 5 shows the δ value for each flight pair. Positive values of δ indicate that the gate conflict was successfully resolved meeting the desired separation buffer β of 5 min. Negative values of δ indicate that the gate time separation was less than β. Note that δ may not be less than –5 min as this would mean that the arrival and departure flights occupied the gate at the same time and violated taxi separation constraints described in Section 2.3.
Numbers of resolution types per management approach.

Actual gate time separation delta (δ) for each gate conflict flight pair.

The resolution type ‘None’ means that the gate conflict was predicted but no resolution could be implemented. Four such conflicts arose while using management approaches in which only departure resolutions were allowed (No Hardstand and Departure Hardstand). The departures from these four flight pairs were not assigned any gate delay by the scheduler, and were unable to push back from the gate any earlier to resolve the gate conflict. Figure 5 shows how none of these flight pairs (red Xs) achieved the desired separation as seen from their negative δ values. Other No Hardstand and Departure Hardstand resolutions failed to achieve desired separation because, although the departures were released as early as possible rather than waiting for the scheduler assigned T D,G,O, this was not early enough to avoid the gate conflict. Although the Departure Hardstand approach succeeded in moving many of the No Hardstand approach early released departures to the hardstand, the departure gate release times are the same. Differences in δ between Departure Hardstand and No Hardstand are due to differences in arrival surface delays encountered in these two simulations.
Departure resolutions in general, including those from Dual Hardstand, produce a wide range of δ due to the fixed time of release. On the other hand, more arrival resolutions produce δ closer to zero due to the added control of hardstand release timing. Five of the arrival resolutions from Arrival Hardstand (including the two with largest δ values) did not receive any hold time in the hardstand because the change in route taxi time was more than sufficient to meet the desired gate separation.
The Arrival Hardstand approach produced only one gate conflict violation (green X close to –1). This was because in the time between when the arrival was released from the hardstand and the flight became ready for pushback, the scheduler updated the departure T D,G,r to a later time, causing the departure to hold at the gate longer than earlier expected. This gate conflict was resolved using the Dual Hardstand approach (pink X) by sending the departure to the hardstand as well.
Overall, these results show that arrival resolutions are necessary to fully resolve gate conflicts due to the large proportion of cases where departures are not ready to pushback early enough to resolve the conflict.
5.2 Scheduler predictability
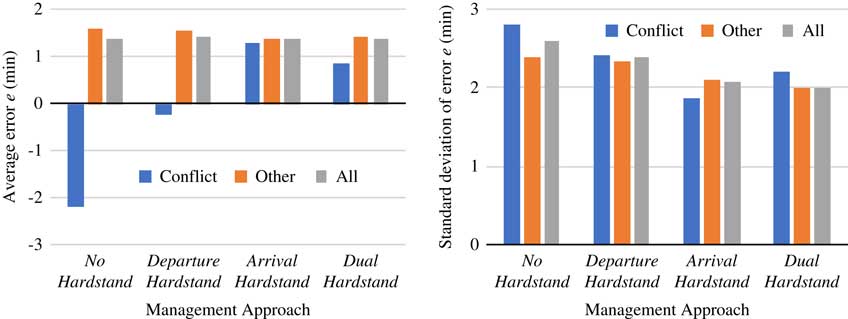
Figure 6 shows departure runway usage time prediction error (e) results for each simulation. Average and standard deviation are calculated for three sets of departures: those that were involved in one of the 13 identified gate conflicts (Conflict), those that were not involved in gate conflicts (Other), and all departures regardless of their involvement in gate conflicts (All). Negative and positive average e values indicate that flight used the runway earlier and later than predicted, respectively.
Average and standard deviation of runway usage time error (e) for each management approach.

The management approaches appear to affect the standard deviation of e for all departures, and affect the average e of flights involved in gate conflicts more than other flights. The No Hardstand approach releases departures involved in gate conflicts early causing their average runway usage time to be earlier than predicted, which decreases predictability for all flights (indicated by high standard deviation values). By moving some of these departures to the hardstand, the Departure Hardstand approach decreases the average e but the standard deviation of e for all flights does not decrease much. The Arrival Hardstand approach produces an average e for departures involved in gate conflicts that is similar to that of other flights. Additionally, the standard deviation of e for all flights is lower under the Arrival Hardstand approach. This is due to the fact that departures are not involved in any of the gate conflict resolutions. The Dual Hardstand approach produces average and standard deviation of e for all flights similar to that of the Arrival Hardstand approach. The impact on the departure scheduler of sending a few departures to the hardstand in addition to the arrivals is only apparent in the average and standard deviation of e for departures involved in a gate conflict.
Overall, these results show that departure resolutions have the greatest impact on scheduler predictability, and their use should be limited if maintaining scheduler predictability is a priority.
5.3 Surface transit time
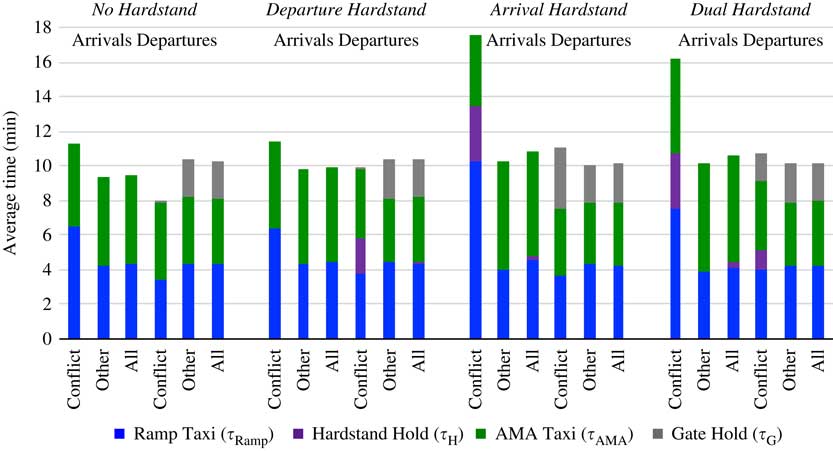
Figure 7 shows average surface transit time (τ) results for each simulation. The τ results in the bar chart are stacked such that the total height of each bar represents the average total transit time between landing and gate for arrivals and between pushback ready and takeoff for departures. Three sets of stacked averages are shown for each management approach and flight type (arrivals and departures): flights involved in gate conflicts (Conflict), flights not involved in gate conflicts (Other), and all flights regardless of gate conflict involvement (All).
Average surface transit times (τ) for each management approach.

The τ results for the No Hardstand and Departure Hardstand approaches are similar, with the most notable difference in results for departures involved in gate conflicts. Whereas both approaches remove all gate holding for departures involved in gate conflicts, the Departure Hardstand approach transfers this gate holding to hardstand holding. In both approaches, the ramp taxi times are much higher for arrivals involved in gate conflicts than other arrivals due to the gate conflict violations with negative δ values in Fig. 5. The arrivals involved in these violations are forced to stop in the ramp and wait for the departures to vacate their gates.
The Arrival Hardstand and Dual Hardstand approaches add a large amount of hardstand hold time to the total transit time for arrivals involved in gate conflicts. The active taxi time (Ramp and AMA) for other flights is slightly higher for arrivals and lower for departures than in the management approaches that do not include arrival resolutions. Sending these arrivals to the hardstand just delays their surface congestion impact. Because the arrival banks are slightly later than departure banks as seen in Fig. 3, this shifts the congestion impact slightly from departures to arrivals. Much of the gate holding for departures involved in gate conflicts in the Arrival Hardstand approach is converted to hardstand holding in the Dual Hardstand approach without impacting other departures.
Overall, these results show the cost of using arrival resolutions. Sending arrivals to the hardstand increases total transit time for the arrivals involved in gate conflicts ~6 min and other arrivals ~1 min on average.
5.4 Surface counts
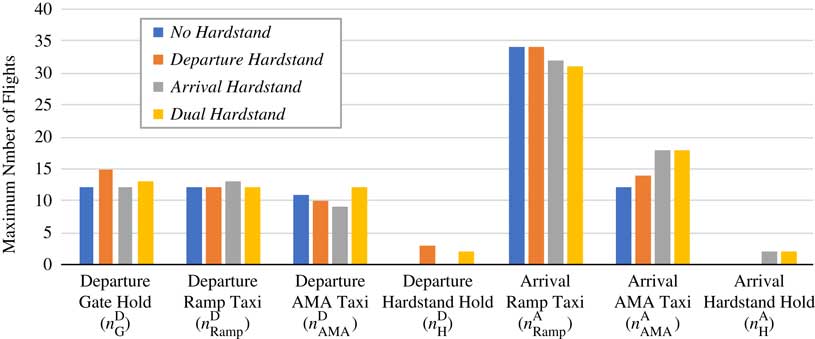
Figure 8 shows the maximum surface count (n) results for each simulation. As expected, hardstand hold counts
 $n_{{\rm H}}^{{\rm A}} $
and
 $n_{{\rm H}}^{{\rm D}} $
, appear only for management approaches allowing arrival-to-hardstand and departure-to-hardstand resolutions, respectively. No more than three aircraft occupy hardstands at one time, suggesting that the 11 hardstand nodes modelled are more than enough to handle gate conflicts arising from high volume CLT traffic in simulation.
Maximum surface counts (n) for each management approach.

For all management approaches, arrival ramp taxi count
 $n_{{{\rm Ramp}}}^{{\rm A}} $
is the largest surface count, more than double any other count, making arrivals in the ramp the largest source of congestion. The management approaches with arrival resolutions (Arrival Hardstand and Dual Hardstand) reduce the maximum
 $n_{{{\rm Ramp}}}^{{\rm A}} $
and increase the maximum
 $n_{{{\rm AMA}}}^{{\rm A}} $
by sending arrivals to the hardstand. The capacity of the ramp is temporarily reduced by the complex routing of arrivals exiting hardstands. Holding arrivals at the hardstand, released them into the ramp during a higher arrival volume period and pushed the line of arrivals waiting to enter the ramp farther into the AMA.
The maximum departure taxi counts
 $n_{{{\rm Ramp}}}^{{\rm D}} $
and
 $n_{{{\rm AMA}}}^{{\rm D}} $
differ by no more than one or two aircraft between simulations suggesting the management approach does not impact departure congestion as much as arrival congestion. This may be because departure congestion is managed by metering at the gates, whereas arrivals must be allowed to enter the taxiways as soon as they land.
The Departure Hardstand approach has higher maximum
 $n_{{\rm G}}^{{\rm D}} $
than all other approaches. Whereas the No Hardstand approach is expected to have lower
 $n_{{\rm G}}^{{\rm D}} $
due to departure early release resolutions, it is unclear why the Arrival Hardstand and Dual Hardstand approaches have lower
 $n_{{\rm G}}^{{\rm D}} $
as well.
Overall, these results highlight arrivals as the greatest source of surface congestion. Whereas departure surface congestion is managed by metering at the gates, arrivals must enter the active taxiways as soon as they land. Sending arrival to hardstands manages gate conflicts, not arrival surface congestion. Developing models for managing arrival surface congestion is left for future research.
6.0. SUMMARY AND CONCLUSIONS
This paper described the SOSS fast-time simulation platform used to rapidly develop and test surface scheduling concepts. SOSS is limited in its ability to accurately model human decision making for the purposes of tactical surface management. SOSS employs pairwise conflict detection and resolution to model tactical surface management, which can enter into gridlock situations where more than two aircraft are involved. In addition, SOSS-fixed surface routing prevents the simulation from tactically rerouting aircraft to resolve potential gridlock situations. Gate conflicts forcing arrival aircraft to wait for departure aircraft to vacate their assigned gates often produce gridlock situations. New SOSS models and functionality for hardstand operations were developed to simulate gate conflict management approaches using hardstands at CLT. Four gate conflict management approaches were simulated and compared. The No Hardstand approach resolved predicted gate conflicts by releasing metered departures from the gate early. The Departure Hardstand approach introduced the option of sending an early released departure to a hardstand to be metered. The Arrival Hardstand approach resolved gate conflicts by sending arrivals to the hardstand instead of departures. The Dual Hardstand approach allowed resolutions releasing the departure from the gate early and sending either or both arrival and departure to the hardstand.
The gate conflict management approaches allowing arrivals to go the hardstand (Arrival Hardstand and Dual Hardstand) were most successful in resolving gate conflicts. They also produced more consistent scheduler predictability between departures involved in gate conflicts and other departures. However, these approaches increased the average total surface transit time ~6 min for arrivals sent to the hardstand and ~1 min for other arrivals.
Due to its relative simplicity over the Dual Hardstand approach, the Arrival Hardstand is the best approach to use for tactical scheduler development at when departures are subject to short tactical delays as seen in this study. The Dual Hardstand approach may show more advantage for its additional complexity when departures are subject to longer strategic delays from external traffic management initiatives, which is a subject for future study.
This research offers gate conflict management solutions that work around the current SOSS limitation of fixed surface routing. The ability to reroute aircraft while they are active on the surface would be a valuable enhancement to SOSS to enable more sophisticated models of tactical surface management.
ACKNOWLEDGEMENTS
This work was sponsored by NASA Airspace Operations and Safety Program’s Aviation Technology Demonstration 2 (ATD-2) subproject.