INTRODUCTION
Amazonian forests harbor much of Earth's biodiversity (Olson and Dinerstein, Reference Olson and Dinerstein2002) and are responsible for approximately 14% of carbon fixation in the terrestrial biosphere (Zhao and Running, Reference Zhao and Running2010). Because of their global importance, Amazonian rainforests are a test bed for ecological theories linking species diversity and distributions with the ecological niche (Elton, Reference Elton1927; Hutchinson, Reference Hutchinson1957; Whittaker et al., Reference Whittaker, Levin and Root1973; Clark et al., Reference Clark, Palmer and Clark1999), neutral dynamics (Hubbell, Reference Hubbell1979, Reference Hubbell2001; Terborgh, Reference Terborgh1992; Tuomisto et al., Reference Tuomisto, Ruokolainen, Kalliola, Linna, Danjoy and Rodriguez1995, Reference Tuomisto, Ruokolainen and Yli-Halla2003), climatic refugia (Haffer, Reference Haffer1969, Reference Haffer1997), and carbon flux (Junk et al., Reference Junk, Bayley and Sparks1989; Vieira et al., Reference Vieira, de Camargo, Selhorst, da Silva, Hutyra, Chambers and Brown2004; Fauset et al., Reference Fauset, Johnson, Gloor, Baker, Monteagudo M, Brienen and Feldpausch2015). Assumptions that Amazonian forests are mature and are in a state of equilibrium underlie much of this ecological research, which are subsequently passed onto global CO2 models. Some of these forests, however, may not be in equilibrium but instead are still recovering from past disturbances, though this is still highly debated (Körner, Reference Körner2003; Wright, Reference Wright2005; Fisher et al., Reference Fisher, Hurtt, Thomas and Chambers2008; McMichael et al., Reference McMichael, Matthews-Bird, Farfan-Rios and Feeley2017). Thus, it is increasingly important to incorporate long-term changes in human land use and climate into current global climate and vegetation models (Lombardo et al., Reference Lombardo, McMichael and Tamanaha2018; Morrison et al., Reference Morrison, Hammer, Popova, Madella, Whitehouse and Gaillard2018).
An emerging hypothesis is that the indigenous Native American occupants played a significant role in shaping the observed patterns of biodiversity in Amazonian forests (Balée, Reference Balée, Posey and Balée1989; Clark, Reference Clark1996; Erickson, Reference Erickson, Silverman and Isbell2008; Roosevelt, Reference Roosevelt2013; Clement et al., Reference Clement, Denevan, Heckenberger, Junqueira, Neves, Teixeira and Woods2015; Levis et al., Reference Levis, Costa, Bongers, Peña-Claros, Clement, Junqueira and Neves2017). The human history of Amazonia dates back to the early Holocene, with the oldest documented occupation sites occurring in a rock shelter near Santarem on the main Amazon River channel (Roosevelt et al., Reference Roosevelt, da Costa, Machado, Michab, Mercier, Valladas and Feathers1996). By 6000 calibrated years before present (cal yr BP), maize cultivation and plant domestication had appeared in the western regions of Amazonia (Bush et al., Reference Bush, Piperno and Colinvaux1989, Reference Bush, Correa-Metrio, McMichael, Sully, Shadik, Valencia, Guilderson, Steinitz-Kannan and Overpeck2016; Oliver, Reference Oliver, Silverman and Isbell2008; Arroyo-Kalin, Reference Arroyo-Kalin2010; Clement et al., Reference Clement, Denevan, Heckenberger, Junqueira, Neves, Teixeira and Woods2015; Brugger et al., Reference Brugger, Gobet, van Leeuwen, Ledru, Colombaroli, van der Knaap, Lombardo, Escobar-Torrez, Finsinger and Rodrigues2016), and evidence of rice domestication beginning around 5000 cal yr BP was recently discovered in southern Amazonia (Hilbert et al., Reference Hilbert, Neves, Pugliese, Whitney, Shock, Veasey, Zimpel and Iriarte2017). The frequency of sites containing evidence of cultivation and domestication increased across the Amazon basin ca. 2000 cal yr BP (Oliver, Reference Oliver, Silverman and Isbell2008; Piperno, Reference Piperno2011; Arroyo-Kalin, Reference Arroyo-Kalin2012).
Amazonia contains relatively few archaeological sites compared with the rest of South America (Goldberg et al., Reference Goldberg, Mychajliw and Hadly2016), which is likely because of the combination of a lack of preservation of sites, a lack of stone for building monuments, and a sampling bias attributable to lack of accessibility of interior forests. The two most visible legacies of ancient people in Amazonian forests are earth and soil modifications. Earthworks, berms, and raised fields have been recorded in several regions in Amazonia, particularly near the forest-savanna boundary or at the mouth of the Amazon River (Erickson, Reference Erickson2000; Pärssinen et al., Reference Pärssinen, Ranzi, Saunaluoma, Siiriäinen, Pärssinen and Korpisaari2003; Heckenberger et al., Reference Heckenberger, Russell, Fausto, Toney, Schmidt, Pereira, Franchetto and Kuikuro2008; Lombardo and Prümers, Reference Lombardo and Prümers2010; Saunaluoma, Reference Saunaluoma2010; Schaan et al., Reference Schaan, Pärssinen, Saunaluoma, Ranzi, Bueno and Barbosa2012; de Souza et al., Reference de Souza, Schaan, Robinson, Barbosa, Aragão, Marimon and Marimon2018). Ancient people also amended and modified soils, creating anthrosols called terras pretas, or Amazonian Dark Earths (hereafter ADEs). ADEs contain components such as pottery fragments, charcoal, and plant and animal biomass that increase nutrient levels and thus also increase cultivation or agricultural potential (Glaser et al., Reference Glaser, Haumaier, Guggenberger and Zech2001; Glaser and Woods, Reference Glaser and Woods2004; Glaser and Birk, Reference Glaser and Birk2012). Most earthworks and ADEs were formed in the last 2000 yr, though formation at several sites is older (Neves et al., Reference Neves, Petersen, Bartone, Heckenberger, Glaser and Woods2004; Arroyo-Kalin, Reference Arroyo-Kalin2012; Schaan et al., Reference Schaan, Pärssinen, Saunaluoma, Ranzi, Bueno and Barbosa2012).
Fires in aseasonal forests of Amazonia are usually caused by human activity, both in the present and in the past (Cardoso et al., Reference Cardoso, Hurtt, Moore, Nobre and Prins2003; Aragão et al., Reference Aragão, Malhi, Barbier, Lima, Shimabukuro, Anderson and Saatchi2008; Bush et al., Reference Bush, Silman, McMichael and Saatchi2008; Brando et al., Reference Brando, Balch, Nepstad, Morton, Putz, Coe, Silvério, Macedo, Davidson and Nóbrega2014). Some Holocene-aged lake sediments contain no evidence of cultivation nor of fire, yet neighboring lakes, less than 50 km away, have histories of cultivation and pervasive fire events spanning millennia (Bush et al., Reference Bush, Silman, de Toledo, Listopad, Gosling, Williams, de Oliveira and Krisel2007). These data highlight the relationship between people and fire in Amazonia. In the seasonal forests and savannas of southern and eastern Amazonia, fire occurrences are not dependent on human intervention, though are more frequent when humans are in the landscape (Ramos-Neto and Pivello, Reference Ramos-Neto and Pivello2000; Nepstad et al., Reference Nepstad, Lefebver, Silva, Tomasella, Schlesinger, Solorzano, Moutinho, Ray and Benito2004; Maezumi et al., Reference Maezumi, Power, Mayle, McLauchlan and Iriarte2015; Power et al., Reference Power, Whitney, Mayle, Neves, de Boer and Maclean2016).
Here we use a compilation of 14C dates from archaeological data sets, supplemented with 14C dates from soil charcoal fragments collected from aseasonal forests, to assess the temporal patterns of human activity in Amazonian forests through the Holocene using summed cumulative probability distributions (Williams, Reference Williams2012). We also predict the spatial patterns of human occupation across the Amazon basin for the precultivation period (>6000 cal yr BP), the early cultivation period (6000–2500 cal yr BP), and the late cultivation period (<2500 cal yr BP) using ensemble distribution modeling, which is a technique commonly used in modern ecological research (e.g., Araújo and New, Reference Araújo and New2007). These models are a first testable prediction of human occupation across Greater Amazonia through time during the Holocene.
METHODS
Temporal analyses
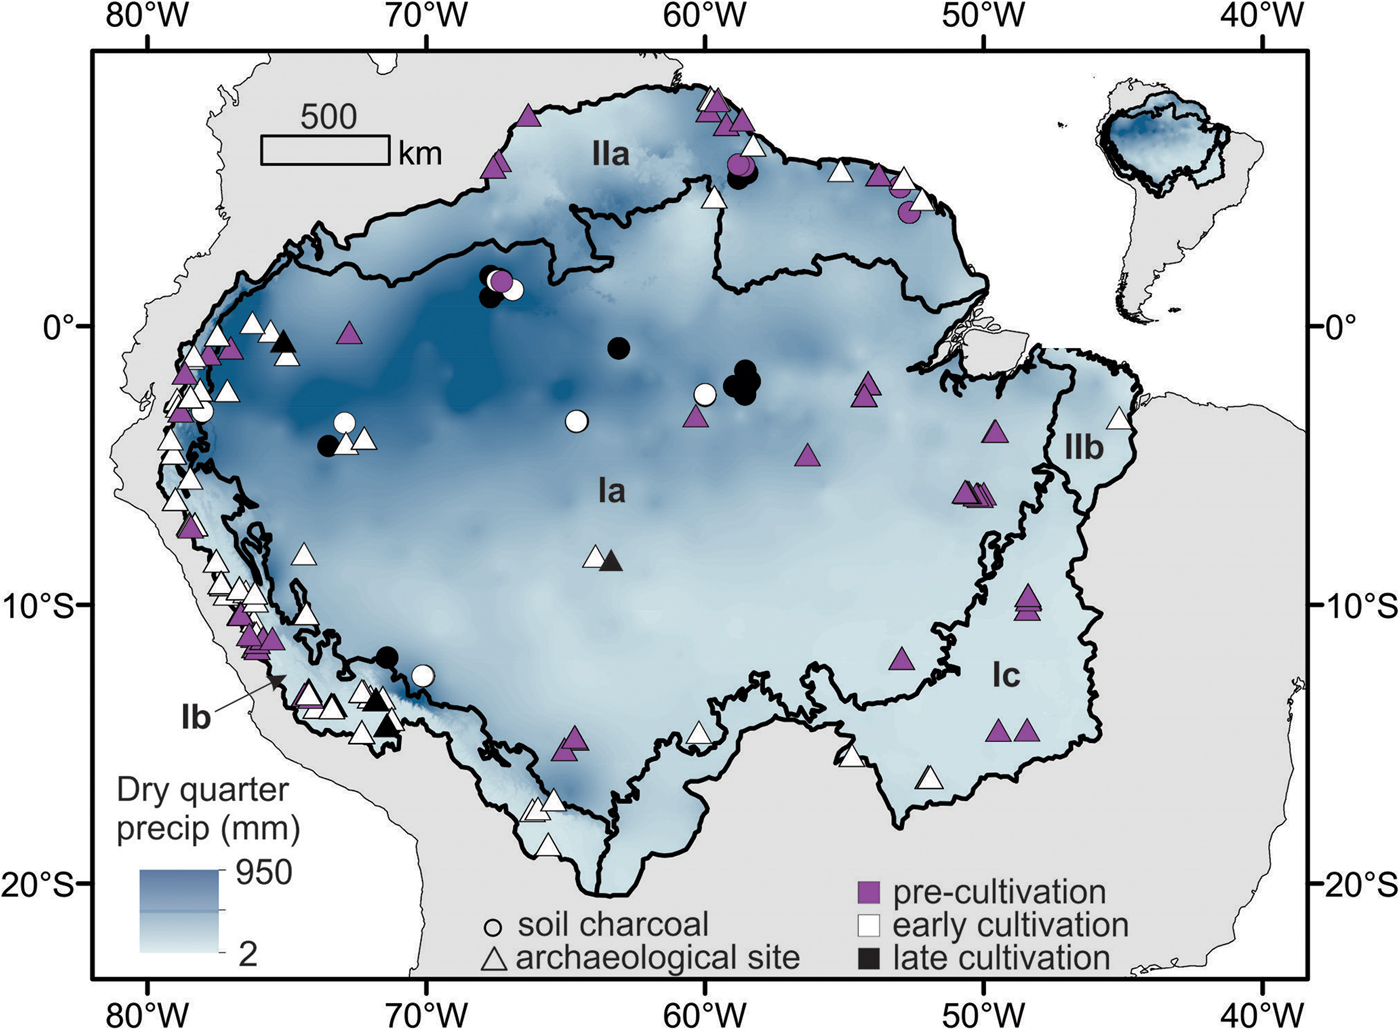
Previously published (paleo)ecological literature included a total of 211 14C accelerator mass spectrometry dates from individual charcoal fragments recovered from soils in aseasonal Amazonian forests (Saldarriaga and West, Reference Saldarriaga and West1986; Piperno and Becker, Reference Piperno and Becker1996; Sanford and Horn, Reference Sanford, Horn, Cole and Mccool2000; Santos et al., Reference Santos, Gomes, Anjos, Cordeiro, Turcq, Sifeddine, di Tada, Cresswell and Fifield2000; Carcaillet et al., Reference Carcaillet, Almquist, Asnong, Bradshaw, Carrion, Gaillard, Gajewski, Haas, Haberle and Hadorn2002; McMichael et al., Reference McMichael, Bush, Piperno, Silman, Zimmerman and Anderson2012a, Reference McMichael, Piperno, Bush, Silman, Zimmerman, Raczka and Lobato2012b, Reference McMichael, Bush, Silman, Piperno, Raczka, Lobato, Zimmerman, Hagen and Palace2013), defined here as forests containing >250 mm of rainfall during the driest three months of the year (driest quarter) (Hijmans et al., Reference Hijmans, Cameron, Parra, Jones and Jarvis2005) (Fig. 1). An additional 41 14C dates from ADE (modified soil) sites (Neves et al., Reference Neves, Petersen, Bartone, Heckenberger, Glaser and Woods2004, Reference Neves, Guapindaia, Lima, Costa, Gomes and Rostain2014; Almeida and Neves, Reference Almeida, Neves and Rostain2014), 18 dates from geoglyph sites (Schaan et al., Reference Schaan, Pärssinen, Saunaluoma, Ranzi, Bueno and Barbosa2012; Watling et al., Reference Watling, Iriarte, Mayle, Schaan, Pessenda, Loader, Street-Perrott, Dickau, Damasceno and Ranzi2017), and 607 dates from other archaeological sites (Goldberg et al., Reference Goldberg, Mychajliw and Hadly2016) were also compiled across Greater Amazonia (sensu Eva et al., Reference Eva, Colchester, Duivenvoorden, Hoogmoed, Junk, Kabat, Kruijt, Malhi, Müller and Pereira2005) from archaeological literature. Dates from ADEs and geoglyphs were usually obtained from charcoal fragments, and the archaeological dates were obtained from an array of charcoal, shell, soil, bone, and other material. All 14C dates (Supplementary Appendix 1) were calibrated using the intCal13 or shCal13 calibration curve, depending on whether they originated in the Northern or Southern Hemisphere (Reimer et al., Reference Reimer, Bard, Bayliss, Beck, Blackwell, Ramsey and Buck2013). Modern dates or those that lay outside of the calibration curve were excluded from the analyses.
Map of 14C-dated archaeological evidence and 14C-dated soil charcoal locations in Greater Amazonia (see text for references), shown in relation to dry quarter precipitation (Hijmans et al., Reference Hijmans, Cameron, Parra, Jones and Jarvis2005). The 14C-dated archaeological sites are shown as triangles; the 14C-dated soil charcoal sites are shown as circles. The colors of the triangles and circles correspond with time period of the 14C ages, as shown in the legend. The subregions of Greater Amazonia are shown as indicated in Eva et al. (Reference Eva, Colchester, Duivenvoorden, Hoogmoed, Junk, Kabat, Kruijt, Malhi, Müller and Pereira2005), which include the core subregion (Ia) and four peripheral subregions. Ia, the core subregion of Amazonia sensu stricto; Ib, Andean subregion; Ic, Planalto subregion; IIa, Guiana subregion; IIb, Gurupí subregion.

Summed probability analysis is a commonly used tool to examine the distributions of 14C dates (Stuiver and Reimer, Reference Stuiver and Reimer1993; Stuiver et al., Reference Stuiver, Reimer and Reimer2005, Reference Stuiver, Reimer, Bard, Beck, Burr, Hughen, Kromer, McCormac and Spurk2006; Williams, Reference Williams2012). The “BchronDensity” function is analogous to summed probability analysis, except that it is a Bayesian nonparametric phase model that applies a Gaussian prior distribution to the summed probabilities of the calibrated 14C dates (Parnell, Reference Parnell2016). We ran the BchronDensity function on (1) the 14C dates from soil charcoal fragments found in aseasonal forests of Greater Amazonia (N = 211), (2) the 14C dates from archaeological sites within Greater Amazonia (N = 666), and (3) the combined set of 14C dates from archaeological sites and soil charcoal within Greater Amazonia (N = 877) (Table 1). We also ran the BchronDensity function on the combined set of 14C dates for each region of Amazonia (sensu stricto, Guiana, southern Amazonia, and the Andean regions) (Fig. 1). We compared our results with previously published records of Amazonian precipitation (van Breukelen et al., Reference van Breukelen, Vonhof, Hellstrom, Wester and Kroon2008) and El Niño–Southern Oscillation (ENSO) variability (Moy et al., Reference Moy, Seltzer, Rodbell and Anderson2002).
Frequencies of the 14C dates for the various lines of evidence for human activity during the precultivation, early cultivation, and late cultivation periods. “Arch sites” indicates archaeological sites that do not contain Amazonian Dark Earth (ADE) or geoglyphs.

Geospatial analyses
For geospatial modeling of the changes in distributions of ancient people through time, we binned 14C dates from the archaeological sites and soil charcoal within Greater Amazonia into three time periods: (1) the precultivation period prior to 6000 cal yr BP (N = 215), (2) the early cultivation period from 6000 to 2500 cal yr BP (N = 430), and (3) the late cultivation period following 2500 cal yr BP (N = 232). We chose these time periods for several reasons. Human population growth estimates prior to 5500 cal yr BP in South America showed density-dependence (a logistic growth curve) but took an exponential growth form from 5500 to 2500 cal yr BP (Goldberg et al., Reference Goldberg, Mychajliw and Hadly2016). Further, the earliest maize cultivation in Amazonia was documented ca. 6000 cal yr BP (Bush et al., Reference Bush, Piperno and Colinvaux1989, Reference Bush, Correa-Metrio, McMichael, Sully, Shadik, Valencia, Guilderson, Steinitz-Kannan and Overpeck2016; Brugger et al., Reference Brugger, Gobet, van Leeuwen, Ledru, Colombaroli, van der Knaap, Lombardo, Escobar-Torrez, Finsinger and Rodrigues2016), and by 2500 cal yr BP most ancient societies documented within Greater Amazonia had transitioned to a cultivation or farming lifestyle (Oliver, Reference Oliver, Silverman and Isbell2008; Piperno, Reference Piperno2011). We performed spatial filtering on the occurrence locations for each time bin to reduce the effect of sampling bias, where all occurrence locations falling within the same grid cell were condensed to one presence (Boria et al., Reference Boria, Olson, Goodman and Anderson2014). After filtering, there were 62 occurrences in the precultivation period, 102 occurrences in the early cultivation period, and 67 occurrences in the late cultivation period used as input into the geospatial models.
We compiled raster layers of environmental characteristics likely to be associated with human occupation sites in Greater Amazonia. We compiled WorldClim bioclimatic variables (N = 19) (Hijmans et al., Reference Hijmans, Cameron, Parra, Jones and Jarvis2005) and soil characteristics from the Harmonized World Soil Database (N = 11) (Food and Agriculture Organization of the United Nations, with IIASA/ISRIC/ISS-CAS/JRC, 2009). We performed cross-correlation analyses to reduce the number of spatially autocorrelated variables in the data set and eliminated variables whose Pearson correlation coefficient exceeded 0.75 (Supplementary Appendix 2) (Buermann et al., Reference Buermann, Saatchi, Smith, Zutta, Chaves, Milá and Graham2008; Merow et al., Reference Merow, Smith and Silander2013; McMichael et al., Reference McMichael, Palace, Bush, Braswell, Hagen, Neves, Silman, Tamanaha and Czarnecki2014a). From the remaining variables, we chose the ones that were easiest to interpret in the context of ancient humans, which included altitude (highly correlated with mean annual temperature), annual precipitation (BIO 12), and precipitation of driest quarter (BIO17) for the climatic variables. From the soil variables, we included subsoil clay, organic carbon, and silt percentages in the geospatial models (Supplementary Fig. 1).
We also generated geospatial predictor variables based on terrain and hydrologic characteristics of Amazonia. River data were obtained from the HydroSheds data set, and rivers were defined as those containing >15,000 “upcells,” which is a value representative of flow accumulation (number of upstream cells) at a given location (Lehner et al., Reference Lehner, Verdin and Jarvis2008). This value was chosen because it contains not only the major tributaries of the Amazon River but also smaller tributaries that may have served as connective routes between occupation sites. From these data, we generated a “distance to nearest river” raster layer to use as a predictor variable (McMichael et al., Reference McMichael, Palace, Bush, Braswell, Hagen, Neves, Silman, Tamanaha and Czarnecki2014a) (Supplementary Fig. 1). Elevation data were obtained from Shuttle Radar Topography Mission (Jarvis et al., Reference Jarvis, Reuter, Nelson and Guevara2008). From these elevation data, we also generated a raster predictor of roughness, which is the difference between the maximum and minimum elevation of a grid cell and its eight neighboring grid cells (Wilson et al., Reference Wilson, O'Connell, Brown, Guinan and Grehan2007). All predictor variables were compiled or generated at 1 km2 spatial resolution for the extent of Greater Amazonia and resampled to same extent (Supplementary Fig. 1).
We used the georeferenced locations of the spatially filtered data set of 14C dates from the soil charcoal and archaeological sites, and the environmental predictor variables described previously, as inputs into the geospatial model. Our data set required a modeling approach that uses presence-only data instead of presence-absence data, which are not available. Species distribution models (SDMs) are commonly used in ecological and biogeographic research and require only occurrence (presence) locations and a set of environmental variables as inputs to predict the most suitable habitat of an organism across a landscape. Several algorithms are commonly used in species distribution modeling to predict the suitable habitat, but the predicted distributions vary between algorithms (Elith et al., Reference Elith, Graham, Anderson, Dudík, Ferrier, Guisan, Hijmans, Huettmann, Leathwick and Lehmann2006; Marmion et al., Reference Marmion, Parviainen, Luoto, Heikkinen and Thuiller2009). Because of this variance, ensemble distribution models, which are based on a weighted average of individual SDMs (described subsequently), have become commonly used to account for potential error associated with any one algorithm (Araújo and New, Reference Araújo and New2007). We used an ensemble distribution model to predict the distribution of ancient people across the Amazon basin for the precultivation, early cultivation, and late cultivation periods.
The ensemble model for each time bin was composed of (1) a generalized linear model (GLM), (2) a generalized additive model (GAM) (Hastie and Tibshirani, Reference Hastie and Tibshirani1990; Wood, Reference Wood2011), (3) a generalized boosted regression model (Friedman, Reference Friedman2001), (4) a random forest (RF) model (Breiman, Reference Breiman2001), and (5) a Maxent model (Phillips et al., Reference Phillips, Anderson and Schapire2006). We chose this array of SDMs because they have been shown to perform well using simulated species with known distributions and known species-environment relationships (Elith and Graham, Reference Elith and Graham2009). The generalized linear and generalized additive models were run with epsilon values of 1 x 10⁻⁸ and 500 iterations and evaluated using Akaike information criterion (Wood, Reference Wood2006). The generalized boosted regression model was parameterized with a shrinkage threshold of 0.001. The generalized boosted regression model and the RF model were run with a maximum of 2500 trees and a minimum size of one observation in each node (Liaw and Wiener, Reference Liaw and Wiener2002; Ridgeway, Reference Ridgeway2015). Maxent models were run with default parameters (Hijmans et al., Reference Hijmans, Phillips, Leathwick and Elith2012).
The SDM algorithms compensate for the lack of absence data by generating pseudo-absences, which represent the potential of environmental conditions (Barbet-Massin et al., Reference Barbet-Massin, Jiguet, Albert and Thuiller2012). Pseudo-absence selection for each algorithm in our geospatial models was based on the recommendations from Barbet-Massin et al. (2012). These recommendations included 10,000 pseudo-absences with an equal weighting for presences and absences in the generalized linear, generalized additive, and Maxent models and using the same number of pseudo-absences as presences for boosted regression trees and RF models (Barbet-Massin et al., Reference Barbet-Massin, Jiguet, Albert and Thuiller2012).
For each SDM composing the ensemble distribution model, we performed five-fold cross validation and then repeated the model run 10 times. Five-fold cross validation includes breaking the occurrence points into five groups (folds), where four folds were used to train the model and the other fold was used to test the model. This process was repeated until each of the five folds was used once to test the model. We ran the five-fold cross validation procedure 10 times to derive robust measures of accuracy and uncertainty in the models. Model performance was assessed using AUC scores (area under the receiver operating curve), a performance metric that assesses the ability of a model to distinguish locations where the observations are present and absent with that of random expectation (AUC = 0.5) (Elith et al., Reference Elith, Graham, Anderson, Dudík, Ferrier, Guisan, Hijmans, Huettmann, Leathwick and Lehmann2006; Wisz et al., Reference Wisz, Hijmans, Li, Peterson, Graham and Guisan2008). AUC scores for each SDM were used to weight their importance in the final ensemble model, and the score had to exceed 0.6 for inclusion in the model. Model uncertainty was also mapped across Greater Amazonia, which indicated areas where the spatial predictions of each SDM had the most variance.
A threshold that equalized sensitivity (the proportion of correctly predicted presences) and specificity (proportion of correctly predicted absences) (Liu et al., Reference Liu, Berry, Dawson and Pearson2005) in the final ensemble model was used generate the binary prediction (presence/absence) of human occupation. Pearson's correlation coefficient was used to assess the relative variable importance in each of the ensemble distribution models (precultivation, early cultivation, and late cultivation). In this process, Pearson's correlation coefficient was calculated for the predictions of the full model against a model lacking the given variable. The size of the correlation coefficients thus indicated relative variable importance (Thuiller et al., Reference Thuiller, Lafourcade, Engler and Araújo2009). We assessed the responses of the ensemble model to the four most important predictor variables by laying down 5000 random points across Greater Amazonia and comparing the settlement probabilities to the values of those predictor variables.
All analyses were performed in R (R Development Core Team, 2013). Temporal analyses were performed using the “bchron” package (Parnell, Reference Parnell2016), and geospatial analyses were performed using the “rgdal” (Bivand et al., Reference Bivand, Keitt and Rowlingson2014), “raster” (Hijmans and van Etten, Reference Hijmans and van Etten2012), and “ssdm” (Schmitt et al., Reference Schmitt, Pouteau, Justeau, Boissieu, Birnbaum and Golding2017) packages.
RESULTS
Temporal analyses
Of the 877 total dates, 215 occurred in the precultivation period, 430 occurred in the early cultivation period, and 232 occurred in the late cultivation period (Table 1). In the precultivation period, 88% of the dates were from archaeological sites, and 12% of the dates were from soil charcoal. Dated ADEs appeared in the early cultivation period but accounted for only 2% of total dates. Archaeological sites and soil charcoal comprised the remaining 87% and 11% of dates, respectively. The frequency of ADE dates increased and the earliest dates of geoglyphs were recorded in the late cultivation period (Table 1). Soil charcoal comprised 59% of the late cultivation dates. ADEs and geoglyphs comprised 15% and 8% of the late cultivation dates, respectively. Archaeological sites comprised 18% of the dates (Table 1).
The densities of soil charcoal dates were low in the precultivation period, began increasing in the early cultivation period, and were highest in the late cultivation period (Fig. 2a). The densities of archaeological sites fluctuated at low levels during the precultivation period and significantly increased during the early cultivation period (Fig. 2b). The density of archaeological sites in the late cultivation period decreased ca. 2500 cal yr BP (Fig. 2b), and this decline was most prominent in Andean regions (Fig. 2d). The addition of archaeological sites during the late cultivation period was primarily the result of the addition of dated ADE and geoglyph material from Amazonia sensu stricto (Table 1, Fig. 2b and d). The combined data set of dated ADE sites, geoglyphs, and soil charcoal begins to fill in some of the gaps of the temporal trajectory of human occupation through the late cultivation period in Greater Amazonia, particularly within Amazonia sensu stricto and the Guiana regions (Fig. 2c and d).
Probability densities of 14C dates for soil charcoal recovered in aseasonal forests (a), archaeological sites located within Greater Amazonia (b), the combined data set (c), and the combined data set shown by regions outlined in Figure 1 (d). Gray lines represent the summed probability distribution; black lines represent the density of 14C dates in panels a–c. The line color and type corresponds with the four regions examined in panel d.

Geospatial analyses
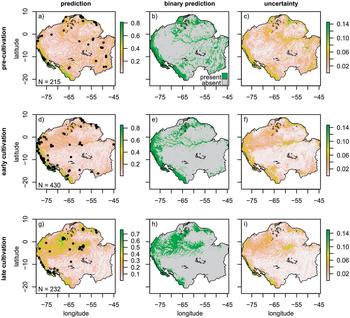
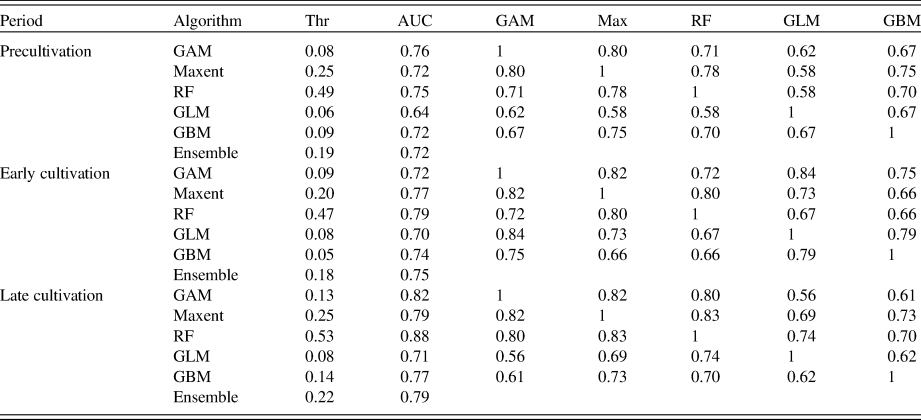
The ensemble distribution models of the precultivation period showed that the highest probability of human occupation was around the periphery of Amazonia, including the Andean areas, the northern and southern rim, and along the central eastern portions of the main Amazonian river channel and some of its smaller tributaries (Fig. 3a and b). Probabilities of occupation were lowest in the western Amazonian lowlands (Fig. 3a), and much of the area is predicted to have been unoccupied during the precultivation period (Fig. 3b). AUC values of the individual SDMs used to generate the ensemble model ranged from 0.64 in the GLM to 0.76 in the GAM (Table 2). The GAM outputs were highly correlated (Pearson correlation coefficient >0.7) with the Maxent model (0.8) and the RF model (0.71) (Table 2). Model uncertainty in the precultivation period was highest in areas with the highest likelihood of human occupation (Fig. 3c).
Settlement probability distributions, binary prediction of settlement, and model uncertainty estimates from ensemble models of the precultivation (a–c), early cultivation (d–f), and late cultivation (g–i) periods in Greater Amazonia. The number of sites remaining after spatial filtering is shown, and those locations are represented by black circles. Model uncertainty was calculated as between-model variance (Schmitt et al., Reference Schmitt, Pouteau, Justeau, Boissieu, Birnbaum and Golding2017).

Results of the individual species distribution modeling algorithms and total ensemble model, and correlation matrix showing the amount of agreement between algorithms. “Thr” is the threshold used to generate binary predictions of presence and absence of people for each time bin. “AUC” is the area under the receiver operating curve, which measures model performance. “GAM” is the generalized additive model. “Max” is the Maxent model. “RF” is the random forest model. “GLM” is the generalized linear model. “GBM” is the generalized boosted regression.

The model for the early cultivation period showed that dated material representing humans remained around the periphery of Amazonia but spread into western Amazonia (Fig. 3d and e). The AUC values of the model ranged from 0.7 in the GLM to 0.79 in the RF model (Table 2). The RF model outputs were highly correlated (>0.7 coefficient) with the outputs of the Maxent model (0.8) and the GAM (0.72) (Table 2). Model uncertainty for the early cultivation period was highest around the peripheral regions and the main Amazon channel (Fig. 3f). By the late cultivation period, evidence of human occupation became more common across western Amazonia (Fig. 3g and h). AUC values ranged from 0.71 in the GLM to 0.88 in the RF model (Table 2). The RF model outputs were highly correlated (>0.7 coefficient) with the outputs of the Maxent model (0.83) and GAM (0.8) (Table 2). Model uncertainty was highest in the peripheral and western regions (Fig. 3i).
Elevation, distance to river, and terrain roughness were the most important predictor variables in the precultivation model, with permutation importance values of 24%, 20.9%, and 20.1%, respectively (Table 3). The predictor variables for the early cultivation model had similar permutation importance values to the precultivation model, though the relative importance of elevation increased at the expense of distance to river and terrain roughness (Table 3). Precipitation seasonality became the most important predictor variable in the late cultivation model (29%), and the permutation importance of elevation fell to 12% (Table 3). Settlement probabilities of occupation were highest in areas with higher elevation during the pre- and early cultivation periods and rose in lowland areas during the late cultivation period (Fig. 4a–c).
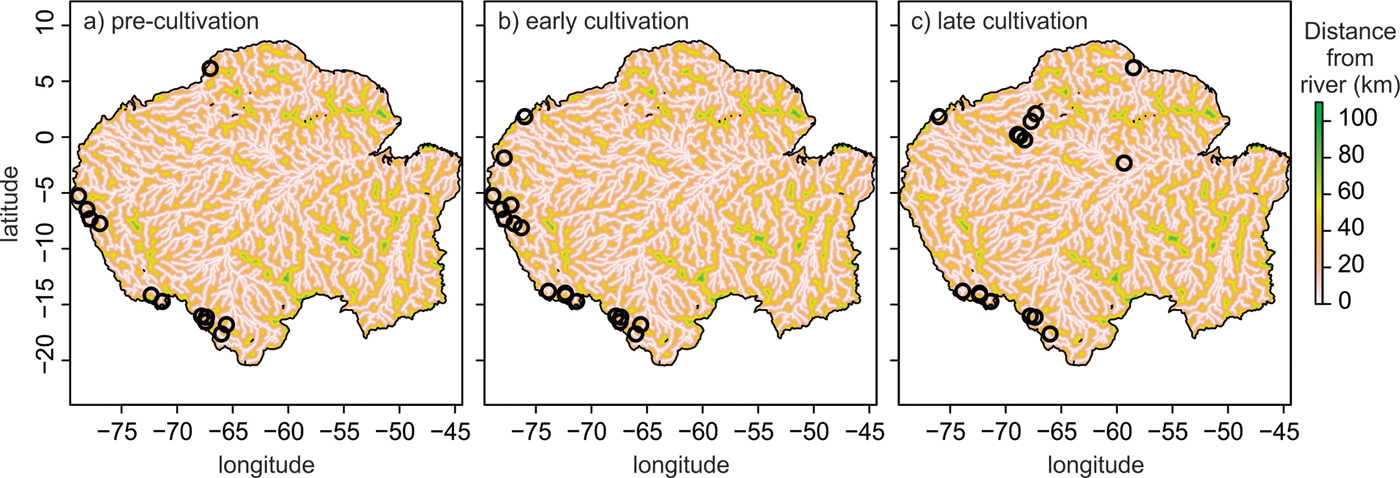
Settlement probability during the precultivation, early cultivation, and late cultivation periods as a function of elevation (a–c), distance from river (d–f), terrain roughness (g–i), and dry quarter precipitation (j–l). The response clouds for each panel represent values derived from 5000 randomly distributed points across Greater Amazonia. Sites that do not fall within expected values (see text for details) are highlighted as black circles and are shown spatially in Figure 7. m asl, meters above sea level.

Relative importance values of predictor variables in ensemble distribution models for the precultivation, early cultivation, and late cultivation periods. The three most important predictor variables for each model are shown in bold.

Settlement probabilities were in general highest in areas closest to rivers during all time periods, though some areas farther away from rivers also had high settlement probabilities (black circles, Fig. 4 d–f). Settlement probabilities generally increased with increasing terrain roughness during the precultivation period, though increased in the flatter areas during the early and late cultivation periods (Fig. 4g–i). During the pre- and early cultivation periods, settlement probabilities decreased with increasing dry season precipitation (Fig. 4j–k). This pattern reversed direction, however, during the late cultivation period, and settlement probabilities increased with increasing dry season precipitation (Fig. 4l).
DISCUSSION
Fire: the role of people and climate
Fire requires fuel, low humidity, and an ignition source. Amazonia is not short of fuel, but humidity varies across the basin both seasonally and interannually (e.g., Marengo et al., Reference Marengo, Druyan and Hastenranth1993). Ignition can come from lightning strike or human activity. In moist forested areas, lightning-induced fires do not spread and die out in just a few meters, unless forest flammability has been increased by human activities (e.g., Cochrane, Reference Cochrane2003; Ray et al., Reference Ray, Nepstad and Moutinho2005; Aragão et al., Reference Aragão, Malhi, Barbier, Lima, Shimabukuro, Anderson and Saatchi2008; Malhi et al., Reference Malhi, Roberts, Betts, Killeen, Li and Nobre2008). Deforestation creates edge effects, while selective logging thins forest canopies, and both result in reduced atmospheric humidity and drier microclimates that favor the ignition and spread of fire (Nepstad et al., Reference Nepstad, Carvalho, Barros, Alencar, Capobianco, Bishop, Moutinho, Lefebvre, Silva and Prins2001; Cochrane, Reference Cochrane2003).
Holocene-aged lake sediment records in the aseasonal forests of Amazonia show the same pattern, with contrasting fire histories according to local land use. Some records lack charcoal completely, whereas others within adjacent watersheds contain abundant charcoal, providing evidence that the fires were a result of a human origin (Bush and Silman, Reference Bush and Silman2007; Bush et al., Reference Bush, Silman, de Toledo, Listopad, Gosling, Williams, de Oliveira and Krisel2007). In the seasonal forests and savannas of Amazonia, fires can ignite and spread from lightning, but fire frequency increases when humans are present in the landscape (Ramos-Neto and Pivello, Reference Ramos-Neto and Pivello2000; Maezumi et al., Reference Maezumi, Power, Mayle, McLauchlan and Iriarte2015; Power et al., Reference Power, Whitney, Mayle, Neves, de Boer and Maclean2016). To minimize the influence of rare natural fires on our analysis, we only used soil charcoal records from portions of Amazonia that lack a dry season (Fig. 1)—that is, regions where fire is most likely to be of human origin. In filtering this data set, we excluded 148 dated soil charcoal fragments that were found in the more seasonal areas of Amazonia (Supplementary Fig. 2). The majority of excluded dates were from the late cultivation period, and decreased density during that period was the only effect of excluding these dates (Supplementary Fig. 3). The spatial prediction was also similar even after excluding these dates, because there were archaeological sites nearby that were included in the model (Supplementary Fig. 2).
If lightning-induced fires were the source of soil charcoal, it would be parsimonious to expect charcoal age distributions to peak in the driest time of the Holocene. The period from ca. 10,000 to 6000 cal yr BP was the driest period in the human history of Amazonia (van Breukelen et al., Reference van Breukelen, Vonhof, Hellstrom, Wester and Kroon2008; Mosblech et al., Reference Mosblech, Bush, Gosling, Hodell, Thomas, van Calsteren, Correa-Metrio, Valencia, Curtis and van Woesik2012) (Fig. 5a), but this period shows little evidence of fire (Fig. 5a and b). Instead, the highest frequency of 14C dates occurred during the wettest part of the Holocene (ca. last 4000 yr) (Fig. 5a and b), a time when human populations in South America began increasing exponentially (Goldberg et al., Reference Goldberg, Mychajliw and Hadly2016) and evidence of cultivation was increasing in frequency throughout the Amazonian landscape (Piperno, Reference Piperno2011).
Comparison of densities of 14C-dated archaeological sites and soil charcoal fragments with climatic reconstructions from Greater Amazonia. (a) δ18O measurements from a stalagmite from the Tigre Perdido Cave in western Amazonia (van Breukelen et al., Reference van Breukelen, Vonhof, Hellstrom, Wester and Kroon2008). (b) Summed probability (gray line) and Bchron densities (black line) from 14C-dated archaeological sites and soil charcoal fragments. (c) Red intensity measurements from Lake Pallcacocha, Ecuador, representing El Niño frequency through time; higher intensity values correspond with higher intensity of El Niño (Moy et al., Reference Moy, Seltzer, Rodbell and Anderson2002).

Though the late Holocene in Amazonia was generally wetter than the early Holocene (Fig. 5a) (van Breukelen et al., Reference van Breukelen, Vonhof, Hellstrom, Wester and Kroon2008), climatic variability increased, including the frequency of droughts induced by ENSO events (Fig. 5c) (Moy et al., Reference Moy, Seltzer, Rodbell and Anderson2002). Coincident with the increase in ENSO frequency ca. 4500 cal yr BP was an increase in the density of 14C dates (Fig. 5b). After 4500 cal yr BP, the densities of 14C dates roughly follow fluctuations in ENSO frequency (Fig. 5b and c). This finding is not surprising because of the synergistic effect of drought, humans, and fire observed in both modern forests and in paleoecological records (Cochrane, Reference Cochrane2003, Reference Cochrane, Bush, Flenley and Gosling2011; Bush et al., Reference Bush, Silman, McMichael and Saatchi2008; Brando et al., Reference Brando, Balch, Nepstad, Morton, Putz, Coe, Silvério, Macedo, Davidson and Nóbrega2014).
Humans are known to have used fire extensively to manage land, and charcoal is a particularly important component of ADE, which was formed primarily during the late cultivation period (Glaser and Woods, Reference Glaser and Woods2004; Glaser and Birk, Reference Glaser and Birk2012). The summed probability and probability density analysis of the 211 14C-dated soil charcoal fragments closely match the pattern found in archaeological sites during this time (Fig. 2a and b), further indicating a human origin of the fires. Pre-Columbian land management practices, particularly those associated with ADE formation, likely created positive feedback mechanisms of forest flammability similar to those observed in modern forests. In these settings, canopy cover and relative humidity would have been reduced, and the chance of subsequent ignitions and fire spread would have increased.
14C dates: the good, the bad, and the ugly
The use of summed probability analysis of 14C dates in archaeological surveys is not without its problems (Williams, Reference Williams2012 and references therein). One example is biases in intrasite dating (Williams, Reference Williams2012). At a given site, 14C dates are usually collected at the base or bottom of an occupation to obtain a basal age. This suggests that our data set of 14C dates accurately captures the onset of humans across Greater Amazonia. Besides basal ages, additional 14C dates are usually obtained at transitions (e.g., stratigraphic changes), or at the uppermost layer of an occupation. Such “top and bottom” sampling results in undersampling of the full period of occupation, leaving uncertainty regarding the continuous nature of the occupation (Williams, Reference Williams2012).
There are also statistical issues that complicate the use of summed probability analysis for reconstructing human activity. Previous studies using the summed probability approach with 14C dates suggested a minimum of 500–800 dates over time scales of 40,000 yr were needed to obtain reliable reconstructions (Michczynska and Pazdur, Reference Michczynska and Pazdur2004; Williams, Reference Williams2012). Our data set covers a much smaller temporal window, but the archaeological data set (Fig. 2b) and the combined archaeological and soil charcoal data set (Fig. 2c) meet these criteria. The soil charcoal data set only has 211 dates (Fig. 2a), but we are only interpreting the combined data set of archaeological sites with soil charcoal (N = 877). To further avoid the problems with calibration effects in the 14C calibration curve (Michczynski and Michczynska, Reference Michczynski and Michczynska2006; Michczynska et al., Reference Michczynska, Michczynski and Pazdur2007; Williams, Reference Williams2012), we focus our analysis on the density curves instead of the raw summed probability data (Parnell, Reference Parnell2016), though we show both (Fig. 2). We also show the regional summed probability data (Fig. 2d), but given the low number of dates in the southern Amazon and Guiana regions, the temporal trajectories are likely to change as new data are collected.
The density curves and the summed probability analysis for the archaeological sites in Greater Amazonia show a marked decline in 14C dates from 2500 to 1800 cal yr BP (Fig. 2b). This is not a steep section in the radiocarbon record that allows few calibration solutions in this window (Blaauw, Reference Blaauw2010; Williams, Reference Williams2012). The period from 2500 to 2000 cal yr BP includes the period covered in the Goldberg et al. (Reference Goldberg, Mychajliw and Hadly2016) study, so the pattern is also not a result of the termination of this data set at 2000 cal yr BP. The pattern is also most prominent in the Andean regions (Fig. 2d). Potential explanations for the lower than expected number of dates in this period are a genuine decline in population and occupation or a period of settled occupation with few initiations or terminations (above). Either of these explanations would cause disquiet in some section of the research community, and it remains a problem without an answer. Climatically, the wettest portions of the Holocene occur just prior to the decline in 14C dates (Fig. 5a), and the decline occurs during a time when El Niño frequency was lower than it had been in the last 1000 yr (Fig. 5c).
Holocene penetration of Amazonian forests
Through the precultivation period, when South American population growth was still in logistic form (i.e., density dependent) (Goldberg et al., Reference Goldberg, Mychajliw and Hadly2016), most dated human activity was concentrated around the periphery of Greater Amazonia and along the eastern Amazon River channel and its larger tributaries (Fig. 3a and b). The peripheral regions of Greater Amazonia included the Andean regions, the seasonally flooded savannas around the mouth of the Amazon River and the southern and northern rims of the basin, and the dry forests in southeastern regions. Many of these peripheral regions, such as Andean regions, the Llanos de Moxos in Bolivia (Erickson, Reference Erickson2000; Lombardo and Prümers, Reference Lombardo and Prümers2010), or Marajó Island at the mouth of the Amazon (Roosevelt, Reference Roosevelt1991; Schaan, Reference Schaan2004, 2010) remained inhabited through multiple periods in the Holocene and are some of the most archaeologically rich regions of Amazonia (Fig. 6a). The wettest tropical lowland forests (Fig. 1) had a lighter human footprint during the precultivation period than other regions in Greater Amazonia (Fig. 6a). Archaeological sampling has been conducted at several locations in the lowland western Amazonian forests (Fig. 1), yet the onset of occupation at most of these sites does not occur until the early and late cultivation periods (Figs. 3, 6).
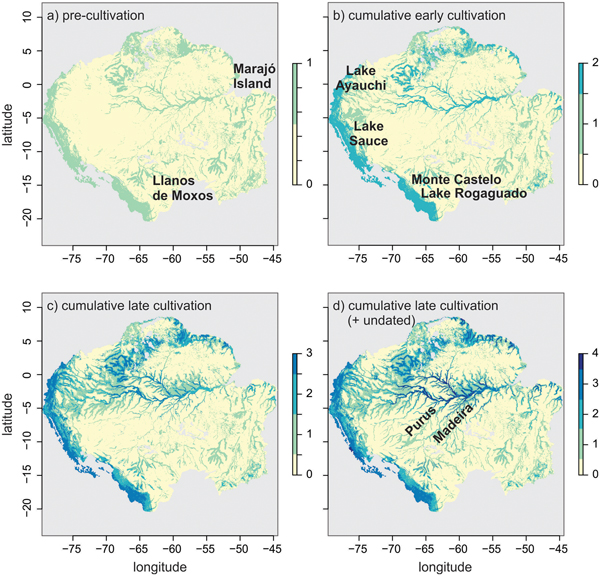
Cumulative binary predictions generated by the ensemble distribution models for pre-Columbian people through the Holocene in Greater Amazonia. (a) Precultivation prediction. (b) Summed binary prediction of the precultivation and early cultivation periods. (c) Summed binary prediction of the precultivation, early cultivation, and late cultivation periods. (d) Summed binary prediction of the precultivation, early cultivation, late cultivation, and model of dated plus undated archaeological material.

Because the onset of occupation is the most likely event to be dated in an archaeological setting (Williams, Reference Williams2012), we cannot assume that the spatial prediction for the subsequent early cultivation period (Fig. 3d and e) represents the total distribution of people across the landscape. Many areas that were occupied in the precultivation period likely remained so through time yet have no corresponding 14C evidence. Thus, we suggest that the cumulative prediction of the precultivation and early cultivation period is a more accurate representation of the distribution of people from 6000 to 2500 cal yr BP (Fig. 6b).
The Andean regions, seasonally flooded savannas, and Amazon River channel and major tributaries had the highest likelihood of occupation through the early cultivation period (Fig. 6b). The spatial prediction highlights centers of early plant domestication and cultivation during this period (Clement, Reference Clement1988; Oliver, Reference Oliver, Silverman and Isbell2008; Arroyo-Kalin, Reference Arroyo-Kalin2010, Reference Arroyo-Kalin2012; Piperno, Reference Piperno2011; Fuller et al., Reference Fuller, Denham, Arroyo-Kalin, Lucas, Stevens, Qin, Allaby and Purugganan2014; Clement et al., Reference Clement, Denevan, Heckenberger, Junqueira, Neves, Teixeira and Woods2015; Hilbert et al., Reference Hilbert, Neves, Pugliese, Whitney, Shock, Veasey, Zimpel and Iriarte2017; Levis et al., Reference Levis, Costa, Bongers, Peña-Claros, Clement, Junqueira and Neves2017). Of the existing lake sediment records in Greater Amazonia, which were not used to construct our models, three show evidence of maize during the early cultivation period, beginning around 6000 cal yr BP. Lake Ayauchi (Bush et al., Reference Bush, Piperno and Colinvaux1989) and Lake Sauce (Bush et al., Reference Bush, Correa-Metrio, McMichael, Sully, Shadik, Valencia, Guilderson, Steinitz-Kannan and Overpeck2016) lie in wet tropical forests in the foothills of the eastern Andean flank (Fig. 6b). Lake Rogaguado (Fig. 6b) (Brugger et al., Reference Brugger, Gobet, van Leeuwen, Ledru, Colombaroli, van der Knaap, Lombardo, Escobar-Torrez, Finsinger and Rodrigues2016) lies in the seasonally flooded savannas of the Llanos de Moxos, along the southern rim of Amazonia (Fig. 6a). Domesticated rice was found nearby in the Llanos de Moxos ca. 4000 cal yr BP in the Monte Castelo shell mound (Fig. 6b) (Hilbert et al., Reference Hilbert, Neves, Pugliese, Whitney, Shock, Veasey, Zimpel and Iriarte2017). All of these sites are located primarily in areas near the Andean regions and seasonally flooded savannas and are absent from the interior lowland forests, which correspond with model predictions (Fig. 6a and b).
Previous estimates of the demography of South America did not report on trends over the last 2000 yr (Goldberg et al., Reference Goldberg, Mychajliw and Hadly2016). This omission was because many occupation sites did not contain an uppermost date (Williams, Reference Williams2012), rather than it being a period that lacked human influence (Goldberg et al., Reference Goldberg, Mychajliw and Hadly2016). By adding (1) the soil charcoal dates collected in paleoecological surveys and (2) the dates from the ADEs and geoglyphs to the archaeological database, we were able to begin filling in the missing sections of the population growth trajectory in Greater Amazonia over the last 2000 yr (Fig. 2, Table 1) (also see Arroyo-Kalin, Reference Arroyo-Kalin2018).
The models generated in this study, however, did not include undated archaeological sites, which compose the majority of known sites. The cumulative model of the precultivation, early cultivation, and late cultivation periods (Fig. 6c) is in general agreement with previously published models predicting the distributions of pre-Columbian people using all undated sites (N = 2013) (Fig. 6d) (McMichael et al., Reference McMichael, Palace, Bush, Braswell, Hagen, Neves, Silman, Tamanaha and Czarnecki2014a, Reference McMichael, Palace and Golightly2014b, Reference McMichael, Matthews-Bird, Farfan-Rios and Feeley2017). One difference, however, is that the late cultivation period model underestimated the distribution of people along the Madeira and Purus Rivers (Fig. 6d). This is a region filled with undated ADEs in the lower river sections and earthworks in the upper river sections (Schaan et al., Reference Schaan, Pärssinen, Saunaluoma, Ranzi, Bueno and Barbosa2012; Neves et al., Reference Neves, Guapindaia, Lima, Costa, Gomes and Rostain2014). It is widely believed that the majority of undated ADEs and earthworks were formed mainly from 2000 to 500 cal yr BP, during the late cultivation period, though some ADEs along the Madeira River have been dated to the early cultivation period (Neves et al., Reference Neves, Petersen, Bartone, Heckenberger, Glaser and Woods2004, Reference Neves, Guapindaia, Lima, Costa, Gomes and Rostain2014; Schaan et al., Reference Schaan, Pärssinen, Saunaluoma, Ranzi, Bueno and Barbosa2012). The compilation of dated material in our study supports this idea; 83% of ADEs (34 out of 41) and 100% of geoglyphs were dated to the late cultivation period (Table 1). Thus, the model of the late cultivation period is an underestimation and reflects the lack of dated material. The cumulative model that includes the abundance of undated material, most likely from the late cultivation period, reflects a more accurate distribution of people during this time (Fig. 6c and d).
The spatiotemporal analyses of pre-Columbian people across Greater Amazonia shows the transition of people occupying primarily the edges and peripheral regions during the pre- and early cultivation periods and penetrating the interior lowland forests primarily in the late cultivation period (Figs. 3, 4, 6). Elevation, distance to river, terrain roughness, and dry quarter precipitation (seasonality) were the most important environmental characteristics driving the changes in distributions of people across these time bins (Table 3, Fig. 4), which is in agreement with previously published cumulative models of pre-Columbian people using all dated and undated sites (Fig. 6d) (McMichael et al., Reference McMichael, Palace, Bush, Braswell, Hagen, Neves, Silman, Tamanaha and Czarnecki2014a, Reference McMichael, Matthews-Bird, Farfan-Rios and Feeley2017). The models presented here, however, can explain some of the variation seen in the cumulative model. The effect of precipitation seasonality was minimalized in previously published models, and this is likely because the direction of the response changed through time (Fig. 4j–l). The dramatic increase in settlement probability in the aseasonal forests (those with high dry season precipitation) during the late cultivation period further suggests a light human footprint in those areas through earlier parts of the Holocene (Fig. 6).
The river system of Amazonia provides connectivity, strategic positioning, and increased resource availability compared with interfluvial (terra firme) forests, and the importance of the river system has long been recognized (Denevan, Reference Denevan1996). There is no doubt that the pre-Columbian people of Amazonia sensu stricto settled near the major rivers; most ADEs are found in riverine areas (McMichael et al., Reference McMichael, Palace, Bush, Braswell, Hagen, Neves, Silman, Tamanaha and Czarnecki2014a; Bush et al., Reference Bush, McMichael, Piperno, Silman, Barlow, Peres, Power and Palace2015). Much debate, however, still surrounds the influence of pre-Columbian people in the interfluvial forests (McMichael et al., Reference McMichael, Piperno, Bush, Silman, Zimmerman, Raczka and Lobato2012b; Watling et al., Reference Watling, Iriarte, Mayle, Schaan, Pessenda, Loader, Street-Perrott, Dickau, Damasceno and Ranzi2017; de Souza et al., Reference de Souza, Schaan, Robinson, Barbosa, Aragão, Marimon and Marimon2018). Our models begin to reconcile this debate. Across all time bins, some regions contained high settlement probabilities even at distances greater than 25 km away from a major river (Fig. 4, black circles). During the pre- and early cultivation periods, this deviation away from rivers occurred primarily in the Andean regions and along the southern rim, including the Llanos de Moxos region (Fig. 7a and b). It is likely that pre-Columbian inhabitants of the lowland interior wet forests, when present, only began to penetrate the interfluvial forests during the late cultivation period (Fig. 7c).
The spatial distribution of points that do not fit the expected decline in settlement probability at distances >25 km from a river (Fig. 4) is shown for the precultivation (a), early cultivation (b), and late cultivation (c) periods.

Amazonia is not homogenous, and environmental characteristics play a significant role in structuring the spatial and temporal settlement patterns, and also the land use activities, of pre-Columbian people. In the Andean regions and seasonally flooded savannas along the southern rim, people occupied the forests throughout the Holocene (Figs. 3, 6), were not confined to major rivers (Figs. 4, 7), and began cultivating and domesticating crops earlier than in the interior lowland forests (Fig. 6). These peripheral regions also contain abundant earthworks and earthwork complexes (Erickson, Reference Erickson2000; Schaan et al., Reference Schaan, Pärssinen, Saunaluoma, Ranzi, Bueno and Barbosa2012; de Souza et al., Reference de Souza, Schaan, Robinson, Barbosa, Aragão, Marimon and Marimon2018). In the lowland interior forests, people were located primarily along rivers through most of the Holocene (Figs. 3, 6). Earthworks can be found along the main Amazon channel (Neves and Petersen, Reference Neves, Petersen, Balee and Erickson2006) and at Marajó Island at the mouth of the Amazon River (Roosevelt, Reference Roosevelt1991; Schaan, Reference Schaan2010) (Fig. 6a), but ADEs are the most common archaeological feature in the lowland interior forests (WinklerPrins and Aldrich, Reference WinklerPrins and Aldrich2010). Interestingly, ADEs are typically absent from the peripheral areas of Greater Amazonia that are rich in earthworks, such as the geoglyph-rich region of southwestern Amazonia (Schaan et al., Reference Schaan, Pärssinen, Saunaluoma, Ranzi, Bueno and Barbosa2012; McMichael et al., Reference McMichael, Palace, Bush, Braswell, Hagen, Neves, Silman, Tamanaha and Czarnecki2014a, Reference McMichael, Matthews-Bird, Farfan-Rios and Feeley2017).
Advancing our understanding of the past
Previous models of pre-Columbian people in Amazonia focused on using the Maxent algorithm. However, because ecological niche modeling outcomes can vary (Fig. 3c, f, and i) (Wisz et al., Reference Wisz, Hijmans, Li, Peterson, Graham and Guisan2008; Marmion et al., Reference Marmion, Parviainen, Luoto, Heikkinen and Thuiller2009), we modified our modeling approach and used an ensemble model composed of several modeling algorithms known to perform well in ecological studies and in modeling studies involving simulated species with known distributions (Araújo and New, Reference Araújo and New2007; Elith and Graham, Reference Elith and Graham2009; Marmion et al., Reference Marmion, Parviainen, Luoto, Heikkinen and Thuiller2009; Thuiller et al., Reference Thuiller, Lafourcade, Engler and Araújo2009). We used spatial filtering in the ensemble model to further reduce the effect of sampling bias (Boria et al., Reference Boria, Olson, Goodman and Anderson2014).
These changes in model configuration did not produce outputs significantly different from the original Maxent model that was run on the full array of dated and undated sites (Fig. 6d) (McMichael et al., Reference McMichael, Matthews-Bird, Farfan-Rios and Feeley2017). All modeling algorithms in the ensemble performed well except the GLM, which had the lowest AUC value of all modeling algorithms in each time bin and an AUC value <0.7 in the precultivation period (Table 2). The Maxent model was highly correlated with the outputs of the RF model and GAM, all of which performed better in each time bin compared with the other models (Table 2).
The models presented here were a first quantitative prediction that can significantly advance our understanding of human-environment interactions in Amazonian forests throughout the Holocene. We used only 14C-dated material in this study, and as a result, our sample sizes for each time bin in the spatial model are relatively low (Table 1). All analyses indicated that they are still robust given the currently available data (Fig. 6), and SDMs are known to perform well even with small sample sizes (Hernandez et al., Reference Hernandez, Graham, Master and Albert2006; Elith and Graham, Reference Elith and Graham2009; Merow et al., Reference Merow, Smith and Silander2013). New archaeological databases, such as the AmazonArch network (https://sites.google.com/view/amazonarch), which is compiling more and more data points, can be used to test and refine our model predictions.
We are participants in the LandUse6k (http://landuse.uchicago.edu/) project, which aims to generate detailed maps of human land use over the Holocene. Our next goals with these models are to provide detailed information on habitat type; plant domestication centers; agriculture, cultivation, or forest management strategies; duration of the occupation; and site size to provide a more nuanced reconstruction of spatiotemporal changes in past land use. Habitat type and flood regimes, which are different between the interior forests and the peripheral regions, are particularly likely to be useful predictors of pre-Columbian settlement patterns and land use types.
The integration of archaeological and paleoecological data sets is becoming increasingly common (Mayle and Iriarte, Reference Mayle and Iriarte2014). Incorporating our modeling approach with microfossil reconstructions from nearby soil and lake sediment records can further constrain spatiotemporal patterns of pre-Columbian land use and land use change on local and regional scales (e.g., McMichael et al., Reference McMichael, Bush, Piperno, Silman, Zimmerman and Anderson2012a, Reference McMichael, Piperno, Bush, Silman, Zimmerman, Raczka and Lobato2012b; Carson et al., Reference Carson, Whitney, Mayle, Iriarte, Prümers, Soto and Watling2014; Maezumi et al., Reference Maezumi, Whitney, Mayle, de Souza and Iriarte2018). Satellite imagery and biogeographic and ecological models can also be integrated with empirical field data to refine predictions about past pre-Columbian land use from local to basin-wide scales (McMichael et al., Reference McMichael, Palace, Bush, Braswell, Hagen, Neves, Silman, Tamanaha and Czarnecki2014a, Reference McMichael, Matthews-Bird, Farfan-Rios and Feeley2017; Söderström et al., Reference Söderström, Eriksson, Isendahl, Schaan, Stenborg, Rebellato and Piikki2016; Palace et al., Reference Palace, McMichael, Braswell, Hagen, Bush, Neves, Tamanaha, Herrick and Frolking2017; de Souza et al., Reference de Souza, Schaan, Robinson, Barbosa, Aragão, Marimon and Marimon2018).
Because Amazonian trees can live for hundreds of years (Hartshorn, Reference Hartshorn, Tomlinson and Zimmerman1978), disturbances, particularly from the late cultivation period, could leave a persistent legacy on Amazonian forest composition (Levis et al., Reference Levis, Costa, Bongers, Peña-Claros, Clement, Junqueira and Neves2017; McMichael et al., Reference McMichael, Matthews-Bird, Farfan-Rios and Feeley2017). These disturbances could have been in the form of deforestation, fire, or cultivation, each of which has differential effects on the postdisturbance recovery (Chazdon, Reference Chazdon2003; Chazdon et al., Reference Chazdon, Letcher, Van Breugel, Martínez-Ramos, Bongers and Finegan2007). Recovery processes following disturbances can take hundreds of years in tropical forests (Chazdon, Reference Chazdon2003). Thus, to appropriately understand modern ecological patterns and dynamics, knowledge of disturbance history across a range of spatial and temporal scales is crucial. Our approach and results provide an assessment of disturbance history in Greater Amazonia that can now be compared with observed ecological patterns and processes across local, regional, and landscape scales.
CONCLUSIONS
We have added dated archaeological and paleoecological material (N = 270) to existing databases of 14C dates from archaeological sites (N = 607) (Goldberg et al., Reference Goldberg, Mychajliw and Hadly2016) across Greater Amazonia. These data were able to fill in spatial gaps that were lacking in Amazonia sensu stricto (Fig. 1) and also fill in temporal gaps (i.e., the last 2000 yr of human history) that were not published in previous reports (Goldberg et al., Reference Goldberg, Mychajliw and Hadly2016). We also introduced a new methodology for assessing spatiotemporal patterns of people in tropical landscapes. We have applied Bayesian radiocarbon calibration methods (Parnell, Reference Parnell2016) and spatial models commonly used in ecological and conservation research (Araújo and New, Reference Araújo and New2007) to the database of 14C dates from archaeological and paleoecological surveys (Supplementary Appendix 1) to generate the first numerical and testable spatiotemporal predictions of the distributions of ancient people in Greater Amazonia. Our models can now be integrated with existing multiproxy data from archaeological, paleoecological, and ecological surveys (Arroyo-Kalin, Reference Arroyo-Kalin2012; Carson et al., Reference Carson, Whitney, Mayle, Iriarte, Prümers, Soto and Watling2014; Mayle and Iriarte, Reference Mayle and Iriarte2014; Watling et al., Reference Watling, Iriarte, Mayle, Schaan, Pessenda, Loader, Street-Perrott, Dickau, Damasceno and Ranzi2017; Maezumi et al., Reference Maezumi, Whitney, Mayle, de Souza and Iriarte2018) to further our understanding of human-environment interactions in Amazonian forests.
Our spatiotemporal analysis showed that during the precultivation period, human settlements were located primarily around the periphery of the basin and eastern portions of the main Amazon River and its tributaries (Figs. 3, 6). People spread into western Amazonia during the early cultivation period. During the late cultivation period, people spread farther into the western Amazonian lowlands, but primarily remained congregated around rivers (Figs. 3, 6). Environmental characteristics played an important role in structuring the demographic patterns of pre-Columbian people across Greater Amazonia, but their relative importance and directionality were not consistent across the precultivation, early cultivation, and late cultivation periods (Fig. 4). The response to the predictor variables varied between the peripheral regional and interior forests (Figs. 4, 7), highlighting the heterogeneity of Amazonia. We can now compare these model outputs (and future models) with patterns and processes observed in today's forests. Because tropical forests can live hundreds of years, understanding the human-environment interactions of pre-Columbian people is crucial for understanding modern patterns and dynamics observed in these forests.
SUPPLEMENTARY MATERIAL
The supplementary material for this article can be found at https://doi.org/10.1017/qua.2018.152.
ACKNOWLEDGMENTS
We would like to thank NSF DEB 0742301 and NASA Interdisciplinary Science Grant NNX14AD31G. This manuscript is part of the PAGES LandUse6k South America working group (http://landuse.uchicago.edu/about/).