I. INTRODUCTION
Semiconductor micro/nanometer structures have attracted great interest in many potential application fields due to their properties depending greatly on their size, morphology, and crystal structure.Reference Joshi, Lin, Aslam, Prasad, Schultz-Sikma, Edelman, Meade and Dravid1–Reference Algra, Hocevar, Verheijen, Zardo, Immink, van Enckevort, Abstreiter, Kouwenhoven, Vlieg and Bakkers4 When the particle size decreased to nanoscale, physical and chemical properties would change greatly compared with their large-scale counterparts.Reference Li and Shi5–Reference Zhang, Wang, Goebl and Yin7 Nanostructured metal chalcogenides (MCs) have attracted great interest in many application fields including solar cells, fuel cells, light-emitting diodes, solar cells sensors, supercapacitors, Li-ion batteries, semiconductor photocatalysts, and thermoelectric devices.Reference Li, Yu and Jaroniec8–Reference Yuan and Mitzi14 In particular, hollow structured metal chalcogenide materials have outstanding features of low density, distinguishable interior voids, reduced transport, and large surface area and would be applied to adsorption and separation, catalysis, energy storage, and drug delivery.Reference Chen, Ye, Zhou and Wu15
As an important p-type semiconductor material with wide gap (E g ≈ 3.7 eV), manganese sulfide (MnS) is mainly used as photochemical materials,Reference Mi, Chen, Zheng, Hou, Chen and Cui16 optoelectronic devices,Reference Ren, Gao, Sun, Liu and Xie17 and diluted magnetic semiconductors.Reference Puglisi, Mondini, Cenedese, Ferretti, Santo and Ponti18 Generally, MnS has three crystalline phases: the stable rock-salt structure of α-MnS, the metastable zincblende structure of β-MnS, and the wurtzite structure of γ-MnS. The metastable β-MnS and γ-MnS materials are nonexistent in bulk counterparts in nature. Recently, the advanced methods for nanomaterials synthesis create more opportunities to prepare metastable phase β- and γ-MnS with nanoscale particle size because the surface energy overwhelms the bulk energy.Reference Chen, heerhold, Johnson and Alivisatos19 Lei and coworkers synthesized metastable wurtzite-structure γ-MnS hollow spheres from anhydrous manganese chloride, sulfur powder, and potassium borohydride.Reference Lei, Tang, Yang and Zheng20 Mi reported dandelion-like MnS with manganese complex as a template under mild reaction conditions.Reference Mi, Chen, Zheng, Hou, Chen and Cui16 Yang et al. synthesized nanobipod MnS particles through controlling both temperature and pressure.Reference Yang, Wang, Wang, Sui, Zhang, Li, Ma, Liu, Zou and Zou21
Nowadays, the design and controlled synthesis of nanomaterials with novel morphologies and desired compositions have drawn immense attention due to their morphology- and composition-dependent physical properties. To obtain a desired morphology, attention should be paid to the various operating conditions such as reaction temperature, level of supersaturation, type of the solvent, and so on. However, as far as we know, there are little studies to investigate the influence of the solvent type and sulfur source on the morphology and phase structure of MnS NCs. In this work, we report a facile method to synthesize γ-MnS with different morphologies by modifying solvents and monodisperse α-MnS nanoparticles through changing sulfur source. We expect to shed some light on the formation mechanism of hollow spheres, micron flowers, nanotubes, and monodisperse MnS nanoparticles by varying the reaction parameters and introducing a series of comparisons in the resulting images. Furthermore, UV-vis of different morphologies was analyzed. It offers us an opportunity and a new insight into modulating the morphology of nanocrystals.
II. EXPERIMENTAL
A. Materials
Manganese acetate tetrahydrate (Mn(CH3COO)24·H2O) and ethylene glycol (EG) used in this work were of analytical grade and purchased from Sinopharm Chemical Reagent Company Ltd. (Shanghai, China). L-cysteine (NH2CHCH2SHCOOH) was of chemical grade and purchased from Shanghai Zhongtai Chemical Reagent Company Ltd. (Shanghai, China). Thioacetamide (CH3CSNH2) was of analytical grade and purchased from Tianjin Kay Chemical Company Ltd. (Tianjin, China). Diethylene glycol (HO(CH2)2(CH2)2OH) was of analytical grade and purchased from Jiangsu Sanmu Group Company Ltd. (Yixing City, China). Oleylamine (C18H37N) was of analytical grade and purchased from ACROS. Rhodamine B (MB) was purchased from Shanghai SSS Reagent Co., Ltd. (Shanghai, China). All chemicals used as starting materials without further purification.
B. Synthesis of hollow-structure MnS spheres
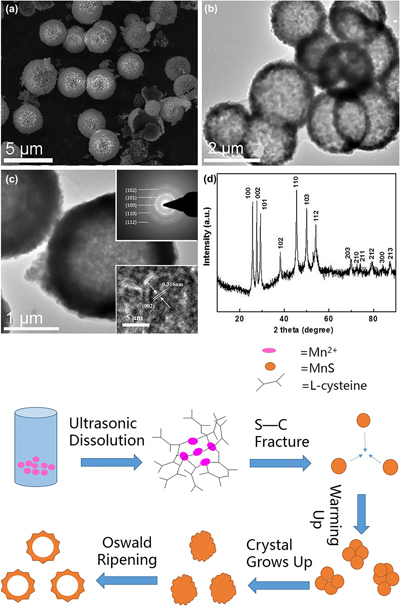
For the synthesis of MnS as shown in Fig. 1, 1 mmol of Mn(CH3COO)24·H2O (0.2451 g) and 1.5 mmol of L-cysteine (0.1818 g) were added to a Teflon-lined stainless steel autoclave with a capacity of 40 mL. Then 20 mL of EG was put into autoclave under magnetic agitation for 15 min. After that, the sealed autoclave was put into an oven and was maintained at 220 °C for 2 h. The autoclave was cooled to room temperature naturally after heat treatment. The resultant product was obtained and collected by centrifuging at 8000 rpm for 5 min, carefully washed with deionized water and absolute ethanol. This rinsing process was repeated twice before the precipitate was left to dry overnight at 60 °C for further characterization.
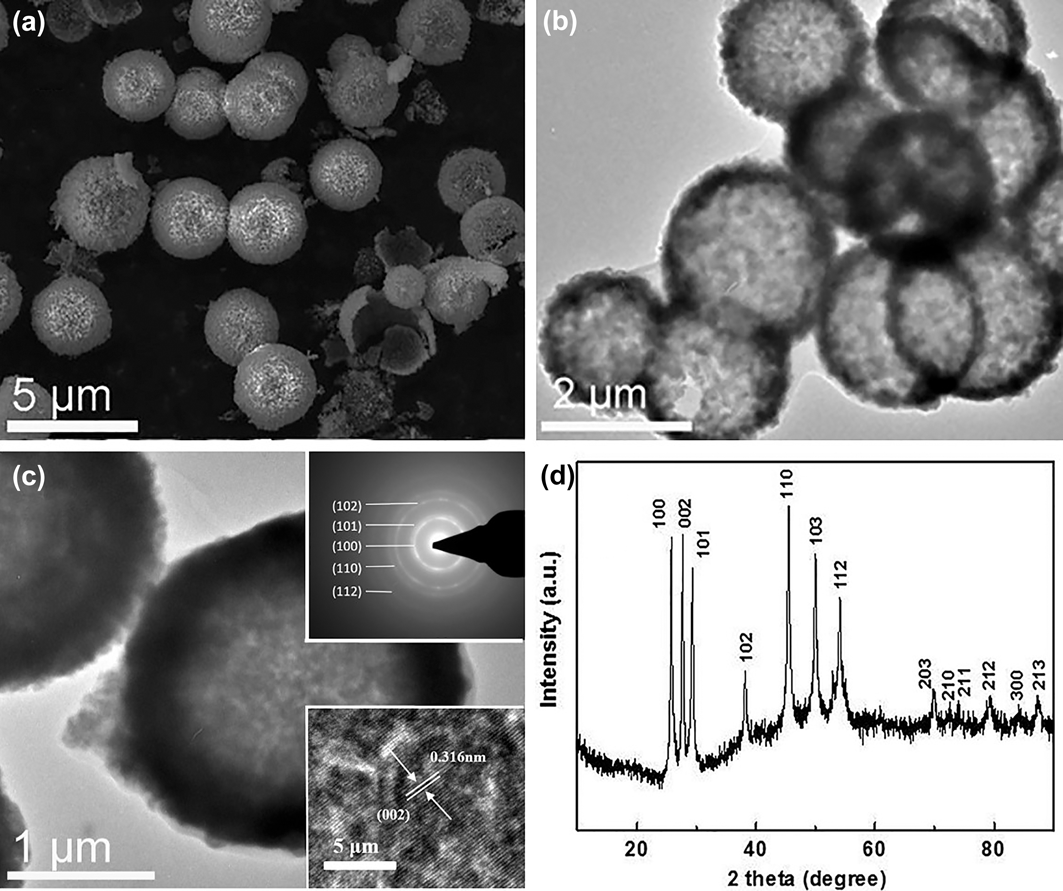
(a) SEM image, (b) low-magnification TEM image, (c) higher-magnification TEM image, and (d) XRD pattern of the as-prepared γ-MnS hollow structure with L-cysteine as the sulfide source and EG as the solvent. The insets of (c) are the SAED pattern and HRTEM micrograph, respectively.

C. Synthesis of monodisperse MnS NCs
In a typical synthesis of monodisperse MnS NCs, 1 mmol of Mn(CH3COO)24·H2O (0.2451 g) and 1.5 mmol of thioacetamide (0.1818 g) were mixed in oleylamine (20 mL) in a three-necked flask with a capacity of 50 mL under vigorous stirring at room temperature. Then the mixture was heated to 140 °C and removed heat source at that temperature. The mixture was cooled to room temperature naturally. After that, the solution was transferred to a Teflon-lined stainless steel autoclave with a capacity of 40 mL. After sealing, the autoclave was put into an oven and maintained at 220 °C for 2 h and then naturally cooled. The samples were isolated using hexane and excess methanol several times and finally dried in vacuum at 60 °C for further characterization.
The type and dosage of solvents surveyed for the preparation of different morphologies and crystalline phase MnS samples are listed in Table I.
Synthesis conditions of the reaction of Mn(CH3COO)24H2O with different sulfur sources and solvents at 220 °C for 2 h.

III. CHARACTERIZATION
The obtained samples were characterized on a D/max-2400 X-ray powder diffraction (XRD; Rigaku Corporation, Tokyo, Japan) with Cu Kα radiation (λ = 1.54178 Å). The size and morphology of products were measured with a Hitachi S-4800 field emission scanning electron microscope (FESEM; Hitachi Corp., Tokyo, Japan). Transmission electron microscopy (TEM) images and selected area electron diffraction (SAED) image were obtained with an FEI-Tecnai G2F30 (FEI, Hillsboro, Oregon) operated at an accelerating voltage of 200 kV. Absorption spectra were measured by using a PerkinElmer Lambda 950 (PerkinElmer, Waltham, Massachusetts). Photocatalytic properties of products were investigated using a multifunctional photochemical reactor (SGY-IB) and a UV-visible spectrophotometer (TU-1310).
IV. RESULTS AND DISCUSSION
A. Structure and morphology of hollow structure MnS
Figure 1(a) displays a typical SEM image of as-synthesized MnS hollow spheres obtained at 220 °C for 2 h using L-cysteine as the sulfur source and EG as the solvent. It can be seen that the products are spheres with an outer radius (R out) of ∼2.0 µm. It could be discovered that the sphere has vacant inner space from the shattered spheres. The low-magnification TEM image in Fig. 1(b) further confirms the inner hollow structure of the products and shows the inner and outer surfaces, which are actually interconnected through shared shells and has a relatively dense and smooth surface. The spheres have an inner radius (R in) of ∼1.8 µm. Figure 1(c) shows the higher-magnification TEM image of the as-prepared MnS spheres. A characteristic SAED pattern inserted in Fig. 1(c) illustrates its high crystallinity nature. Five diffraction rings shown in the inset of Fig. 1(c) can be indexed as γ-MnS. The high-resolution transmission electron microscopy (HRTEM) image in Fig. 1(c) clearly shows lattice fringes with a d-spacing of 0.316 nm. These features could be indexed to the (002) plane of the MnS crystal. Figure 1(d) shows a typical XRD pattern of as-prepared products. The position and relative intensity of all diffraction peaks can be indexed to a pure γ phase of MnS, which matches well with that of the standard PDF database (JCPDS card No. 40-1289) to the (100) (002) (101) (110) (103) and (112) planes. No other impurity phase was observed, indicating that the pure γ-MnS hollow spheres have been successfully synthesized under current experimental conditions of this study. The full width at half maximum (FWHM) of the (110) peak at 2θ = 22.78 was 0.472, and the average crystallite size of γ-MnS is about 22.782 nm, as calculated from the Debye–Scherrer formula. The sharp and narrow diffraction peaks of the synthesized proved a relatively good crystallinity. Comparing the sizes from the SEM image shown in Fig. 1 and XRD pattern shown in Fig. 2, we may conclude that all the samples are consisted of tiny crystallites.Reference Li, Han, Wang and Zheng22
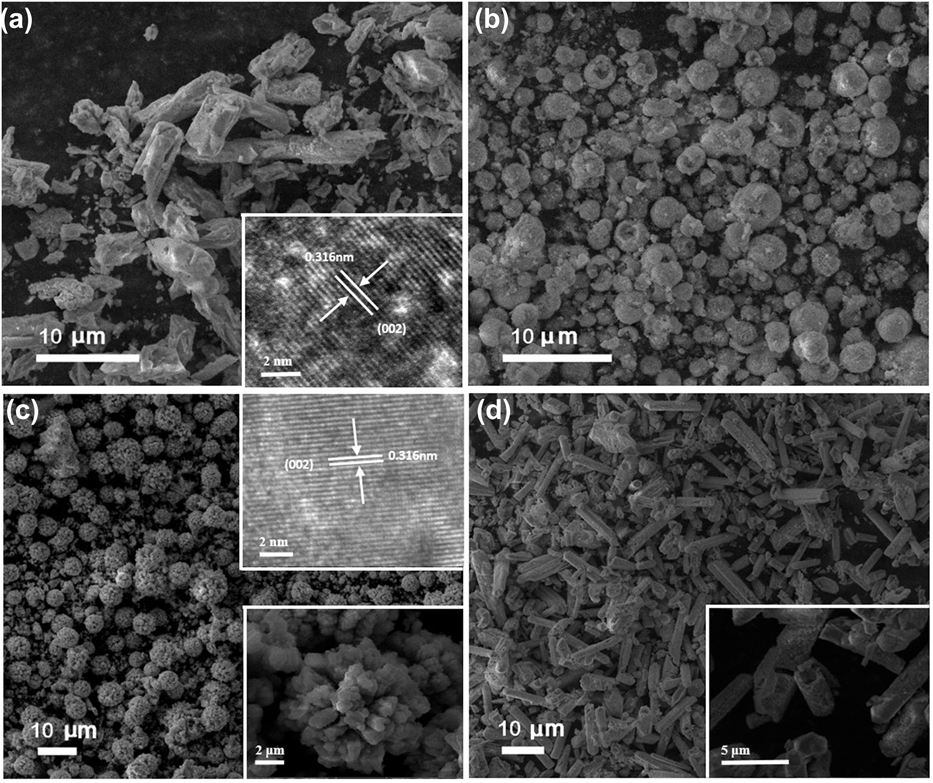
SEM images of the sample obtained by treating 1.5 mmol of L-cysteine and manganese source in different solvents at 220 °C for 2 h: (a) deionized water, (b) diethylene glycol, (c) EG and deionized water, and (d) diethylene glycol and deionized water. Insets of (a) and (c) are the corresponding HRTEM micrographs. Insets of (c) and (d) are the corresponding further magnified images.

B. Control of phase and morphology
The solvent is a dominant factor for the production of different morphologies of nanocrystals.Reference Zhang, Sun, Yin, Su, Liao and Yan23,Reference Ao, Gao, Wang, Wang, Hou and Qian24 When L-cysteine was used as the sulfur source, different morphologies can be obtained with different solvents under the other synthesis parameters unchanged. The synthesis conditions and the corresponding morphologies surveyed for the preparation of MnS samples are summarized in Table I. The impact of solvent on the morphology of MnS is shown in Figs. 2(a)–2(d). When the reaction takes place in deionized water, as can be seen in Fig. 2(a), it is liable to form taper-like rods with 14–25 μm. When the solvent changed from deionized water to diethylene glycol, we could obtain hollow structure spheres with the smaller surface clearance, as shown in Fig. 2(b). The mean diameter of these hollow spheres is 3–4 μm. Interestingly, reducing the volume of deionized water and increasing the proportion of EG with the total volume unchanged, the morphology had obvious change. It can be seen from Fig. 2(c) that the samples are built up of numerous flower-like hierarchical products with the size of about 4–5 μm. The inset shows a partly further magnified image, which demonstrates that the hierarchical flower-like products are consisted of interconnected hexagonal prismoid building blocks with the size of 400–600 nm. In addition, when 10 mL of deionized water and 10 mL of diethylene glycol are used as the solvent, hollow tubes are synthesized successfully, as shown in Fig. 2(d). It could be found that the length of almost all samples is about 5 μm and the wall thickness is about 400 nm. The inset shows the details of as-produced tubes. For the samples’ growth in the liquid chemical synthesis, the Ostwald ripening progress was put forward, which involves that “the growth of larger crystals from these smaller size which have a higher solubility than the larger ones”.Reference Yang and Zeng25 The Ostwald ripening progress is a very likely mechanism in the synthesis process of MnS tubes. As the reaction begins, with higher reactant concentration, more and more smaller crystals are produced. At certain concentration, bigger crystals will grow at the expense of the smaller ones. As time goes on, new produced smaller crystals are not enough for bigger ones. It will be as the result of deposit on the surface on bigger crystals, which can be seen from magnified SEM images. Therefore, the growth mechanism of inner-hollow MnS tubes follows the Ostwald ripening process.
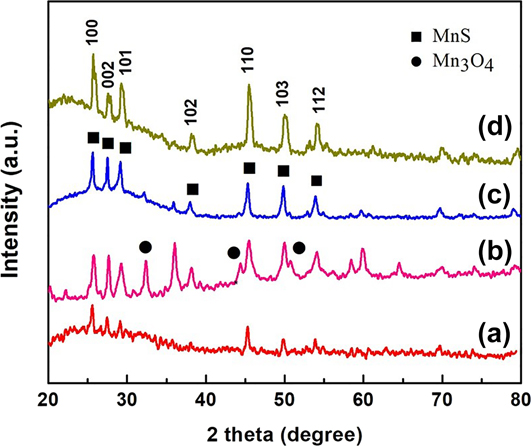
Figure 3 shows the XRD patterns of MnS synthesized with different solvents. When the reaction takes place in deionized water, all diffraction peaks of the XRD pattern shown in Fig. 3 line a can be indexed as pure γ-MnS. When the solvent changed from deionized water to diethylene glycol, the XRD pattern shown in Fig. 3 line b demonstrates that the samples are indexed as γ-MnS and Mn3O4. No pure MnS could be obtained in this case. The XRD pattern (Fig. 3 line c) shows that the sample is pure γ-MnS when the volume ratio of deionized water to EG was 1:1. In addition, when 10 mL of deionized water and 10 mL of diethylene glycol are used as the solvent, the phase of the as-produced samples is also pure γ-MnS demonstrated as Fig. 3 line d.
XRD patterns of samples synthesized with different solvents: (a) deionized water, (b) diethylene glycol, (c) EG and deionized water, and (d) diethylene glycol and deionized water.

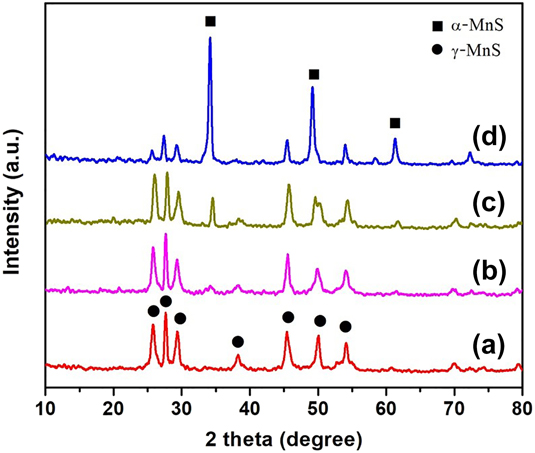
Oleylamine is often used as a capping ligand in the synthesis of monodisperse nanoparticles via the high-temperature thermal decomposition method.Reference Chen, heerhold, Johnson and Alivisatos19 In this work, oleylamine was adopted to decrease the size of samples. As the oleylamine molecule which contains two functional groups, –NH2 and C=C, is different from the EG solvent in some characteristics. Figure 4 shows the XRD patterns of the samples synthesized with the different volume ratios of the oleylamine to the EG solvent (the corresponding SEM images are shown in Supplementary Material S1). As expected, when the mixture solution of oleylamine and EG was used, with the proportion of oleylamine increasing, the stable rock-salt structure of α-MnS appeared in the products and the percentage of α-MnS increases. However, when oleylamine is present as the only solution, the temperature- and time-dependent experiments are carried for the synthesis of pure α-MnS. It is shown that improving the reaction temperature has no effect on synthesis of pure α-MnS and will affect particle size slightly, as shown in Supplementary Material S2. Keeping the reaction temperature and time unchanged, thioacetamide used as the sulfur source instead of L-cysteine reacting with oleylamine, α-MnS nanoparticles with the average size of about 50 nm could be obtained. Furthermore, particle size would decrease to 17 nm in average, when the approach mentioned in typical synthesis of MnS NCs was utilized.
XRD patterns of the sample synthesized with different volume ratios of the oleylamine to EG solvent: (a) 1:9, (b) 1:3, (c) 1:1, and (d) pure oleylamine.

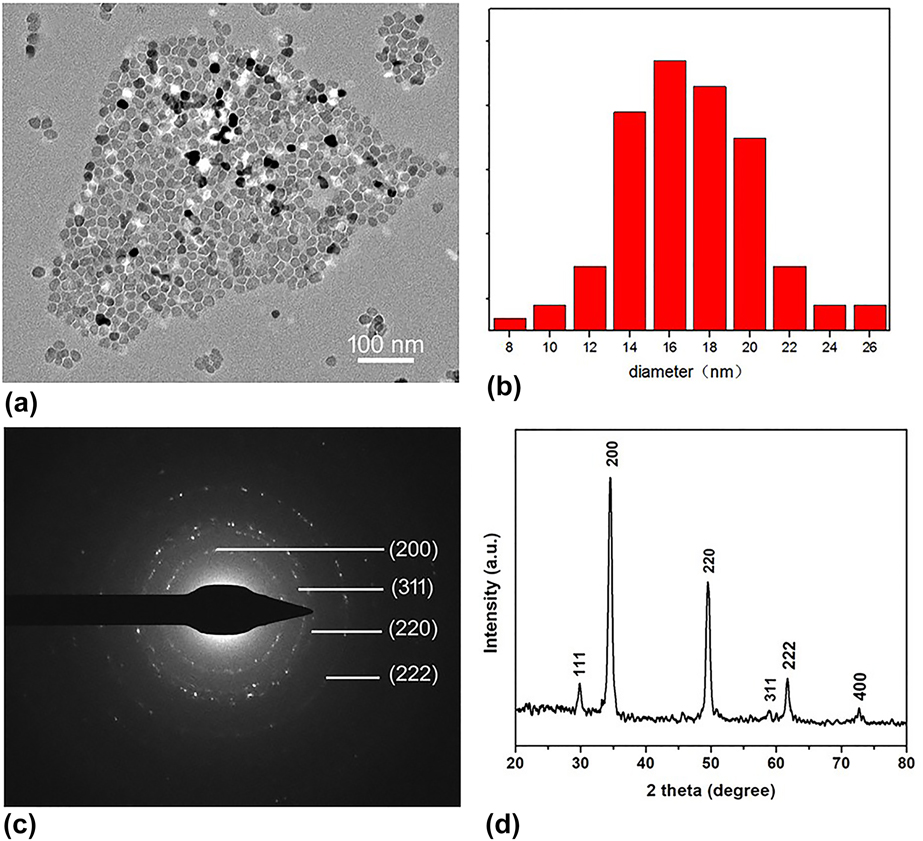
Furthermore, further studies suggest that sulfur source is a crucial factor for polymorphisms of MnS. When thioacetamide was adopted as the sulfur source and oleylamine present as the only solvent, α-MnS nanoparticles with the average size of 50 nm were obtained, as shown in Supplementary Material S3. To get smaller particle size, one spot solvent thermal approach is utilized to synthesize monodisperse MnS nanoparticles. The detail procedure was described in synthesis part and the results are demonstrated in Fig. 5. The TEM image of the products shown in Fig. 5(a) suggests that the samples display a narrow size distribution, which spontaneously forms 2D self-assembly. Figure 5(b) is the corresponding particle size distribution histogram, which illustrates the mean size of the nanoparticles is around 17 nm. The SAED pattern inserted in Fig. 5(c) shows its high crystallinity nature. Diffraction rings shown in the inset of Fig. 5(c) can be indexed as α-MnS. Figure 5(d) is the XRD pattern of this sample, in which all characteristic diffraction peaks can be readily indexed to a pure α-MnS (JCPDS, Powder Diffraction File No. 06-0518). No other impurity phase would be found.
(a) TEM image of MnS NCs, (b) the particle size distribution histogram, (c) SAED image, and (d) XRD pattern of the synthesized as the way of synthesis of MnS NCs.

C. Formation mechanism of γ-MnS with different morphology
Understanding the formation mechanism of different morphologies and phases is very important because it will help us to develop improved synthetic methods that can be generally applicable to various kinds of materials with different morphologies and phases. In this section, we analyze the growth mechanism of γ-MnS hollow spheres. When L-cysteine is used as the sulfur source and EG as the solvent, γ-MnS hollow spheres could be obtained (Fig. 1). The L-cysteine molecule as a type of biomolecules contains three functional groups, –SH, –COOH, and –NH2, respectively. In the process of reaction, metal ions prefer to coordinate with these groups and form metal–cysteine complexes, as reaction expression (1) listed. In some cases, the solvent resides in the crystal lattice by means of forming hydrogen bonds with the solute molecules, and the strong interaction between the solvent and the solute in the inner crystal lattice will change the macroscopical morphology of final products. In the solvothermal environment, the presence of amido –NH2 and –COOH functional groups in both cysteine ligands and residual cysteine is most likely to forming metal–cysteine complexes, a kind of inorganic–organic composite at molecular level, in the hydrogen-bonding interactions and the cross-linking of small crystallites of L-cysteine. This is the reason why excessive sulfur reactant amount used in the experiment. The hydrogen bond mediated self-assembly as mentioned above has been found in the process of making 3D metal sulfides semiconductor nanostructures by L-cysteine-assisted solvothermal way, as the reaction expression (2) listed.Reference Shi, Song and Zhang26
 $${\rm{M}}{{\rm{n}}^{2 + }} + \left( {{\rm{L ‐ cysteine}}} \right) \to {\rm{Mn}}{\left( {{\rm{L ‐ cysteine}}} \right)^{2 + }}\quad ,$$
 $${\rm{Mn}}{\left( {{\rm{L ‐ cysteine}}} \right)^{2 + }} + {{\rm{S}}^{2 - }} \to {\rm{MnS}}\quad {\rm{.}}$$
Based on the above results, a proper possible growth mechanism for γ-MnS hollow spheres was tentatively proposed (see Scheme 1) to illustrate the role of L-cysteine as a soft template affecting the formation of spheres in the solvothermal synthesis.Reference Jiang and Zhu27,Reference Chen, Shen, Xie, Zhu, Wu and Huang28 The formation of hollow microspheres could be divided into the following steps. In solution at room temperature, L-cysteine and Mn2+ form a Mn—L-cysteine complex under ultrasound treatment first. In this procedure, EG was used as the only solvent, which could reduce the ionization rate of Mn2+ from manganese acetate tetrahydrate. Simultaneously, due to internal molecular forces such as van der Waals forces, the Mn—L-cysteine complexes tend to self-organize into clusters to reduce the interfacial free energy. The elevated temperature process produces more C–S bond in L-cysteine molecular broken and more S2− anions released. As the reaction proceeds, S2− combines with Mn2+ to form MnS nanocrystals, which become denser over time and unstable due to their large surface energy. To minimize the surface free energy, more and more MnS nanocrystals form spherical shapes and nucleate on the surface of the complex as in conventional colloid formation processes. The spheres then aggregate coarsely to form solid microspheres. Regarding the formation of hollow spheres, it is recognized that the ripening process (crystallites grow at the expense of the smaller ones) must involve the mass transfer between the solid core and outside chemical solution through inter-crystallite interstitials of the nanospheres.Reference Zhang, Chen, Jia, Zhou, Su, Peng, Yin and Xin29 Scheme 1 demonstrates this evacuation-filling process in detail.
Schematic illustration of the possible growth mechanism for γ-MnS hollow spheres.

The solvent choice is important for the crystallization process. The experimental results have illustrated that the solvent plays a crucial role in the morphology of MnS crystals. Polarity of the solvent is one of the most important properties which may affect the growing and even the morphology of the crystal.Reference Ren, Gao, Sun, Liu and Xie17 In this section, the possible growth mechanism for other morphologies of γ-MnS, such as micron flowers, nanotubes, and monodisperse α-MnS nanoparticles was proposed by introducing a series of comparisons in the resulting images. When the volume ratio of EG to water was increased to 1:1, the morphology of samples changes to micron flowerlike shape. When the deionized water is used as the only solvent, the morphology of the sample becomes taper-like rods. From the XRD patterns shown in Fig. 3 line a and c, we can obtain that the intensity of some diffraction peaks, especially the (100) peak, is enhanced significantly. This phenomenon might be attributed to the fact that deionized water is beneficial to the preferential orientation growth of the MnS crystal.Reference Ren, Gao, Sun, Liu and Xie17 The HRTEM images of Figs. 2(a) and 2(c) show the lattice fringe along the preferential growth direction. The lattice spacing of 0.316 nm agrees well with the d-spacing of the (002) plane of γ-MnS, indicating the [001] preferential growth orientation. From Fig. 2(c), we can defined that the top of the nanorod is hexagonal, which inherits the crystal habits of MnS in wurtzite structure. When deionized water as the only solvent, the intensity of the (100) diffraction peak is stronger than the (002) diffraction peak. The SEM image in Fig. 2(a) also revealed its rod growth nature. The above two phenomena can prove that the preferential oriented growth of γ-MnS crystallites was occurred. Herein, deionized water has two aspects of the role in the synthesis process of anisotropic MnS. First, deionized water as a inducer greatly promotes the ionization of Mn(Ac)2 and L-cysteine. More Mn2+ and S2− ions produce, more MnS crystal nuclei form. Therefore, high concentrations of growing crystal nucleus (or sufficient supersaturation) further promote rapid growth rates. Second, the polarity of H2O molecules are stronger than EG molecules, so the surface of the MnS crystal would not be passivated when deionized water existed.Reference Ren, Gao, Sun, Liu and Xie17,Reference Huang, Zhang and Banfield30 In a word, deionized water could be used as an adhesive to allow the newly formed nanocrystals to grow into larger crystals (directed adhesion).
From the above, we can conclude that the polarity of the solution has a great influence on the morphology of the as-prepared γ-MnS samples. Dielectric constant is a key measure of solvent polarity. High dielectric constant can reduce the attraction between the ions in the solvent so that solute is easier to dissolve in highter polarity solution and the reaction rate becomes faster.Reference Zhang, Sun, Yin, Su, Liao and Yan23 Diethylene glycol contains two hydroxyl groups and one ether group, the molecular polarity of which is stronger than EG. When diethylene glycol used as the only solvent, particle size of the obtained hollow spheres is bigger and more uneven than the samples obtained from EG. It is a pity that the phase is not pure. When the volume ratio of the diethylene glycol to deionized water reaches to 1:1, the morphology of the sample changes to well-defined hexagonal prismoid. Compared to the sample obtained from the solvent that contains EG and deionized water (volume ratio of 1:1), the size of the synthesized increased obviously. The morphology of the synthesized is no longer micron flower, the tops of the synthesized are hexagonal and the edge of the prism is more obvious. It demonstrates that diethylene glycol mixed with deionized water is more easily to form anisotropic crystals.
D. Optical property
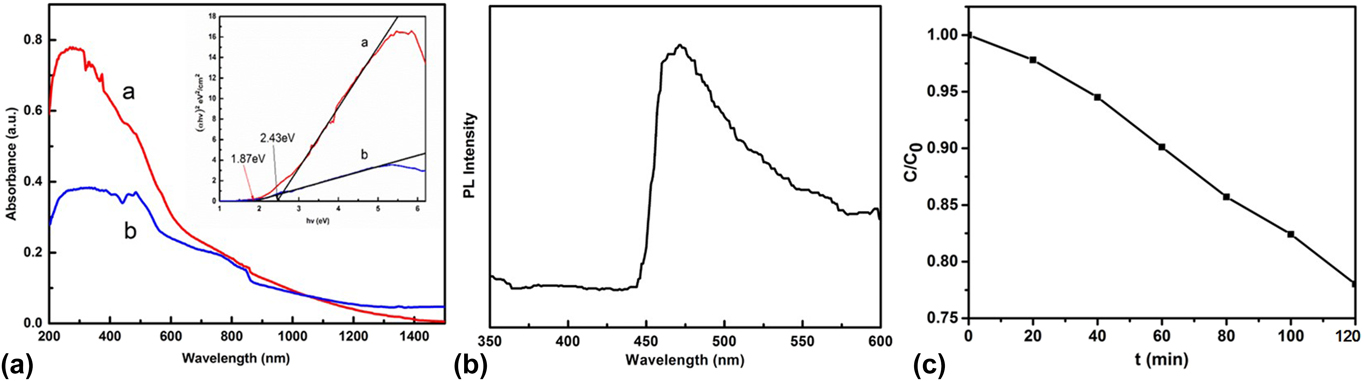
UV-vis absorption spectra of the MnS crystals obtained from different solvents were measured at room temperature [Fig. 6(a)]. Curve a in Fig. 6(a) shows UV-vis absorption spectra of the products obtained from pure EG solution. Discernible peak at 332 nm was detected in the MnS hollow spheres. In addition, an absorption band appeared at 464 nm in Fig. 6(a) curve a may be attributed to the electron transition between the sulfur anion and manganese cations.Reference Shi, Xue, Li, Zhao and Qu31 When MnS nanotubes synthesized in 10 mL of diethylene glycol and 10 mL of deionized water, the absorption edge of the sample is around 488 nm shown in Fig. 6(a) curve b. In contrast to the previous value of 325 nm,Reference Zheng, Cheng, Wang, Zhou, Bao and Jia32 there is a red shift, which could be attributed to the quantum size effect of MnS nanocrystallites. The inset of Fig. 6(a) shows the curve of (αhν)2 versus hν. The E g value of the product can be estimated by extrapolating the straight line portion of the plot of (αhν)2 versus hν. Literature studies reported that the estimated E g values of hollow spheres and nanotubes are 2.43 eV and 1.87 eV, respectively.Reference Shi, Xue, Li, Zhao and Qu31 Successful synthesis of MnS hollow structures allows us to investigate their optical properties. The PL spectrum of MnS hollow spheres was measured at room temperature [Fig. 6(b)]. It can be seen from the spectrogram that the main luminescence peak of this material is the blue luminescence peak located at 472 nm similar to the trap state emissions of γ-MnS at 470 nm.Reference Mu, Gu, Wang, Zhang, Sun and Kang33 The photoluminescence emission mechanism of MnS is not fully understood, and the emission peaks may be attributed to the recombination of charge carriers in deep traps of surface localized states and a photogenerated hole caused by surface defects.Reference Liu, Shan, Chen, Li and Li34
(a) UV-vis absorbance spectra of the as-synthesized γ-MnS with different solutions: a EG, and b diethylene glycol and deionized water; (b) Photoluminescence spectrum of γ-MnS with EG as solution; (c) The time-dependent ratios of C/C 0 in the presence of γ-MnS with EG as solution and photocatalytic degradation of MB. The inset is the corresponding plot of (αhν)2 versus hν of the samples.

MB was used as a model pollutant to investigate the photocatalytic activity of γ-MnS with EG as solution under ultraviolet irradiation. In the typical test, a 500 W mercury lamp was used as the irradiation source and 20 mg γ-MnS was dispersed into 100 mL of MB aqueous solution (10 mg/L). Before the typical test, MB solution with 20 mg samples was stirred for 30 min. A certain volume of the suspension was withdrawn at every 20 min for analysis, after recovering the powders by centrifugation. The degree of degradation was calculated as C/C 0, where C is the concentration of the remaining MB solution and C 0 is the original concentration of MB. Under ultraviolet irradiation as a function of the irradiation time, the degradation ratio of MB by γ-MnS with EG as solution is shown in Fig. 6(c). With the irradiation time increases continuously, the degradation ratio can reach 22% after 2 h irradiation.
V. CONCLUSION
In summary, MnS crystals with different phases and morphologies were synthesized successfully by the solvothermal approach through varying the solvent and sulfur source. Hollow spheres, micron flower, and hollow tube of γ-MnS were obtained by gradually changing solvent with manganese acetate tetrahydrateas as manganese source and L-cysteine as the sulfur source. When oleylamine used as the solvent and thioacetamide as the sulfur source, monodisperse α-MnS nanoparticles with 17 nm in average size could be obtained. The optical property of MnS prepared as described above was explored. Other physical properties and applications of MnS with different phases and morphologies are still needed to fully exploit.
ACKNOWLEDGMENTS
This work was supported by National Natural Science Foundation of China (Nos. 51204085 and 51502123), the Specialized Research Fund for the Doctoral Program of Higher Education (No. 20120211120007), and Fundamental Research Funds for the Central Universities of China (No. lzujbky-2016-125).