I. INTRODUCTION
In modern communication standards, an increase in amplitude modulation is necessary to achieve the high data-rate requirements. Increasing the envelope variation also improves the bandwidth efficiency of the communication system. The amplification of these variations in the signal amplitude demand a highly linear RF power amplifier [Reference Reynaert and Steyaert1, Reference Wang2]. One of the most important challenges for the RF PA designer is to design a power amplifier that provides this required linearity without sacrificing efficiency. In addition, the RF PA in a mobile phone handset should be designed to deliver significant output power to the load with high efficiency to conserve the battery power. However, in general, the linear power amplifier only achieves high efficiency when operating near its peak or saturated output power level and simultaneously it has the disadvantage of their inherent low efficiency at power back off. As a consequence, this will result in a reduction of battery lifetime for the portable wireless high-end user devices, because in all modern communication systems and especially when employing multicarrier modulation (e.g. orthogonal frequency division multiplexing, OFDM), the statistics of the envelope of the signals prove out that the envelope of the signal is such that it rarely reaches the peak amplitude [Reference Raab3]. Moreover, this also implies strict linearity specifications for all the RF stages preceding the RF amplifier to avoid any degradation of the output spectrum. These strong requirements would entail an increased power dissipation of the entire transmitter as such. The overall effect is therefore a mean efficiency which is much lower than the efficiency at peak envelope power (PEP) level.
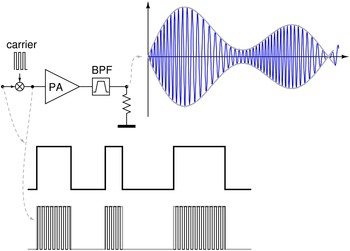
Switching amplifiers achieve high efficiency because they exploit the switching capability of a transistor in combination with a simple output network. Thus, the switching amplifier consumes less power and since the driver stages do not need to behave linearly, the efficiency curve of the device can be much more favorable compared to linear PAs. Considering the fact that switching amplifiers always perform at peak efficiency because they always operate at full signal swing, one should encode the amplitude information into the time domain such that the amplitude of the input signal is always maximal. In literature, there are two main trends in encoding the envelope of the signal into time domain: burst mode modulation [Reference Raab4, Reference François, Reynaert, Wiesbauer and Singerl5] and RF pulse width modulation (PWM) [Reference Raab4, Reference Nielsen and Larsen6–Reference Wagh, Midya and Rakers9]. The latter is translating the varying amplitude information into a varying pulse width. On the contrary, in burst mode operation, the width of the burst is the representation of the instantaneous envelope of the desired output. This PWM signal is a pulse train where the width of the signal burst or the total amount of pulses are varied according to the envelope. The applied burst is now a baseband PWM modulation which is multiplied with the phase-modulated square-wave carrier. Figure 1 illustrates the burst mode operation.
Burst mode operation.

In this case, the efficiency of the signal generation is always equal to the peak efficiency. Thus, this burst mode amplification improves the average efficiency for standards with high peak to average power ratio. In order to reconstruct the amplitude information from the modulated RF signal, a narrowband filter is needed at the output [Reference François, Reynaert, Wiesbauer and Singerl5]. This burst mode modulation technique is also known as carrier PWM [Reference Raab4]. Not only efficiency is improving, but also linearity improves because the carrier amplitude is only a function of the amount of bursts considered in time domain, which can be accurately realized by the digital modulator in the transmitter front-end.
This paper targets the Class E concept PA in combination with burst mode operation. In contrast to RF PWM which requires a Class D or Class S power amplifier, carrier PWM practically is viable with every class of switching PAs.
In this paper, the efficiency of burst mode RF power amplifiers is analyzed and the influence of the wideband load and the narrow band-pass filter on the efficiency and the linearity of the RF PA is further investigated. Therefore, the main objective of this paper is to enhance the power efficiency and simultaneously maintaining good linearity.
This paper is organized as follows: Section II will give an overview on the possibilities and the design considerations of the burst mode RF PA. Focusing specifically on the Class E mode in this paper, a revision and comparison of the different types of switching power amplifiers is a good starting point for the analysis of the burst mode operation amplifier and is given in Section II B). In Section III, the burst mode RF PA is presented to achieve a more beneficial efficiency characteristic compared to the Class B PA. In contrast to previous published work [Reference Raab10, Reference Raab11], this section analyses completely the efficiency behavior of a burst mode PA (carrier PWM) and explains how the amplitude information is reconstructed in carrier PWM. In addition, in Section VI, a transmission line is introduced between the filter and the RF PA in order to increase the efficiency. All this is implemented on a PCB and the measurement results are discussed in Section V. Finally, a conclusion is given in Section IV.
II. DESIGN CONSIDERATIONS
This section explains and motivates the different design choices a designer has to make during the design of a burst switching power amplifier. In Section II. A the different well-known amplitude modulation types are discussed. In Section II. B, the principle of the switching amplifier is studied and a small summary for the most common switching power amplifiers is given. Especially the Class E power amplifier draws the attention.
A) Burst mode versus RF PWM
This section discusses the difference between the most famous amplitude modulation techniques: burst mode modulation and RF PWM.
As shown in Fig. 1, in burst mode modulation, the width of the burst is a representation of the instantaneous envelope of the desired output. The width of the pulses is either determined using Δ − Σ-modulation or PWM. The latter is also called carrier PWM [Reference Raab4]. The modulated signal is then recovered by a band-pass filter, as will be shown in Section III, which filters out the frequency components related with the PWM switching frequency.
RF PWM was introduced in 1973 by Raab [Reference Raab10] and is a technique for directly modulating the carrier waveform, mostly produced by a Class D PA. An amplitude modulated signal is represented by variation of the pulse width or the duty ratio of the pulse. Although, this is a interesting implementation, the technique has some drawbacks: first of all, RF PWM requires predistortion because the inherent relation between the pulse width and the envelope is not linear [Reference Raab11]. Second, the higher the operating frequency, the more difficult it becomes to implement the small variation in pulse width. Third, varying the pulse width introduces an extra requirement for the switching PA and limits the choices for the power amplifier design. Finally, it is hard to vary the duty cycle over the full range.
Carrier PWM has multiple advantages over the above techniques. First of all, supposing the bandwidth of the envelope signal is much smaller than the carrier frequency, which is the case for many applications, then the carrier PWM relatively produces long bursts. Second, the pulses at carrier frequency have a fixed width allowing every type of switching amplifier to operate at its peak efficiency. Finally, the implementation of the Carrier PWM is simple and rigid. However, the disadvantage is that the steep narrowband filter at the output is required to remove the switching frequency sidebands and in practice, this filter tends to have a loss around 1 dB [Reference Raab4].
Notwithstanding the requirements of the filter, the advantages of the burst mode modulation are very convincing and for the rest of the paper, the focus will mainly be on the burst mode operation.
B) Switching RF PA
Since a switched-mode PA achieves an ideal efficiency of 100%, this type is selected for the use of the burst mode RF PA. The central element of a switching RF PA is a switch, as the name suggests. This switch can be turned “ON” or “OFF”. The most famoustypes of the switching amplifiers are the Class E, the Class D, and the Class F.
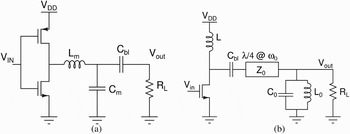
The Class D amplifier has the simplest configuration, as illustrated in Fig. 2a. The output of this Class D push–pull amplifier consisting of a p-type Metal Oxide Semiconductor (pMOS) and n-type Metal Oxide Semiconductor (nMOS) in stacked configuration, is terminated with a series resonant filter, and as a consequence, the output is sinusoidal and no harmonic power is dissipated. The major disadvantage of this type of amplifier is the power dissipation during the charging and discharging of the parasitic capacitances at the common drain node in every cycle and this loss is related proportional with the frequency. Furthermore, due to the finite turn-on and turn-off times of the transistor, the short-circuit currents consume significant power if proper care is not taken and result in an efficiency degradation [Reference Hung, Rode, Larson and Asbeck12].
The ideal reconstruction of amplitude signal for burst-mode operation: (a) the Class D switching and (b) the Class F switching amplifier.

The drain of the switching transistor in a Class F amplifier sees a load network which is resonant at certain harmonic frequencies to create a high impedance for the odd but a low impedance for the even harmonics [Reference Raab13], as depicted in Fig. 2b. At the drain, a square waveform is created during the “OFF”-period and during the on time, the current is a squared rectified current. Consequently, in the Class F amplifier, no overlap between the voltage and current waveforms exist inorder that no power is dissipated in the transistor. In practical implementation, only a small amount of harmonic frequencies are terminated, resulting in a degraded peak power and peak efficiency [13].
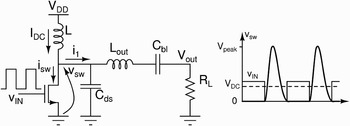
Figure 3 illustrates the Class E amplifier in a single-ended switching configuration with a passive load network. The simplest form of the load network consists of a tuned series L–C network, L and C ds. In contrast to the Class D amplifier, this capacitance C ds of this L–C tank typically consists of the junction capacitance of the transistor and an additional capacitance to ensure the operating frequency is correct. In other words, the main advantage of the Class E is that the inherent junction capacitance is absorbed into the switch parallel capacitance C ds. Compared to the Class F, this compact passive output network in Class E is much smaller and simpler and more practical, realizable, and comparable to the complexity of the Class D amplifier.
The Class E switching amplifier topology.

The peak efficiency of the Class E amplifier is 100%. The Class E amplifier is mainly designed in the time domain [Reference Sokal14, Reference Sokal and Sokal15]. Considering Fig. 3, the switch conducts only half of the period with operating frequency f 0. For the next reasoning, the transistor is assumed to operate as an ideal switch: a perfect short-circuit during “ON”-state and open circuit during “OFF”-state. The L–C-resonator, consisting of L out and C bl, is used to block the DC-component and the harmonic frequencies. As a consequence, the current i 1 is sinusoidal with frequency f 0. So the current into the capacitor C ds is assumed to be the combination of a sine wave with a DC offset. During each phase, the current is either defined by the transistor or by the capacitor.
It is important to remind that the voltage at the drain is now forced to zero, every time the switch is closed. This fixes the capacitor's charge and forces the current via the transistor. By properly adjusting the amplitude and the phase of the current and voltage waveforms, it is possible to turn the capacitor current to zero at turn on or in other words, it is possible to close the switch when the charge on the capacitor is approaching zero. This is called the zero voltage switching of the Class E PA. The resulting voltage waveforms at the drain node of the Class E transistor are depicted in Fig. 3. A more detailed study of the Class E PA can be found in [Reference Sokal and Sokal15, Reference Raab16].
This brief summary of the design methodology of the Class E RF PA showed its natural switching ability. It has been shown that the Class E topology had two key advantages over the other switching topologies. This proves that the Class E switching PA is very suitable for the burst-mode operation. This will be discussed in more detail in the next section.
III. IDEAL OPERATION OF THE BURST MODE PA
A burst-mode RF PA is either “ON” or “OFF”. When it is “ON”, it amplifies a constant envelope signal. The amplitude information is encoded in the “ON”-time. From previous paragraph, one can understand that the Class E RF power amplifier is very suitable for burst mode operation. During the “ON”-state of the burst period, the Class E operates very efficiently. Likewise, the efficiency of the amplifier is high during the “OFF”-state because no DC-power is consumed.
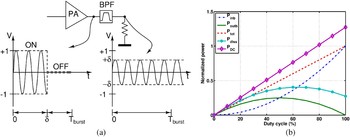
Figure 4a illustrates the ideal operation of the burst-mode RF PA. A burst-mode power amplifier has two modes of operation: during the “ON”-period of the applied burst signal, the amplifier is amplifying the signal and on the contrary, the power amplifier is not generating any output power during the “OFF”-period of the applied input burst. As shown in Fig. 4a, the duty cycle, δ, is the ratio between the “ON”-period of the burst signal by the total burst period, T burst. In this ideal operation, it is assumed that the power amplifier is ideal and that the output signal of the power amplifier is perfectly sinusoidal during its “ON”-period. At the input of the PA, during the “ON”-period, a signal with constant amplitude is applied to ensure the power amplifier continuously operates in saturation and consequently generates the output signal with peak efficiency. As illustrated in Fig. 4a, the output voltage of the amplifier is maximal during the “ON”-period of the burst period and is represented as a normalized amplitude of “1”, and is zero during the “OFF”-period. The amplitude information of the RF signal is now reconstructed by placing a narrow band-pass filter at the output of the amplifier. Considering an ideal filter, the signal at the output of the filter is a perfect sine wave at the carrier frequency, whose normalized amplitude is equal to the duty cycle, δ, of the burst period, T burst. All this means that the amplitude at the output of the burst mode power amplifier with filter is linearly related with the duty cycle of the applied input burst or in other words, the amplitude information is translated into time domainand is represented by the duty cycle.
The ideal reconstruction of amplitude signal for burst-mode operation: (a) the RF PA supplied with a pulse-width modulated, RF signal and (b) the signal power.

The RF bursts at the output of the burst mode PA contain both in-band and out-of-band spectral components. As just demonstrated, since the duty cycle is the representation of the amplitude of the RF signal, it can be shown that the total signal power is linearly related to the overall duty cycle. Figure 4a illustrates the relationship between the duty cycle, δ, and the in-band power, P inb, and the total signal power, P tot, respectively. The out-of-band power can then be calculated by subtracting the in-band power from the total signal power. In the following equations (1–3), the basic relationshipsFootnote 1 between the total signal power, the in-band power and the out-of-band power are depicted:



Figure 4b illustrates in more detail how the in-band, the out-of-band power, and the total power depend on the duty cycle. Furthermore, the DC power consumption, P DC, and the total dissipated power, P diss, for the burst mode RF PA with the peak efficiency equal to the peak efficiency of a conventional Class B (ηpeak_ClassB = π/4), are also illustrated.
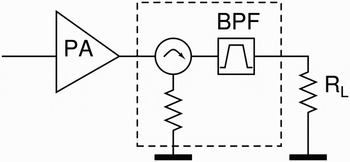
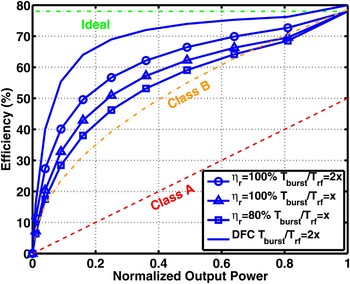
In recent research [Reference Jeon, Yang and Nam17], it is widely used to place a circulator in between the RF PA and the narrow band-pass filter. This concept is illustrated in Fig. 5. The circulator introduces a wideband 50 Ω termination and this results in an efficiency drop since the out-of-band signal power is now dissipated in the wideband load. This results in an efficiency behavior comparable to the Class B efficiency and is denoted in Fig. 6. In practice, the power recycling efficiency of the circulator, ηr, is never 100% and then the out-of-band signals are only recycled to some extent which further degrades the performance. But even if an ideal circulator is used, the efficiency curve remains not flat at power back-off, as is for the ideal burst mode RF PA.
The circulator.

The efficiency of a burst mode RF PA.

As explained before, the RF bursts at the output of the burst mode RF PA contain both in-band and out-of band signal power. As a starting point for this efficiency analysis, it is assumed that the transistors are ideal switches. By reconsidering equations (1 – 3), one can now evaluate the efficiency of this burst mode RF PA as

where P out represents the total output power of the RF PA after the ideal filter. Consequently, this output power is completely determined by the in-band spectral components. Of course, the efficiency only remains constantly 100% for every duty cycle if no out-of-band power is dissipated at all, as shown in Fig. 6.
By introducing a circulator at the output of the power amplifier [Reference Jeon, Yang and Nam17], the out-of-band power is partly recycled and equation (3) is now transformed into

where ηr represents the recycling efficiency of the circulator. When the circulator is able to recycle the whole out-of-band power with no extra loss, ηr becomes 1 and equation (5) is reduced to zero. If no power is reused, ηr = 0, equation (5) is retransformed into (3).
By substituting equation (5) into equation (4), the efficiency of the ideal burst mode PA with circulator at the output is now expressed as

The efficiency calculation of a burst-mode RF PA, ηBM_PA, also comprises several other aspects. First of all, the ideal switches are replaced by actual transistors and the switching loss of the transistors is now taken into account. This is the power loss in the transistors during continuous wave amplification and is represented in equation (10) as P diss_CW. In other words, the transistors operate at a certain peak efficieny, ηPEP, and generate both in-band and out-of-band signals at this peak efficiency. Taking into account this switching loss of the transistors, the drain efficiency can be calculated as
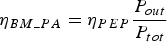


Combining equation (9) with equation (6), the efficiency expression is turned into

Notice that equation (9) appears in a slightly changed formation in equation (10) because the total power consisting of the in-band and out-of-band signals are already present in the first to terms of the denominator. Consequently, the total power should not be taken into account more than once in the efficiency calculation and this results in equation (6).
Finally, in practice, a burst mode RF PA normally shows a slight performance degradation in the lower duty cycles. During the generation of the burst and during the ending of the burst, some signal power is consumed, P diss_startup. This charge–discharge power loss, P s, is fixed for every duty cycle and becomes nil at 100% duty cycle because subsequently no power is lost any more at the start and at the end of the burst, and consequently, the startup efficiency  is defined in equation (13). As a conclusion, the efficiency of the burst-mode RF PA is given in equation (11):



with ηr representing the efficiency of the power recycling topology and ηPEP representing the efficiency of the RF PA at Peak Envelope Power, PEP, and P s meaning the power that is dissipated at the start and at the end of the burst.
The efficiency curves for several specific values for P s/ PEP and ηr will now be considered in more detail and are illustrated in Fig. 6. Figure 4 shows the efficiency behavior of the burst mode power amplifier with ideal power recycling. Assume the circulator has a power recycling efficiency of 80%, then the efficiency curve is reduced significantly at lower duty cycles, as denoted in Fig. 6.
Several useful and more general observations can be made on these expressions for the efficiency of the burst-mode PA:
First of all, it is important to notice that the efficiency of a burst mode PA is having a more favorable efficiency behavior than the conventional Class B PA, as illustrated in Fig. 6.
Second, to further boost the efficiency at lower duty cycles, the direct filter connection (DFC) is used to assure that the out-of-band spectral components see a high out-of-band impedance. In this case, the transistor is now only generating the in-band spectral components during a burst with the PEP efficiency ηPEP and therefore, equation (12) is transformed into equation (14):

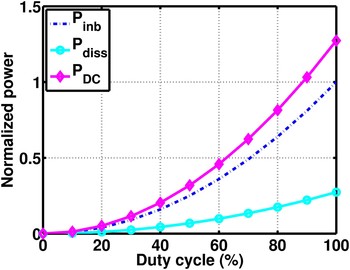
Note that the output power and the dissipation of the power amplifier are both proportional to δReference Wang2. The results of this equation are captured in Fig. 6. One can now clearly understand that the efficiency is enhanced significantly at power back-off by adding the DFC. A remarkable conclusion emerges for burst mode PA with DFC and is depicted in Fig. 7: since the burst mode PA is not generating any spectral components due to the high impedance seen out-of-band at the drain node of the transistor, and therefore only generating the in-band signals at peak efficiency, the total dissipated power and the total DC power are reduced which results in the optimal efficiency behavior. Figure 7 shows that the mode RF PA still generates the in-band signal power proportional to δReference Wang2 at peak efficiency, ηPEP. Compared to the signal power of the spectral components shown in Fig. 4b, the out-of-band power is now reduced to nil. Thus, the total DC power consumption, P DC, is no longer linear proportional to the duty cycle but becomes quadratically dependent on the duty cycle, concerning the efficiency of the burst mode RF PA equal to the peak efficiency of a conventional Class B, ηPEP = ηpeak_ClassB = π/4, and not taking into account any loss at the start or at the end of the burst generation.
The signal power with DFC.

Finally, the efficiency is also influenced by the amount of burst signals that fit in the duty cycle in one entire burst period, T burst. In other words, by considering equation (14), the efficiency is improved when the ratio between the overall burst period, T burst, and the period of one RF pulse, T rf, is increased, which is illustrated in Fig. 6 where x represents a ratio between T burst and T rf. This is reflected into a lower dissipation during startup and ending of the bursts, P s, which is represented in the burst mode RF PA efficiency equation (13).
VI. LINEARITY CONSIDERATIONS
The above analysis opened up some interesting new possibilities for high efficiency burst mode RF power amplifiers: the burst mode PA gives efficiency enhancement at power back-off. In addition to this improvement, a good linearity is maintained in burst mode operation because of the linear relationship between the amount of pulses during the “ON”-state of the amplifier and the amplitude of the output signal. It has also been proven that to approximate the ideal efficiency-curve behavior of the burst mode PA, the out-of-band impedance of the filter seen at the drain-side of the PA should be as high as possible. To achieve this, a transmission line of a certain length is added between the filter and the PA in order to increase the out-of-band impedance. By changing the transmission line length, or in other words by rotating the filter's impedance characteristic on the Smith chart, the out-of-band impedance seen by the PA could be maximized.
It is however necessary to shift the focus to the time domain to consider the linearity behavior of the burst mode PA. By adding a transmission line between the filter and the output of the RF PA, the RF PA initially still sees a wideband load till the reflections occur. During burst generation, the burst mode PA introduces instantaneously out-of-band power travelling on the transmission line and at the filter side, this power reflects back to the output of the PA which will have substantial impact on the efficiency and the linearity behavior of the power amplifier. Indeed, these reflections deteriorate the normal operation of the PA and an efficiency drop is the logical outcome.
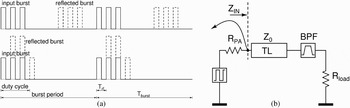
Two different situations occur while considering the timing of the reflected waves. In the first situation, illustrated by Fig. 8a, the reflected waveforms are reflected back and arrive back at the drain node of the RF transistor when the applied burst has already ended. In this situation, burst signals with a duty cycle above 50%, overlap with the broadcast burst introducing an efficiency drop for these input signals. The reflected waveforms are illustrated in a dotted line to emphasize the timing. The real shape of these reflected waveforms will never be rectangular, as drawn, because these reflections only contain out-of-band spectral components.
The effect of reflections on the operation of the RF PA: (a) interference of the reflected waveforms with the broadcast burst and (b) simulation setup.

By changing the transmission line length to interconnect the filter with the output of the RF PA, one could time the reflections at the drain side of the transistor in such a way that they are added on top of the voltage waveforms from the broadcast burst. This second possibility is visualized in the bottom situation of Fig 8a. All this emphasizes that the length of the transmission line is very critical. One of the appealing aspects of this second technique is that the peaks and notches in efficiency always appear when the reflections are on top and in between the broadcasted input burst respectively. These peaks appear when the length of the transmission line is a multiple of λrf /2, with λrf representing the wavelength of one RF pulse in the burst.
To further investigate and understand the influence of these reflections on the linearity of the RF PA, an idealized representation of this burst mode RF PA with the transmission line is essential and is given in Fig. 8b. This switching RF PA has been replaced by a square-pulse voltage supply with a source impedance R PA. The transmission line between the power amplifier and the band-pass filter, has a characteristic impedance Z 0. The total load of the amplifier consists of the band-pass filter and the resistive load R load with a transmission line in front. The values of the source impedance of the RF PA, the characteristic impedance, Z 0, and the load impedance, R load, are not necessarily different.
When an input signal with a fixed duty cycle is applied, this circuitry behaves completely linear, hence the name “static linearity”. Moreover, by changing the transmission line length, the linearity is not affected.
On the contrary, the “dynamic linearity” could be studied by applying a constantly changing duty cycle. Typically, a two tone test is used to investigate this effect. In this case, a distinction should be made concerning the source impedance of the amplifier, R PA. On the one hand, consider the case where the source impedance R PA is equal to the characteristic impedance of the transmission line, Z 0, then no reflections occur at the source side. Of course, the out-of-band spectral components reflect back at the input side of the filter and return via the transmission line into the source. Consequently, the source consumes all out-of-band energy. On the other hand, when the output impedance of the power amplifier, R PA, is not equal to the characteristic impedance of the transmission line, Z 0, reflections also take place at the source side. This results in a traveling wave, existing of out-of-band spectral components, on the transmission line between the filter and the power amplifier. These reflections not only degrade the efficiency performance, as explained before, but also introduce a discrepancy in the third order intermodulation product. As a conclusion, when a signal is applied with a constantly varying duty cycle, a “memory effect” is induced which leads to distortion, due to the reflections on the introduced transmission line between the RF PA and the narrow band-pass filter.
V. IMPLEMENTATION AND SIMULATION RESULTS
A) Implementation
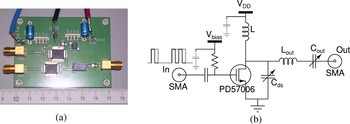
Figure 9 shows the schematic and the photograph of the Class E burst mode RF amplifier implemented on PCB in FR4-material with discrete components. The single-ended switching amplifier itself is constructed with the LDMOS-transistor PD57006. The operating carrier frequency, f rf, of the burst mode PA is 100 MHz. An example of the square wave signals with varying duty cycle applied at the input, is also illustrated in the schematic in Fig. 9b. All measurements and simulations are realized with an envelope frequency, f burst, of 5 MHz, unless mentioned otherwise.
The burst mode RF PA implemented on PCB: (a) PCB photograph and (b) schematic of the Class E burst mode RF PA.

B) Experimental results
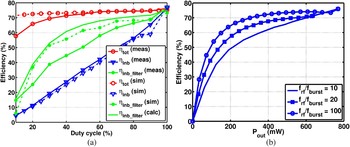
Efficiency measurements for this single-ended Class E burst mode RF PA are provided in Fig. 10a. This figure shows the measurement results as well as the simulation results for several situations. First and foremost, consider the efficiency curves for the simulations, ηtot (sim), and the measurements, ηtot (meas), for the total output power, P tot. Both these efficiency curves approximate the ideal efficiency curve that has been stated in Section III. This curve is captured by contemplating that this total efficiency ηtot is calculated by the ratio of the sum of the in-band and the out-of-band power by the total DC power consumption of the PA.
The efficiency of a burst mode PA: (a) measured versus simulated efficiency of the switching mode PA and (b) measured efficiency for different T burst and T rf.

When this switching amplifier sees a 50 Ω-wideband load, this results in the dissipation of all out-of-band power and the simulated and measured efficiency curves, ηinb (sim) and ηinb (meas), prove that the behavior is exactly similar to the traditional Class B efficiency, as proven in Section III.
The key issue to improve the efficiency curve and push it towards the ideal efficiency curve, is by connecting a narrow band-pass filter to the drain node of the switching amplifier. Due to insertion of the narrow band-pass filter, the out-of-band impedance characteristic seen by the LDMOS transistor is increased significantly. In this case, the ratio of the out-of-band power by the total output power generated by the transistor is now reduced to a minimum. This also means that the switching mode power amplifier is only generating the desired in-band signals at peak efficiency. The curves, ηinb_filter (sim) and ηinb_filter (meas), illustrate the efficiency enhancement that is offered by a burst mode PA compared to the conventional Class B amplifier. The simulated and the measured efficiency results approaches the calculated efficiency-curve, ηinb_filter (calc), as illustrated for the DFC. All these measurement results prove the correctness of the formulas derived in Section III and show the efficiency enhancement of the burst-mode RF PA.
As mentioned in Section III, there is a power dissipation during the start and during the end of the burst which is independent of the duty cycle of the input signal. Due to this power loss, there is a reduction of the peak efficiency at lower duty cycles, as illustrated in Fig. 10. Consequently, by increasing the ratio of the envelope burst frequency, f burst, by the operating pulse frequency, f rf, the efficiency is improved. This is demonstrated in Fig. 10b: all the curves for several envelope burst frequencies, f burst, are displayed with a fixed operational pulse frequency, f rf.
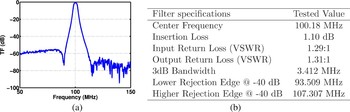
The frequency response of the commercial filter used for all measurements is shown in Fig. 11a [Reference François, Reynaert, Wiesbauer and Singerl5]. The most important characteristics of the filter are summarized in the table in Fig. 11b. The introduction of a transmission line with a certain length results in a transformed impedance characteristic seen by the amplifier. Several coaxial cables, with a characteristic impedance of 50 Ω, were realized to measure the effect of the transmission line on the impedance characteristic of the filter and on the operation of the power amplifier. For this specific filter, adding a transmission line of 45 cm improves the out-of-band impedance at f rf + f burst, f rf − f burst, f rf = 2f burst and f rf − f burst, from 28.2, 48, 52, and 14.8 Ω to 230, 222, 3376, and 2590 Ω, respectively, as depicted in Fig. 12. Furthermore, the transformed impedance characteristic is much more symmetrical and of course, the in-band impedance does not change and stays at 50 Ω.
The measured transfer function 11(a) and the most important numbers of the frequency response of the filter (b).

The measured impedance characterictic of the filter with and without the 45 cm transmission line in front.

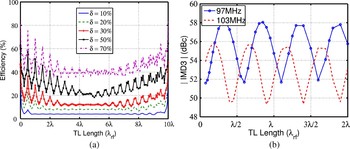
In other words, depending on this transmission line length, more (less) out-of-band spectral components are generated and dissipated, resulting in both peaks and notches in efficiency. Simulation results, as shown in Fig. 13a, reveal that both the peaks and the notches in efficiency behavior appear every λrf/2 as a result of the constructive and destructive interference of the reflected waveforms respectively.
Simulation results for the efficiency and the linearity of the idealized burst mode PA: (a) simulation of efficiency versus transmission line length for different duty cycles and (b) third Order intermodulation sidebands for varying transmission line length and a source impedance R s = 25 Ω.

To understand the origin of these peaks and notches, one should take a closer look in time domain. As explained in Section VI, the timing of the transmitted of the broadcast signals and the reflected signals is causing this efficiency variation. Figure 13a shows the efficiency dependency of the burst mode PA on the transmission line length. Every transmission line with a length equal to a multiple of λrf/2, assures that the PA sees the same impedance as without the transmission line. When a transmission line is present, then initially during burst signal generation, the power amplifier sees a wideband 50 Ω-load and this introduces extra power consumption. The overall efficiency drops by increasing the transmission line length and reaches a minimum when the transmission line length is equal to λburst/4. Assuming a duty cycle which is lower than 50% as such that no interference between the reflected and the transmitted bursts could ever happen at a transmission line length of λburst/4, then this minimal efficiency performance is linear proportional to the duty cycle: ηmin ≈ 1/2 δ.This approximation for the minimal efficiency is not valid any more for duty cycles above 50%. Figure 13a repeats itself every 10λburst, which also corresponds to λburst/2. Then the transmission line length causes the reflections to return during the next period.
It is also possible to use the model represented in Fig. 8b to trace out the efficiency curve by examining the effect of the overall out-of-band impedance, Z outb_avg, and the in-band impedance, Z inb, and the ratio of reflected pulses positively interfering with the broadcast bursts, n pi. The overall out-of-band impedance, Z outb_avg, is the average out-of-band impedance seen by the PA weighted with its harmonic power for a non-ideal narrow band-pass filter. The in-band and the out-of-band power generated by the PA are proportional to both the duty cycle and the in-band impedance and the overall out-of-band impedance, respectively.
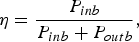

Taking into account the ratio of reflected pulses positively interfering with the transmitted bursts, n pi, equation (16) becomes:

Not only efficiency performance is affected, these reflections also influence the linearity behavior of the power amplifier. In this paper, the linearity of this RF PA is investigated by applying a two-tone signal with a 1 MHz tone spacing. Considering, the simplified model of the RF PA in Fig. 8b with an output impedance differing from the characteristic impedance of the transmission line, the simulation results by applying a two tone signal are denoted in Fig. 13b. For this situation, the reflected out-of-band waves originating from the filter-side, travel back over the transmission line to the amplifier and another reflection occurs. This causes a clear difference in the third order intermodulation products for both side-bands. This is called the “dynamic linearity” of the PA. Fig. 13b clearly indicates the influence of the transmission line length on the linearity. Furthermore, since this third order intermodulation product is depending on the transmission line length and is different for each duty cycle, this circuit is suffering from a “memory effect”. In practice, a switching amplifier has a non-linear output impedance varying by the input signal, then this non-linear behavior becomes even worse.
VI. CONCLUSION
In this paper, the burst mode RF PA topology is presented and a complete fundamental analysis of the efficiency behavior of the burst mode RF PA has been performed. For this analysis, a comparison between the efficiency of the burst mode PA connected to either a wideband load or a narrowband filter is investigated. A prototype fabricated with an operating frequency of 100 MHz is realized in FR4 with discrete LDMOS transistor to validate the theory and simulation results. We conclude the study by proving that the efficiency of the switching RF PA is improved by directly interconnecting the narrow band-pass filter, compared to the conventional Class-B efficiency curve. Measurement and simulation results show that a burst mode RF PA offers an efficiency enhancement at power back-off. Although, one have to pay special attention to the interconnect between the power amplifier and the narrow-band filter in order not to deteriorate the performance of the switching RF power amplifier. As a proof, a transmission line is introduced between the RF PA and the narrowband filter and measurement and simulation results reveal that reflections simultaneously arise and furthermore, the efficiency and linearity performance of the amplifier is degraded. In addition, it is shown that these reflections provoke a non-linear behavior and that the RF PA maybe starts to suffer from a “memory effect”.
ACKNOWLEDGEMENTS
The authors would like to thank Andreas Wiesbauer and Marc Tiebout from Infineon Technologies, Austria and Pieter Nuyts from MICAS – K.U. Leuven for the many discussions and their contributions to this research. This research is supported by the FP7-project DRAGON.
 Brecht François (S'09) was born in Kortrijk, Belguim, in 1984. He received the master of electronics and electrical engineering degree from the Katholieke Universiteit Leuven (K.U. Leuven), in Leuven, Belguim, in 2008 and currently he is a teaching assistant at the ESAT–MICAS Laboratory, Katholieke Universiteit Leuven, where he is working towards the Ph.D. degree RF power amplifiers. His research interests include high efficiency and high output fully integrated power amplifier design for handset-devices using magnetically coupled power combining.
 Peter Singerl received an M.S. in telematics and a Ph.D. in electrical engineering from Graz University of Technology, Austria, in 2000 and 2006, respectively. From August 2003 to March 2007, he was with the Christian Doppler Laboratory for Nonlinear Signal Processing at the Graz University of Technology. He joined Infineon Technologies Austria in August 2000, where he is currently working as a Concept Engineer and Engineering Manager for wireless communication applications. His research interests include the identification and linearization of power amplifiers as well as system concepts for radio basestation transceivers. He received two international student best-paper awards and has authored and co-authored more than 20 international publications including journal, and conference papers and patents.
 Andreas Wiesbauer received the M.S. and Ph.D., degrees in electrical engineering from the Vienna University of Technology, Vienna, in 1991 and 1994. From 1996 to 1997, he was a research associate at Oregon State University, where his research focused on sigmadelta data converters. In 1997, he joined Inneon Technologies Design Center in Villach. Currently, he is Senior Principal Engineer for analog and mixed signal concepts and circuits. His research interests are in the area of low-voltage CMOS implementations of oversampling, and high-speed data converters and wireless transceiver circuits and architectures. He has authored and coauthored more than 50 publications and holds more than 20 patents.
 Patrick Reynaert (S'01) was born in Wilrijk, Belgium, in 1976. He received the master of industrial sciences in electronics from the Karel de Grote Hogeschool, Antwerpen, Belgium in 1998 and both the Master of Electrical Engineering and the Ph.D. in engineering science from the Katholieke Universiteit Leuven (K.U.Leuven), Belgium in 2001 and 2006, respectively. From 2001 to 2006, he was a Teaching and Research Assistant within the MICAS research group of the Department of Electrical Engineering (ESAT), K.U. Leuven, Belgium. While working towards his Ph.D. degree, his main research focus was on CMOS RF power amplifiers and analog circuit design for mobile and wireless communications. During 2006–2007, he was a post-doctoral researcher at the Department of Electrical Engineering and Computer Sciences of the University of California at Berkeley. Since October 2007, he is an Associate Professor at the Katholieke Universiteit Leuven, department of Electrical Engineering (ESAT).