


I. INTRODUCTION
The synthesis of metal nanoparticles (NPs) is the subject of intense research because the NPs exhibit particular properties that are useful in several technological fields.Reference Henglein1–Reference Tessier, Velev, Kalambur, Rabolt, Lenhoff and Kaler7 Cu-NPs are very functional for use with conductive coatings, lubricants, sintering additives,Reference Giuffrida, Costanzo, Ventimiglia and Bongiorno8 and biosensors.Reference Kim, Yoo, Park, Yoshikaw, Tamiy, Park and Lee9 The Cu-NPs are anti-inflammatory,Reference Jackson, Mkhonta-Gama, Voye and Kelly10 reduce gastrointestinal mucosa,Reference Szymański, Frączek, Markowicz and Mikiciuk-Olasik11 antioxidative,Reference Deng, Cheng, Jin, Qia and Xiao12 antiulcer,Reference Tuorkey and Abdul-Aziz13 and are useful in preventing skin photosensitivity.Reference Bilgin, Elçin and Elçin14 The Cu-NPs strongly absorb light beams in the visible region (about 600 nm), arising from localized surface plasmon resonance (LSPR).
Recently, the application of vegetable oils such as palm oil,Reference Zamiri, Zakaria, Ahangar, Sadrolhosseini and Mahdi15 coconut oil,Reference Zamiri, Azmi, Sadrolhosseini, Ahangar, Zaidan and Mahdi16 and castor oilReference da Silva, da Silva, Meneghetti, Machado, Alencar, Hickmann and Meneghetti17 for dispersing the nanoparticles was considered for the preparation of nanometals.Reference Wu, Fu, Aslam, Wong and Dravid18 These natural compounds contain triglycerides and nonpolar long carbon chainsReference Mansor, Che Man, Shuhaimi, Abdul Afiq and Ku Nurul19 that prevent NP agglomeration through steric repulsion.Reference Zamiri, Azmi, Sadrolhosseini, Ahangar, Zaidan and Mahdi16 VCO is extracted from fresh coconut. This oil is derived without heating, bleaching, refining, and deodorizing.Reference Enig20 VCO has the saturated fat acid that contains predominantly medium-chain triglycerides.Reference Enig20–Reference Zakaria, Rofiee, Somchit, Zuraini, Sulaiman, Teh, Salleh and Long22
Many methods, such as solution phase,Reference Raveendran, Fu and Wallen23 photochemical,Reference Loginov, Gorbunova and Boitsova24–Reference Giuffrida, Condorelli, Costanzo, Ventimiglia, Lo Nigro, Favazza, Votrico, Bongiorno and Fragalà26 sonochemical,Reference Jiang, Wang, Zhao, Zhang and Zhu27 electrochemical synthesis methods,Reference Haas, Shanmugam and Gedanken28 and dc-magnetron sputtering,Reference Chawla and Chandra29 are used for synthesis of Cu-NPs. These methods are based on the reduction of metal ions. Laser ablationReference Giuffrida, Costanzo, Ventimiglia and Bongiorno8,Reference Mansor, Che Man, Shuhaimi, Abdul Afiq and Ku Nurul19,Reference Takeshi, Iryo, Nishimura and Tsuji30 is a green method for fabrication of the NPs based on ablation of metal plates. In the literature, the preparation of the Cu-NPs in water,Reference Swarnkar, Singh and Gopal31 distilled water,Reference Aye, Choopun and Chairuangsri32 acetone,Reference Kazakevich, Voronov, Simakin and Shafeev33,Reference Muniz-Miranda, Gellini and Giorgetti34 and ethanolReference Kazakevich, Voronov, Simakin and Shafeev33 was reported using laser ablation, and Malyavantham et al.Reference Malyavantham, O’Brien, Becker, Keto and Kovar35 used the laser ablation method to prepare the Au–Cu NPs alloy.
The application of pulsed lasers offers a novel unique tool for nanofabrication.Reference Kabashin and Meunier36 When the laser ablation is used to produce the NP in the aqueous solution, the NP can be released inside the solution and nanofluid is formed.Reference Sylvestre, Kabashin, Sacher, Meunier and Luong37,Reference Sylvestre, Kabashin, Sacher and Meunier38 The properties of NPs are unique, high purity, and high surface stability.Reference Hahn, Barcikowski and Chichkov39–Reference Besner, Kabashin, Winnik and Meunier41 For example, the fabrication of the Cu-NPs in liquid does not require any chemical reducing agent.Reference Jaaskelainen, Peiponen and Raty42,Reference Kabashin and Meunier43
In this article, the preparation of the Cu-NPs in VCO was investigated using laser ablation. The effect of ablation time on size and concentration of the Cu-NPs, the capping effect of VCO on produced NPs, and optical properties of the Cu-NPs in VCO were the main objective. Hence, the Cu-NPs were characterized with a UV-visible double-beam spectrophotometer, transmission electron microscopy (TEM), Fourier transform infrared spectroscopy (FTIR), and the refractive indices obtained using the surface plasmon resonance (SPR) technique. Moreover, the nonlinearity effect of the Cu-NPs was investigated with special self-phase modulation.
II. EXPERIMENTAL SECTION
A. Laser ablation setup
Figure 1 shows a schematic diagram of the laser ablation setup. The copper plate (99.99% purity; Sigma Aldrich, St. Louis, MO) was immersed in 10 mL of VCO (Aldrich). Prior to ablating the copper plate, the VCO was purged with nitrogen gas for 30 min. The nitrogen gas flowed through the tank and passed through the VCO, and oxygen and nitrogen escaped from the valve that was placed at the top of the tank. After 30 min, the valves were closed and in the presence of nitrogen to eliminate the oxygen, the copper plate was ablated with a pulsed Q-Switched Nd:YAG laser with pulse durations of 10 ns and a 40-Hz repetition rate at a wave length of 532 nm. The laser output power, laser spot size before the lens and at the focal point of lens were 1200 mJ/pulse, 12 and 3.5 mm, respectively. To disperse the Cu-NPs in VCO, they were stirred magnetically during the ablation process. The laser beam was focused at the copper target with a 300-mm focal length lens at room temperature with different durations of 5, 10, 20, and 30 min.
Laser ablation setup contains a laser, a lens, a cell, a stir, a copper target, and N2 tank. The fluid cell is double shell and was connected to N2 gas. The N2 pass through VCO and escaped from output valve. The dimensions of copper plate and fluid cell were 10 × 10 × 3 mm and 25 × 20 × 40 mm, respectively.

The morphology of NPs was examined by TEM (Hitachi H-7100; Hitachi, Chula Vista, CA) at an accelerating voltage of 120 kV. The images were analyzed by UTHSCSA image tool software program to determine the particle size. The UV-visible spectrum of samples was obtained by using a double beam photospectrometer (Shimadzu, Columbia, MD) with 1-cm optical path cell, and the concentrations of the Cu-NPs were measured by using atomic absorption spectroscopy (AAS; Thermo Scientific Model S Series).
B. Surface plasmon resonance
The SPR setup (Fig. 2), based on the Kretschmann configuration, was used to measure the refractive index of the nanofluid. The transverse mode (TM mode) of the electromagnetic wave was achieved via the polarizer and was delivered through a high index prism (SF52, Foctek). The prism and flow cell that contains the sample were placed on a rotation stage and rotated up to 30° at increments of 0.016° step size. The photodiode was attached to the rotation stage, and it was sensitive to the intensity of incident light and the variation of the incident light after the reflection was registered when the rotation stage was momentarily stopped. The experiment was repeated for each sample at room temperature. In this configuration, the energy and momentum conservation must be satisfied to excite surface plasmons. Hence, the momentum of the incoming light must be equal to the momentum of the plasmons.
SPR setup contains a He–Ne laser, a polarizer, a photodiode, a flow cell, and a high index prism.
The angle of resonance was a function of thickness, optical properties of the gold layer, and nanofluid as follows:
 $$n_{\rm{p}} \sin {\rm{\theta }}_{\rm{R}} = \sqrt {{{(n_1^2 n_2^2 )} \mathord{\left/ {\vphantom {{(n_1^2 n_2^2 )} {(n_1^2 + n_2^2 )}}} \right. \kern-\nulldelimiterspace} {(n_1^2 + n_2^2 )}}} \quad ,$$
where θR, n p, n 1, and n 2 were the resonance angle, refractive indices of the prism, gold layer, and probed medium, respectively.Reference Homola44 The refractive index of the nanofluid was
 $$n_2 = \sqrt {{{(n_1^2 n_{\rm{p}}^2 \sin ^2 {\rm{\theta }}_{\rm{R}} )} \mathord{\left/ {\vphantom {{(n_1^2 n_{\rm{p}}^2 \sin ^2 {\rm{\theta }}_{\rm{R}} )} {(n_1^2 - n_{\rm{p}}^2 \sin ^2 {\rm{\theta }}_{\rm{R}} )}}} \right. \kern-\nulldelimiterspace} {(n_1^2 - n_{\rm{p}}^2 \sin ^2 {\rm{\theta }}_{\rm{R}} )}}\quad .} $$
If A and θ1 were the prism apex and the angle of incidence of light beam directed to the prism, the angle of incidence on the metal layer was obtained as followsReference Sadrolhosseini, Moksin, Yunus and Talib45:
 $${\rm{\theta }}_2 = A - \arcsin \left( {{{(n_{{\rm{air}}} } \mathord{\left/ {\vphantom {{(n_{{\rm{air}}} } {n_{\rm{p}} }}} \right. \kern-\nulldelimiterspace} {n_{\rm{p}} }})\sin {\rm{\theta }}_1 } \right)\quad ,$$
where n air was the refractive index of air (Fig. 2).
If the incidence angle at the interface between the prism and the gold layer was obtained from Eq. (3), the refractive index of the nanofluid was obtained by minimizing the sum,Reference Jaaskelainen, Peiponen and Raty42
 $$\Gamma = \mathop\sum\limits_{\rm{\theta }} {[{R_{{\rm{Exp}}}}({{\rm{\theta }}_2}) - {R_{{\rm{Theory}}}}({{\rm{\theta }}_2})]\quad ,}$$
where R Exp and R Theory were the experimental and theoretical reflectivity, respectively. R was a function of angle and wave length and was achieved from the reflection coefficient (R = rr*, where r was the reflection coefficient)Reference Sharma46 that was derived from the Fresnel equation. In this study, the matrix method, which is explained in Ref. Reference Sadrolhosseini, Moksin, Yunus, Talib and Abdi47, was used for data analysis with Matlab software.
SPR is a versatile and powerful technique to characterize the material and biomaterials because the light beam never passes through the medium of interest and hence, the effect of absorption of the light in the material can be ignored. Moreover, the refractive indices of nanofluid-based metal NPs have real and imaginary parts, and the SPR signal is sensitive and accurate to a small variation of them.Reference Young Kim, Sadrolhosseini, Noor and Moksin48
C. Spatial self-phase modulation
In this study, the spatial self-phase modulation (SSPM) was investigated for nonlinear properties of the Cu-NP in VCO. When the laser beam interacts with the medium, the change in the refractive index is proportional to beam intensity. SSPM depends on phase shift that is achieved by the refractive index change on far-field diffraction pattern and can be expressed by Fraunhofer approximation of the Fresnel–Kirchhoff diffraction equation as followsReference Deng, He, Zhou and Li49:
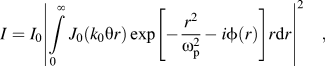 $$I = {I_0}{\left| {\int\limits_0^\infty {{J_0}({k_0}{\rm{\theta }}r)\exp \left[ { - {{{r^2}} \over {{\rm{\omega }}_{\rm{p}}^2}} - i\phi (r)} \right]} r{\rm{d}}r} \right|^2}\quad ,$$
where θ,  $\phi$, ωp, r, and k 0 are far-field diffraction angle, angular coordinate on exit plane, beam radius at the medium, radial coordinate, and wave number in free space, respectively. I 0 is in proportion to linear absorption coefficient (α), wave length (λ), medium thickness (L), and distance from medium to observational plane (D) as follows:
 $${I_0} = 4{{\rm{\pi }}^2}{\left| {{{E(0,{z_0})} \over {i{\rm{\lambda }}D}}\exp ( - {\rm{\alpha }}L/2)} \right|^2}\quad .$$
The SSPM setup contains a solid-state CW laser (LDCU8/7870) of 405 nm wave length and 50 mW power, lens (f = 21 cm), and CCD camera. The sample placed in a quartz cuvette cell with 2-mm thickness was located at the distance where the incident beam diverged on the sample entrance plane. The SSPM pattern due to nonlinear effect of the Cu-NP appeared on a screen at 40 cm behind the sample and a CCD camera captured the pattern.
III. RESULT AND DISCUSSION
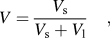
The optical absorption spectra of the VCO with the Cu-NPs are shown in Fig. 3. The baseline was related to pure VCO before the irradiation of the copper plate. As seen in Fig. 3, the UV-visible peaks appeared at about 600 nm. The peak intensity depends on the concentration of the Cu-NPs in VCO and increases with increasing particle volume fraction or ablation time. Despite the broad spectrum, this peak arose from a LSPR of the Cu-NPs and the width of spectrum at higher wave length could also increase due to the SPR coupling of particle agglomerates. Therefore, it confirmed that the Cu-NPs were formed in VCO, and verified that the NPs are spherical. The concentrations of Cu-NPs for different ablation times, which were measured by AAS, were 0.066, 0.16, 0.32, and 0.71 mg/L, respectively. The volume fraction of NPs was calculated by the following equation:
 $$V = {{{V_{\rm{s}}}} \over {{V_{\rm{s}}} + {V_{\rm{l}}}}}\quad ,$$
where V l and V s (V s = m/ρ, where m and ρ are the mass and density of particles) are the volume of oil and volume of particles, respectively. The volume fractions of copper nanofluid for different ablation times were obtained to be 0.0737 × 10⁻⁷, 0.1786 × 10⁻⁷, 0.357 × 10⁻⁷, and 0.792 × 10⁻⁷. Hence, the volume fraction increased with increasing the ablation time.
UV-visible spectrum of Cu-NPs. The results show that the UV-visible spectrum for Cu-NPs was dispersed in VCO using laser ablation with different times.
Figure 4 shows the TEM pattern and its expression of the particle size and shape that was distributed in the VCO using laser ablation technique. TEM images showed nonagglomerated as well as scattered Cu-NPs with spherical shape. The average size diameters of the Cu-NPs for 5, 10, 20, and 30 min ablation times are 11 nm, 10 nm, 7 nm, and 4 nm, respectively. The decrease in particle size depends on the interaction between VCO molecules that capped NPs and laser beam. The NPs form during the laser ablation process through phase transition and nucleation, so crystals of copper cluster were grown from released copper atoms, and VCO can cap Cu-NPs. The laser beam interacts with molecules of VCO with Cu-NPs, and the NPs were broken to smaller particles. Hence, the particle size decreased with increasing the ablation time.Reference Yang50
TEM images and typical of statistical graphs for Cu-NPs in VCO in different ablation times. [5 min (a–b), 10 min (c–d), 20 min (e–f), and 30 min (g–h)]. The particle sizes for 5, 10, 20, and 30 min are 11, 10, 7, and 4 nm, respectively (N is the number of particles).
The FTIR spectra in Fig. 5 were recorded to identify the possible capping of Cu-NPs by the VCO when synthesized by laser ablation. These results show the FTIR spectrum of VCO that did not contain any impurity and the spectrum containing Cu-NPs that was capped with VCO. These results exhibit FTIR spectra of pure VCO, pure VCO after irradiated with Nd:YAG laser during 30 min, and Cu-NPs in VCO at a frequency region of 4000–300 cm−1. The spectrum in Fig. 5(a) shows transmission peaks for pure VCO at 2914, 2850, 1737, 1628, 1454, 1359, 1219, 1147, 1100, 953, 869, 717, 573, 407, and 313 cm−1. Similarly, Fig. 5(b) shows the transmission peaks for pure VCO after irradiated with laser at 2914, 2850, 1737, 1628, 1454, 1359, 1219, 1147, 1100, 952, 869, 718, 579, 405, and 307 cm−1 as a baseline.
Plots (a) and (b) show the FTIR results for pure VCO, pure VCO after irradiated the Nd:YAG laser for 30 min as baseline, respectively. Plot (c) shows the FTIR result of Cu nanofluid, and the peak is in 432 cm−1 is related to bonding of Cu-NPs with hydroxyl group.
Transmission peaks for the Cu-NPs in VCO were obtained at 2918, 2851, 1740, 1615, 1455, 1363, 1219, 1148, 1101, 951, 869, 718, 565, 432, and 361 cm−1 for Fig. 5(c). The absorption peaks located around 2914, 2850, 1737, 1219, and 1100 cm−1 can be assigned to the absorption peaks of –CH3, –CH2 asymmetrically, –C=O, cis –C=C, and –C–O stretching groups, respectively, and the absorption peaks at 1730 and 1100 cm−1 show the aldehyde (C=O) and esters (C–O) of VCO, respectively.
The absorption peaks around 1454, 1359 and 953, 951, 717, and 718 cm−1 can be assigned to the absorption peaks of –CH3, –CH2, CH=CH– and cis-CH=CH– bending groups and also 869 cm−1 for =CH2 wagging. VCO contains methylene (CH2) and methyl (CH3) groups. The FTIR depicted two alkane peaks at 1454 and 1359 cm−1, which are related to their bending absorption. In Fig. 5(c), the broad peaks at 565, 432, and 361 cm−1 are related to the van der Waals bonding with oxygen from hydroxyl groups of VCO compounds with surface charges of Cu-NPs.Reference Swarnkar, Singh and Gopal31,Reference Nasirian51
The refractive indices of VCO and nanofluids were obtained after the analysis of the SPR signals (Fig. 6). The refractive index of VCO is 1.44368 and is real. As shown in Figs. 7(a) and 7(b), the real and imaginary parts of the refractive index of the nanofluid were obtained by minimizing Eq. (4). The refractive indices of nanofluid for 5-, 10-, 20-, and 30-min ablation time are 1.44371 + 0.0034, 1.44376 + 0.0051i, 1.44382 + 0.0096i, and 1.44387 + 0.0142i, respectively. Hence, the refractive index increased with increasing volume fraction and the angle of resonance shifted from 60.6° to 60.7°. Consequently, the SPR signal is sensitive to variation of the volume fraction of Cu-NPs in VCO.
SPR signal for different concentrations of nanofluid. Angles of resonance for 5 min, 10 min, 20 min, and 30 min are 60.646°, 60.662°, 60.702°, and 60.745°, respectively. The sub figure shows the SPR signal for pure VCO and the resonance angle is 60.625°.
Variation of refractive index of nanofluid versus to concentration of Cu-NPs. (a) Real part; and (b) imaginary part.
In Fig. 8, the SSPM patterns are shown. The samples were located behind the focal length. These patterns are far-field diffraction due to nonlinearity effect of the Cu-NPs. The diameter beam increased after passing through the copper nanofluid. In accordance with Figs. 8(a)–8(d), the beam diverged and the spot size increased. Hence, the nanofluid behaves like a negative lens, and the laser beam diverged after passing through the sample. Moreover, this phenomena increase with increasing concentration of the Cu-NPs. It shows that the Cu-NPs induced the nonlinearity effect in the laser beam, when passed through the sample, and the SSPM pattern appeared.Reference Ono, Igarashi and Harato52–Reference Zamiri, Zakaria, Ahmad, Sadrolhosseini, Shameli, Darroudi and Mahdi55
Diameter and number of diffraction pattern in SSPM increased with increasing the concentration of Cu-NPs. [5 min (a), 10 min (b), 20 min (c), and 30 min (d)].
IV. CONCLUSION
Cu-NPs were synthesized in VCO using a laser ablation method. The bonding between oxygen from hydroxyl groups of VCO and Cu-NPs occurred. The particle sizes of 11, 10, 7, and 4 nm were obtained for 5-, 10-, 20-, and 30-min ablation time, respectively. The NPs formed in VCO with different particle sizes, and VCO prevents the agglomeration of Cu-NPs. With increasing ablation time, the particle size reduced, and optical properties such as absorption, refractive index, and nonlinearity effect were increased. Consequently, laser ablation is an environmentally friendly and green method for preparation of Cu-NPs in VCO.



