


INTRODUCTION
Recent work in sociolinguistics has considered the influence of one's secondary education on patterns of synchronic and diachronic variation (Labov, Fisher, Gylfadottír, Henderson, & Sneller Reference Labov, Fisher;, Gylfadottír;, Henderson; and Sneller2016). Such work appeals to the differing social networks among students in different educational systems as an explanation for this influence. In this article I draw on a sample of sociolinguistic interviews conducted with speakers from St. Louis, Missouri, to likewise consider the role of secondary education in synchronic and diachronic variation. While I do see a role for differing social networks here, my attention is primarily drawn to the saliency of secondary education within the community and its utility in constructing social categories. As I show here, in Greater St. Louis, secondary education and the categories constructed on the basis of it are salient enough that we should ask whether it may lend itself to situations in which linguistic practice indexes social meaning (Eckert Reference Eckert2008). That is, we should ask whether synchronic variation indexes education type. Such saliency is quite apparent: an enregistered cultural practice (Agha Reference Agha2003) of the area is to ask someone where they went to high school upon meeting them. Locals carry stereotypes about attendees of many specific high schools in addition to generalizations about types of school.
As such, I consider education type to be a locally salient category (see Labov Reference Labov1963; Eckert Reference Eckert1988, inter alia for examples) which reflects divisions within the community that the community itself deems valid and of importance. For older St. Louisans, this category manifests as a divide between those who attended Catholic high schools (‘Catholics’) and those who attended public schools (‘Publics’). For many speakers, this divide ran deeper than mere school rivalry and is ideal for testing whether education type is indexed by linguistic production. I show that older St. Louisans display significant differences in production of vowels in the Northern Cities Shift (NCS; see Labov, Ash, & Boberg Reference Labov and Boberg2006) based on education type. However, due to sample confounds with speakers’ current residence, I conservatively limit my discussion to a key difference which appears to be unambiguously due to education type: Publics have a lower thought vowel than Catholics. In isolation, this difference could be read as reflecting the important role that social networks play in advancing/slowing language change (as claimed in Labov et al. Reference Labov, Fisher;, Gylfadottír;, Henderson; and Sneller2016).
However, my main interest lies in claiming that this difference also carries social meaning by indexing the Catholic/Public divide that was present in the city while the speakers were adolescents. Along this line of inquiry, I further consider whether the difference in thought production is maintained diachronically, and find that it weakened in apparent time. I draw on Brubaker's (Reference Brubaker2004) view of groups as events and actions to argue that these categories were indexed only for speakers who came of age during the period in which they had a high degree of groupness. As such, the linguistic results reflect two social changes within St. Louis that led to diminished groupness between Catholics and Publics: the reforms of the Second Vatican Council (Vatican II) and extensive White Flight from the city during postwar suburbanization. This approach to groups offers a theoretical framework that contributes to answering Hall-Lew's (Reference Hall-Lew2017) call to consider how changes in societal structure are reflected in changing patterns of linguistic variation.
EDUCATION AS A SOCIAL FACTOR
Sociolinguists have been attuned to the role of education in linguistic variation for some time. Much of this is because of how education may serve as a proxy for class.Footnote 1 Socioeconomic status is linked to access to higher education, and those with a college education generally outearn their peers without a BA/BS degree. Education level is thus used as one of many factors in creating holistic class indices for sociolinguistic analysis (see for example Labov Reference Labov1966/2006; Becker Reference Becker2010). Recent work has shown education to be important for reasons other than class, both in terms of education level and education type.
In addition to its link to socioeconomic status, education level relates to linguistic prescriptivism and language contact. Retreat from stigmatized linguistic features is often led by highly educated speakers. For example, Prichard & Tamminga (Reference Prichard and Tamminga2012) show that reorganization of the Philadelphia short-a system is led by speakers with a college education. Bigham (Reference Bigham2010) notes that at a university in Southern Illinois, students from Southern Illinois and Northern Illinois are in a language contact situation when mixed together in classes and organizations because the regions they come from are culturally and linguistically distinct. He shows that students who grew up in Southern Illinois display effects of accommodation that nonstudents from the same region do not. Each of these three influences—class, prescriptivist ideology, and language contact—combine to suggest that highly educated speakers will use more standard features than less educated speakers.
While one's level of education may be a social factor influencing variation patterns, the type of education received at a given level is found to be important as well. For example, the finding that college-educated Philadelphians are leading reorganization of the short-a system is mediated by the type of college education these speakers received (Prichard & Tamminga Reference Prichard and Tamminga2012). Speakers who attended a national college, which recruits students from across the United States, lead the retreat, followed by speakers who attended regional colleges, which recruit students from a smaller geographical footprint. Here we can see that the influences of class, prescriptivist ideology, and language contact combine to yield the effect of education type. National colleges and universities are often more expensive than regional schools, limiting access to them. These schools often are more prestigious as well, indicating that the influence of prescriptivist ideology may be stronger. Finally, a national recruiting footprint means that students will encounter more dialect contact at a national college than a regional college.
Labov et al. (Reference Labov, Fisher;, Gylfadottír;, Henderson; and Sneller2016) show that the effect of education type may be found based on secondary education as well. Looking again at the reorganization of the Philadelphia short-a system, they find that speakers who graduated from elite public magnet schools are more advanced in the reorganization than speakers who attended parochial Catholic high schools. They argue that this finding is rooted in two effects: access and ties within social networks. Because elite schools include special admissions criteria like an interview and can reject applicants, Labov et al. suggest that they are more limited in access than magnet schools that admit by lottery and neighborhood schools that freely admit students. The strength of social network ties is additionally important in their analysis. Elite schools and magnet schools that recruit across Philadelphia have student bodies with relatively weak ties, as classmates may not live near one another. By contrast, neighborhood schools, and particularly parochial Catholic schools, promote stronger ties and denser social networks. In the case of a parochial Catholic school, classmates are neighbors who (may) go to church together. Similar to the Philadelphia example, D'Onofrio & Benheim (Reference D'Onofrio and Benheim2019) find an effect of education type in Chicago that distinguishes between the linguistic production of speakers who attended Catholic secondary schools and speakers who attended public secondary schools. They find that Catholic school attendees have a higher trap vowel and fronter lot vowel than public school attendees.
Although the Philadelphia and Chicago studies find similar effects, they differ in interpretation. The effect of education type as described in Philadelphia is one of an externally imposed category. As such, the proposed reasons why education type plays a role in language change are focused on which students attend which institutions, but not what identities and relations are constructed among students at different institutions. In contrast, D'Onofrio & Benheim (Reference D'Onofrio and Benheim2019) suggest there may be a role for identity in the education type effect. They in spirit follow Eckert's (Reference Eckert1988) intra-school study of two public schools in suburban Detroit. Eckert finds that students construct social categories within the school to divide themselves into Jocks and Burnouts. While all students participate to some degree in the NCS, Burnouts are more advanced in their adoption of the features involved. Eckert suggests that within the schools, the students’ linguistic production indexes their social identity. The question of how students divide themselves into categories is the kind of question that we want to ask of inter-school identities and relations. We might expect that an effect of education type will serve as linguistic practice that indexes an identity associated with a school or set of schools, rather than simply reflecting differences in access to schooling and/or social network structure.
LOCATING THE STUDY
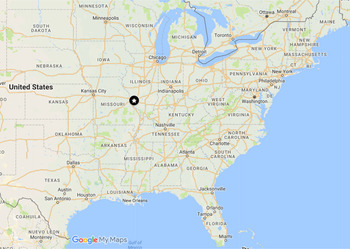
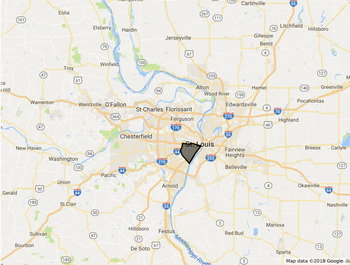
Greater St. Louis is a hypersegregated (Massey & Denton Reference Massey and Denton1989) and hypersuburbanized region of approximately sixteen counties in Missouri and Illinois. This region is centered on the City of St. Louis. In 2010, the City of St. Louis had a population of 319,294 (United States Census Bureau 2010), while the metropolitan area as a whole had over 2.8 million residents. This imbalance is an effect not only of massive development, but of White Flight, in which a large percentage of the white population moved from the urban core to the suburbs, as well (C. Gordon Reference Gordon2008). St. Louis is currently a majority-minority city (48.1% black, 45.5% white), and is itself highly segregated by race, with north St. Louis predominantly black and south St. Louis predominantly white. Figure 1 shows the location of Greater St. Louis within the US, while Figure 2 shows a more detailed map of the metropolitan area. For scale, the map in Figure 2 is approximately 120 miles/200 kilometers across from east to west; the middle 60 miles/100 kilometers centered on the City of St. Louis is more or less one contiguously populated urban area. While below I discuss qualitative data from speakers throughout Greater St. Louis, the quantitative data under discussion only includes speakers from South St. Louis (highlighted in Figure 2).
St. Louis within the United States.

Map of Greater St. Louis. Field site discussed in this article is highlighted.

EDUCATION TYPE IN GREATER ST. LOUIS
In this section, I demonstrate that education type is a locally salient category in Greater St. Louis. I outline the stereotypes about different schools found in the region, as well as how these stereotypes are constructed as a category among older speakers who grew up in the City of St. Louis. There are roughly six types of high school in the region: a cross between public/Catholic/private and regular/elite (Table 1). I have considered religiously affiliated non-Catholic schools to be private schools. Additionally, note that elite public schools are largely determined by residency; particularly affluent suburbs have prestigious school systems. This differs from Philadelphia, where elite public schools tend to be magnet schools within the city that have admissions requirements (Labov et al. Reference Labov, Fisher;, Gylfadottír;, Henderson; and Sneller2016). While St. Louis Public Schools (SLPS) do have an elite magnet school, it seems to be less well-known and carry lower prestige than the elite suburban schools.
Types of high school in Greater St. Louis and exemplars.

Where'd you go to high school?
A common local stereotype of Greater St. Louis is that residents ask one another, ‘Where did you go to high school?’ upon meeting for the first time. That they ask this is perhaps not surprising in a region with twenty-three public school systems in St. Louis County alone; the racial and economic segregation in the region is mapped onto the public educational system as a result. At the same time, Catholic schools are largely white (Phillips & Delaney Reference Phillips and Delaney2017). This means that one's answer to the question reveals quite a bit about one's background to interlocutors familiar with Greater St. Louis. Additionally, because there are so many schools, any ties between conversation participants and students in a given school system are highly localized, and likely indicative of overlapping social networks. As part of a larger project examining language variation and change in Greater St. Louis, I asked people from throughout the region about this question in nearly 100 sociolinguistic interviews: What does it mean? Do they ask it themselves? Almost every speaker recognized the question, and I received two types of answer regarding the meaning. Some speakers emphasize the role of the question in revealing network ties. Others, however, are quite aware that asking one's high school is asking them about other social factors.Footnote 3
(1) The reason why it's such a popular question is because it tells you what religion someone is, um, how much money they may have, you know like… almost immediately you know if they came from a wealthy area, if they came from a not so wealthy area, it's just a very telling question that you can check a lot of boxes with. (Molly H., 41)
(2) I, it's kind of an automatic, I don't wanna do it, but I just do it anyway… What's so frustrating about it is, it um, it is an immediate class question. You know, you can immediately tell obviously, and… there's no doubt that that has something to do with, you know, your socioeconomic status, so I feel bad ever doing it. (Eliza M., 34)
Speakers born after about 1970, and particularly those born after 1985, tend to dislike using it, as Eliza M. does. However, they report asking the question and wanting the answer anyway.
(3) (I: Interviewer, M: Molly H., 41)
I: Is that something you ask people yourself?
M: I do not. I do not {LG}. I try to avoid it, uh, like it's certainly not an icebreaker question in my book.
I: Okay, yeah. Is there a reason why?
M: Because, well, I really try to not be stereotypical, and I feel like that is such a stereotypical St. Louis based question, and I feel like if someone is not from the area it is literally the most off-putting question you can ask them. You know, and I don't really like where I went to high school anyway, so I don't care about it {LG}.
I: That is totally fair, yeah.
M: Yeah I mean, I do like to find out eventually {LG}. You know, cause then I can make all my judgements.
(4) [I] feel like now it's reached a point of irony that we ask each other. We're like {BR} “Where'd you go to high school?”. Um, but we still ask it. Like that's the point I always like to make, I was like, “But you're still asking the question, it is still important to you”… I feel like I'm pretending to be ironic, but really I do wanna know. (Abby W., 27)
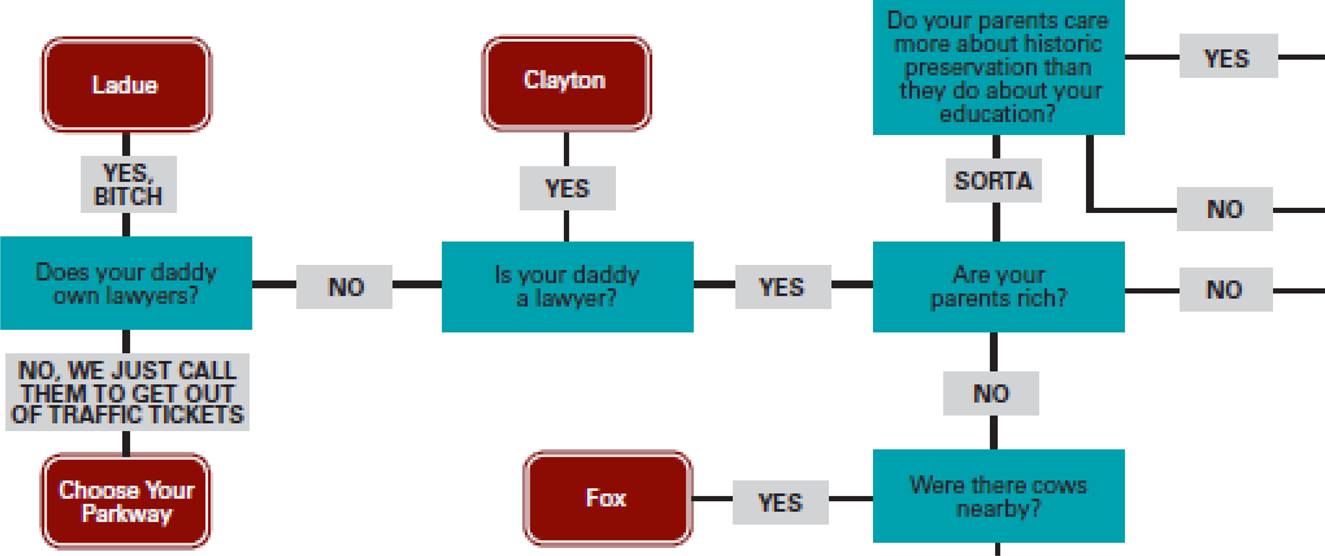
Because the high school that one attended reveals so much personal information, locals have developed stereotypes about many of the schools in the area. These can be rather fine-grained and make distinctions beyond the general types of schools outlined in Table 1. For example, the Riverfront Times once published a flow chart illustrating ‘Where you should've gone to high school’ (Levitt Reference Levitt2012). The online PDF of this flow chart is two pages long, and goes into quite a bit of detail, as seen in Figure 3.
Sample from Riverfront Times flow chart (Levitt Reference Levitt2012).

These stereotypes permeate through much of Greater St. Louis. Sitting in her kitchen in suburban St. Charles County, Katherine S. shared with me a class hierarchy of high schools that made distinctions using some of the same schools as in Figure 3.
(5) … if you went to Zumwalt North you didn't have a lot of money, your family was not wealthy. But if somebody said, “Oh I went to Parkway Central”, or you know, Lindbergh, or something, you knew that they had money… And it wasn't often that I would hear somebody say, “I went to Ladue”—because we didn't run in those circles, you know. We would never go out there—but if somebody said, “Yeah, I graduated from Ladue High School”, we knew they were rolling in it, so to speak. (Katherine S., 43)
Stereotypes of high schools in the region display what Irvine & Gal (Reference Irvine and Gal2000) call fractal recursitivity, in which social practice at one level of a scale is reproduced at a smaller level. Blommaert (Reference Blommaert2007) describes scales as a hierarchical ordering in which the meaning of a phenomenon is layered. In Greater St. Louis, we can move from the regional level to smaller levels based on various subgroupings, such as a school district, town, or religion. The above stereotypes about class, for example, are reproduced in the smaller locality of the Francis Howell School District in St. Charles County.
(6) We base like, “Oh you went to Francis Howell North, you're kind of snobby”…I think people thought, “Oh you went to Francis Howell, you're kind of hick-ville”. Like you're country folk, which really wasn't the case… But yeah, everybody that went to Francis Howell originally was from like New Melle and Defiance and Weldon Springs, which were country areas, so you know, I would go to somewhere when I was in college and someone would say, “What high school did you go to?”. And I would say Francis Howell, and they'd be like, “Oh, did you grow up on a farm?”. Like “No, I lived in a neighborhood, {LG} I have never milked a cattle”’… (Angie S., 38)
Knowledge of the stereotypes within these smaller localities is often limited to members of that locality's community. For example, Abigail B. told me how her husband introduced her to a series of stereotypes she had never heard of.
(7) My husband is Catholic… and for him that question is entirely different, because… I feel like there [are] all these different St. Louises that I didn't even know existed. Like there is a Catholic St. Louis in essence, where I mean, the SLU people… feel completely superior to those people at Vianney. And I was like, I looked at him and I was like, “Is there a difference?”. He looked at me in horror. But I mean he's like, “How do you not know that? And how do you like, not know that St. Joe's, well, you know, there's one stereotype of St. Joe's girls, but Nerinx girls, completely different”. And I'm, I'm like, “What”. {LG}. (Abigail B., 47)
The question is thus an opportunity for residents of Greater St. Louis to position themselves and situate a conversation, both within the region as a whole and within their own locality. It reflects fine-grained distinctions between social factors, and speakers take an interest in knowing and exploiting these distinctions. Because of how the question and its answer are used by locals, it would not be surprising for a locally salient category that centers on one's high school to develop for speakers in Greater St. Louis.
Catholic/Public divide
While the high school question allows for a multitude of class-based distinctions to be drawn, other divisions are categorical. For example, the question identifies if the speaker attended a religious high school. While there are several non-Catholic religious schools in Greater St. Louis, the primary division to be drawn here is Catholic/non-Catholic. I found that some older speakers who grew up in South St. Louis, a cohesive set of neighborhoods within the City of St. Louis, experienced this division to be a site of conflict that went beyond rivalry. For example, Mindy S., a Catholic, recalled her experience in (8).
(8) Just right across the street… was a public school… and when we'd get out of school, there was always a lot of yelling and hollerin’ back and forth, and uh, the nuns would always be out there… how did they, some of the nuns used to say it. “We know they're probably not going to heaven because they're not Catholic, but we don't need to treat ‘em bad.” {LG}. (Mindy S., 75)
Mindy S. provided me with the most extreme description of conflict from a Catholic perspective, but other speakers from both kinds of school also remember various conflicts and antagonistic incidents. This division, while reflecting religious practice, was explicitly tied to school; children divided themselves into Catholic and Public, rather than Catholic and Protestant. Very few speakers had friends in the other group. In fact, Rebecca M., a seventy-nine-year-old Public, experienced the groups as so separated that later in life, she found that one of her good friends, whom she had met as an adult after moving to a St. Louis suburb, was a Catholic who had grown up on her block at the same time as her. This degree of separation between groups naturally means that not every speaker experienced the Catholic/Public divide as intensely as others. For some, the divide was simply that there were separate social networks. However, the experience of separated social networks did not preclude antagonism.
(9) … We kinda just didn't really socialize with them. But I would say, yeah, I don't, really didn't feel a difference between like, magnet and public, but more parochial… Yeah, I guess they just thought they were better, they had like, you know, uniforms and morals, I don't know {LG}, God-fearing. (Gigi W., 45)
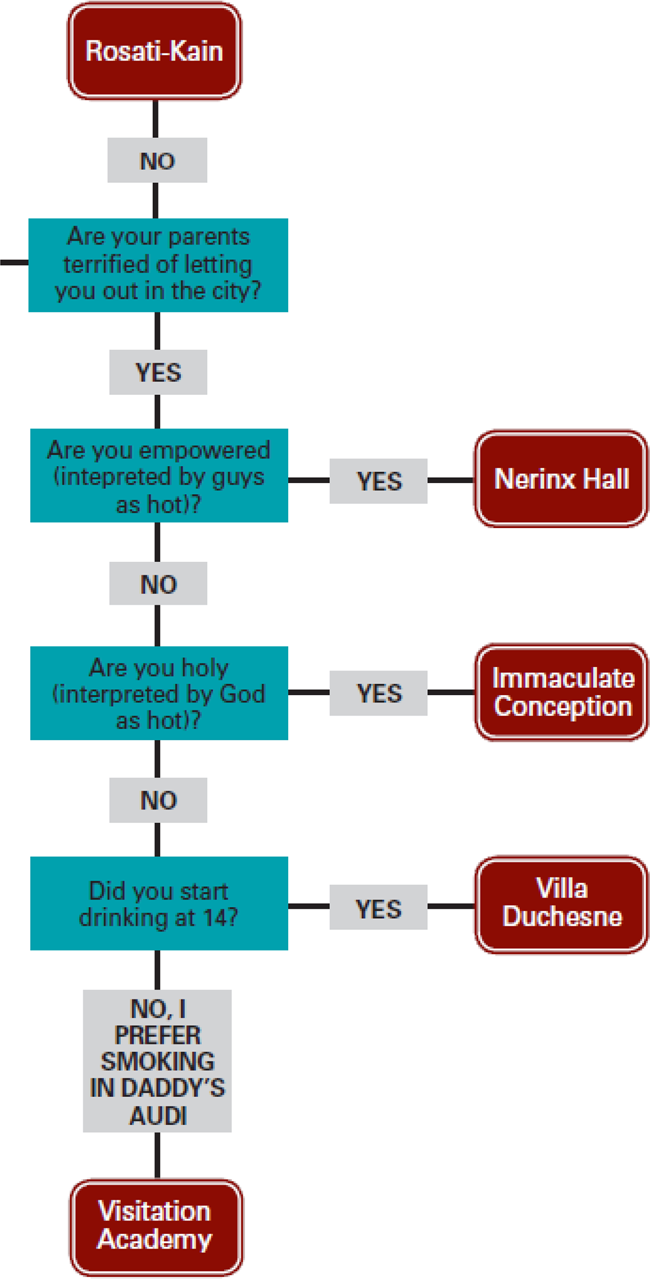
Gigi W.'s comments mark her as an exception in one important way; speakers born after 1970, as well as speakers from elsewhere in Greater St. Louis, largely do not report as strong of a divide between Catholics and Publics as the older South St. Louis speakers experienced. For them, Catholic schools are subject to the fine-grained stereotypes discussed above, but nothing more. These fine-grained distinctions, like those for public schools, are found in the Riverfront Times flow chart (Figure 4).
Stereotypes of some elite Catholic girls’ schools (Levitt Reference Levitt2012).

The Catholic/Public divide appears to have deep roots in societal structure; Emily T., a Public, recalls the anti-Catholic prejudice of her father.
(10) … That was the fear, that you would meet a Catholic boy and get serious with him, I remember that, growing up and dating and, um, kind of, you know my Dad was really strong about that, um, because, and especially when Kennedy was um, runnin’ for President, he was totally against that because he knew that the Pope was gonna be tellin’ him what to do you know, so yeah, there was a very strong division between Protestant and Catholic. (Emily T., 75)
Of the Publics, Emily T. provided me with the most extreme descriptions of the Catholic/Public divide. After recalling her father's bias, she negatively described a ‘gang’ of Catholic boys in her neighborhood before asking if I was Catholic, and upon finding out that I was, reassuring me that she had Catholic friends and that her children married Catholics.
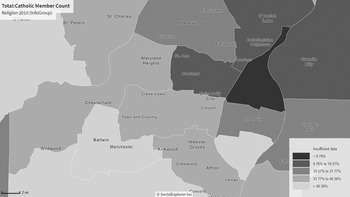
It is not altogether surprising that this divide would develop in St. Louis. The region was settled by French Catholics, and the city saw a great deal of German and Irish Catholic immigration in the nineteenth century. As a result, the city, and Greater St. Louis more broadly, are heavily Catholic. According to a 2010 survey of religious affiliation by Infogroup, Catholics make up over 40% of adherents in the region (Figure 5). While the City of St. Louis itself has a lower rate of Catholic adherence, this is due to the racial divide: whites in South St. Louis are as Catholic as the rest of the region, while blacks in North St. Louis are not.
Roman Catholic members among all congregation members in Greater St. Louis.Footnote 4

Unlike in other cities where Catholics are significantly outnumbered by Protestants,Footnote 5 in Greater St. Louis the groups are more equal in population. This could conceivably lead to a divide among residents, particularly because Catholics and Protestants were attending different schools and were part of different social networks.
Whether one's education type was Catholic or Public thus represents a locally salient category, particularly among older speakers in South St. Louis. The question, then, is whether this divide will appear in linguistic production. We have reason to believe that it could; Labov et al. (Reference Labov, Fisher;, Gylfadottír;, Henderson; and Sneller2016) find that Catholics lag in retreat from the Philadelphia short-a split and D'Onofrio & Benheim (Reference D'Onofrio and Benheim2019) find differences between Catholics and public school attendees in Chicago. More generally, Baker & Bowie (Reference Baker and Bowie2010) find differences in production of Utah English based on religious affiliation. Residents of Utah County have the low back merger, but the merged vowel is phonetically different for Mormons and non-Mormons. Furthermore, similar results regarding Catholics and Protestants are found in Northern Ireland. Milroy & Milroy (Reference Milroy and Milroy1985), for example, find that a Catholic neighborhood in Belfast lags behind Protestant neighborhoods in adoption of /a/ backing. McCafferty (Reference McCafferty1998) reviews this and other studies to show that Catholics generally lag in sound changes in Northern Ireland, not only in Belfast but in other cities like Derry/Londonderry. While the Northern Irish examples come from what are often highly segregated cities, St. Louis is religiously mixed. Some neighborhoods are predominantly Catholic or Protestant, but others have both groups. As such, any effect of education type may not solely be a finding of leading/lagging in sound change.
METHODS
Our main question in this article is whether the locally salient category of education type, expressed as Catholic vs. Public, is correlated with the linguistic production of older speakers. If it is, we should also ask whether the Catholic/Public divide persists today. The research question was investigated using informal conversation data gathered in sociolinguistic interviews. These interviews were conducted in 2017 as part of a larger project examining language variation and change in metropolitan areas. While the larger sample included speakers from throughout Greater St. Louis, I focus here on a subset of white women who grew up in South St. Louis. We examine two versions of this subset: one of solely older speakers (b. 1935–1952, n = 12), and one of speakers of all ages (b. 1935–1992, n = 17). The former version, while small, reflects a geographically and temporally coherent dataset that is consistent with the spread of the Catholic/Public divide found through the above qualitative analysis. The latter version is designed to test whether the Catholic/Public divide persisted in apparent time.
Given that the larger project yielded nearly 100 sociolinguistic interviews, the rather small amount of data used here deserves some explanation. The focus on language variation and change in metropolitan areas entailed interviewing speakers who grew up throughout Greater St. Louis. As mentioned previously, speakers from outside of the City of St. Louis did not experience the Catholic/Public divide in the same manner that speakers from the city did. Furthermore, comparatively few of the speakers who grew up outside of the city attended Catholic high schools. As such, I decided to limit the sample under investigation to only those speakers who grew up in the city. By chance, the twenty-one speakers who grew up in the City of St. Louis were evenly split along this social variable. However, because out of these twenty-one speakers, one was a black woman and three were white men, I decided to narrow the approach to an examination of white women, all of whom grew up in the South St. Louis neighborhoods, to minimize confounding variables. This sample is admittedly one of convenience, and an ideal sample would be larger and structured more evenly. I believe, however, that the sample we do have proves informative nonetheless, and it is my hope that the results outlined below may inspire a more rigorously defined future study.
Recording took place at a time and place of the participant's choosing, and averaged one hour to complete. Interviews were recorded using alternatively a Zoom H4 Handy recorder or Zoom H5 Handy recorder and Shure SM93 omnidirectional lavalier microphone, with a 16 bit, 44.1 kHz sampling rate. An undergraduate research assistant transcribed the bulk of the interviews, starting ten minutes into the recording and transcribing approximately fifteen minutes of conversation. Transcriptions were force-aligned to audio using the FAVE program (Rosenfelder, Fruehwald, Evanini, Seyfarth, Gorman, Prichard, & Yuan Reference Rosenfelder, Evanini, Seyfarth, Gorman, Prichard and Yuan2014), and formant values were subsequently extracted in 10% intervals using a Praat script. Vowel formants were Lobanov-normalized to z-scores, and then rescaled by multiplying by the mean of speaker standard deviations and adding the mean of speaker means.
Variables
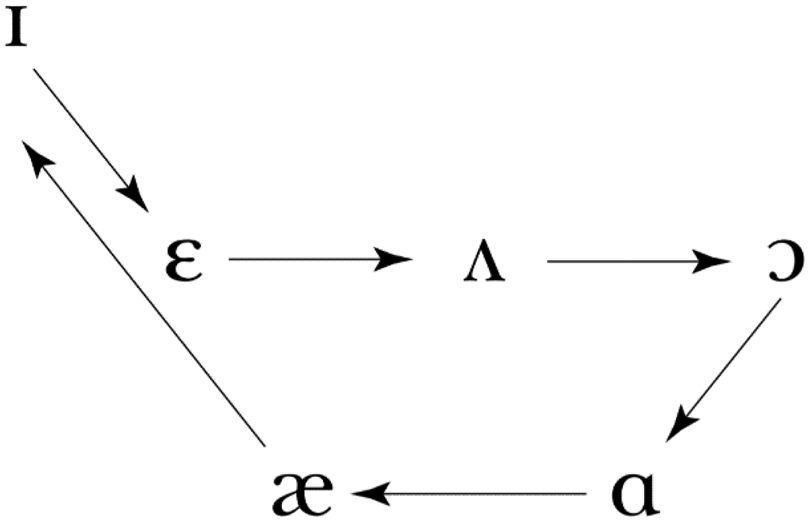
The thought, lot, and trap vowels were selected for analysis. These concern St. Louis’ adoption of the Northern Cities Shift. Goodheart (Reference Goodheart2004) and Labov et al. (Reference Labov and Boberg2006) find the NCS to be present in St. Louis, apparently having diffused there from major metropolitan areas surrounding the Great Lakes. This vowel shift involves the raising and fronting of trap, fronting of lot, lowering of thought, backing of dress, and backing of strut (Figure 6). Accordingly, I report data for F1 of thought, F2 of lot, and F1 of trap (focusing here on the raising of the vowel).
The Northern Cities Shift (Gordon Reference Gordon2001:197, adapted from Labov Reference Labov1994:191).

The trap vowel is quite distinct phonetically from other variants of trap. The vowel is described as tensed, and is often diphthongized in a manner that Labov et al. (Reference Labov and Boberg2006:176) call Northern Breaking. In this production, a raised front vowel onset then inglides to a central target. The NCS vowel thus approximates [ɛə] or [ɪə], compared to the standard [æ] or backed [a] seen in the California Vowel Shift (Kennedy & Grama Reference Kennedy and Grama2012). NCS trap patterns differently from other dialects in terms of phonological conditioning as well. Tensing is phonetically, and often phonologically, conditioned in many dialects of English, whether in a complex split based on voicing, manner of articulation, and syllable structure (New York: Becker Reference Becker2010; Philadelphia: Labov et al. Reference Labov, Fisher;, Gylfadottír;, Henderson; and Sneller2016), or in a nasal system that tenses only before front nasals. By comparison, the NCS system tenses in all environments.
The low back vowels lot and thought can be described in a comparatively straightforward manner. In much of North America, including most of Missouri (Majors Reference Majors2005), lot and thought are undergoing or have undergone merger. Speakers with the NCS are one of the major groups said to be resisting the Low Back Merger due to the fronting of lot keeping the vowels distinct. Indeed, Majors (Reference Majors2005) finds that the only part of Missouri without this merger is Greater St. Louis.
Coding
Speakers were coded for their education type. Here I treat Catholic/Public as a binary variable. Although there is also an elite/nonelite distinction in schooling, there are too few speakers from elite schools (n = 1) to make the distinction in our analysis. Coding is additionally complicated by the fact that one speaker attended a non-Catholic private school. Rather than exclude her, I consider this speaker to be a Public; the above qualitative analysis of the Catholic/Public divide indicated that it is more of a Catholic/non-Catholic divide than anything else. While it is not the primary focus of this article, I also code for social class due to its well-known correlation with linguistic variation. Because occupation is the best available variable for approximating social class (Baranowski & Turton Reference Baranowski and Turton2018), I operationalize class by coding speakers based on their occupation, following the approach outlined in Baranowski (Reference Baranowski2017). As most speakers were either lower-middle or middle-middle class under this approach (one, a telephone lineperson, was upper-working class), I condense the factor into a binary variable of working/lower-middle class vs. middle-middle class.
For the sample of older speakers, I additionally code for their current residence. Because White Flight decimated the population of the City of St. Louis, many interviewees who grew up in the city now reside elsewhere in Greater St. Louis. As such, we might expect to encounter an effect of contact with nonurban speakers on the basis of residence (Duncan Reference Duncan2018). This variable is unfortunately highly skewed and represents a major confound for this work; as it turns out, every Public included in the sample moved to the suburbs later in life, while only one Catholic did. This is particularly problematic because the categories speak to two different processes of acquiring variation patterns. An education type effect would most likely have been learned during school years, while a current residence effect would probably be the result of lifespan change due to dialect contact (Duncan Reference Duncan2018). It is vital, then, to disambiguate these effects as much as possible. Visual exploration of the data and model comparison can assist us in disambiguating any effects of education type or current residence, but it should be noted that our conclusions by necessity will be quite tentative as they heavily rely on the linguistic behavior of the one Catholic who moved to the suburbs. If she clearly patterns with other Catholics, we will have evidence for an education type effect, while if she clearly patterns with the Publics we will have evidence for a current residence effect.
Lot and thought are measured at 40% of the vowel, and tokens were coded for phonological environment. I follow Baranowski's (Reference Baranowski, Bayley, Cameron and Lucas2015) observation that nasals and /l/ can result in raised and retracted tokens, particularly in the case of the low back vowels, and code the following consonant as a nasal (don/dawn), /l/ (doll/tall), or obstruent (cot/caught). I also consider syllable structure in pre-/l/ contexts, and code for an open or closed syllable in this environment (i.e. doll vs. dollar). Because the trap vowel is often found to be a diphthong among NCS speakers (Labov et al. Reference Labov and Boberg2006), I use the measurement of trap at 20% of the vowel duration in order to measure late enough in the vowel to avoid co-articulatory effects, but early enough to pre-empt the inglide, if any. The height of the NCS trap vowel is sensitive to the following consonant (Callary Reference Callary1975; M. Gordon Reference Gordon2001; Goodheart Reference Goodheart2004; inter alia). I follow M. Gordon (Reference Gordon2001) and Goodheart (Reference Goodheart2004) in coding for voicing (voiced as in bad, voiceless as in bat), place of articulation (coronal as in bat, labial as in apple, dorsal as in back), and manner of articulation (nasal as in ban, stop as in bad, fricative as in bath, /l/ as in ballot). I treat affricates as stops for the purposes of this analysis.
RESULTS
Linear mixed effects regression models (Bates, Mächler, Bolker, & Walker Reference Bates, Mächler, Bolker and Walker2014) were used to model the effects of linguistic and social factors for each vowel. I ran two initial models, one with education type as an independent variable, and one with current residence. As speaker membership in the two variables substantially overlaps, it was not possible to include them in a single model. In the initial models, speaker and lexical item were included as random effects, while the phonological conditioning factors and social factors of education type/current residence, speaker age, and occupational level were included as fixed effects. Based upon exploratory visual inspection (not reported here), I also include potential interactions between the social and linguistic factors in the initial model where appropriate. I then used the step function in R (R Core Team 2017) to select variables included in a final model via an automatic stepdown process. Although this was not a predetermined outcome, for each vowel this process yielded two models that had identical independent variables (outside of education type/current residence). The fit of the two models was then compared using AIC. When two models of the same data are compared, the difference in AIC between models corresponds to the relative likelihood of the higher-AIC model being a better fit for the data than the lower-AIC model. A greater difference yields a lower relative likelihood, which indicates the lower-AIC model should be selected over the other.
Catholic/Public divide for older speakers
The first set of speakers we consider is designed to be a relatively synchronic sample of speakers from South St. Louis that are split between Catholics and Publics. Twelve speakers born between 1935–1952 are included in the sample. The sample is crossed for occupational level and type. Although I acknowledge that this results in a low n per cell (Table 2), the sample size is justified by our primary focus on education type. While potential effects of class should be considered, we in fact do not find any effect of occupational level on the data under discussion. There are 540 tokens of thought, 737 of lot, and 724 of trap.
Distribution of speakers by occupational level and education type.

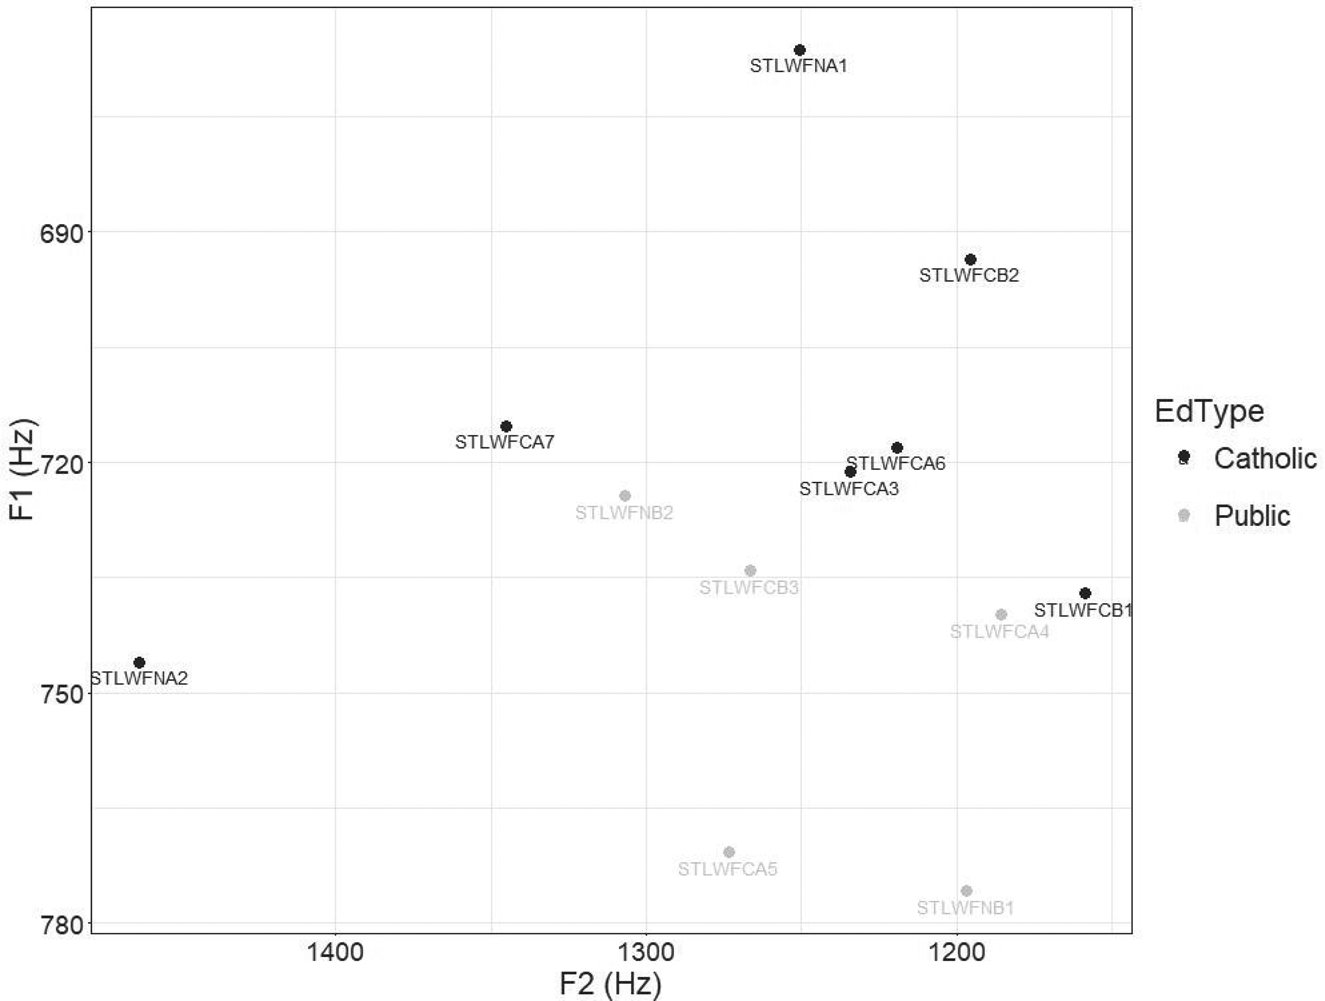
Figure 7 shows that on an individual basis, most Publics have a lower thought vowel (higher F1 value) than Catholics. Further visual examination suggests that this is indeed an effect of education type rather than of current residence. The Catholic who moved to the suburbs, labeled as STLWFCB2 on the figure, has the second-highest thought vowel (second-lowest F1 value) of all speakers, approximately 30 Hz higher than the highest Public thought vowel. Because STLWFCB2 and all Publics comprise the speakers who moved to the suburbs later in life, we can see that grouping speakers together on the basis of residence has a greater variance than grouping them by education type. Visual examination provides another kind of evidence for an education type effect as well: based on the content of the sociolinguistic interviews, Mindy S. (labeled as STLWFNA1) and Emily T. (labeled as STLWFCA5) appeared to have the strongest connection to the Catholic/Public identity, as of the speakers in the sample they spoke the most of fights between group members and bias against the other group (see (8) and (10) above). We can see from Figure 7 that Mindy S. has the highest thought vowel of all speakers, while Emily T. has the second-lowest. The extreme opposition they constructed in their interviews is thus reflected in their extreme opposition in thought production.
thought-lowering by education type.

The models for F1 of thought selected by step included phonological environment and education type/current residence as fixed effects, and additionally selected both speaker and lexical item as random effects.Footnote 6 Occupation level and speaker age were eliminated from both models by step, suggesting that neither play a role in thought production within the sample. In the model including education type, all speakers have a relatively low thought (β = 732.31, p << 0.0001), with pre-/l/ tokens in closed syllables slightly raised (β = -43.23, p = 0.0002). Publics have a significantly lower thought than Catholics (β = 39.30, p = 0.0207). This differs from the model including current residence, in which phonological environment, but not residence, has a significant effect of production. Given that visual inspection suggested an increased variance when grouping speakers by current residence, the lack of such an effect is not surprising. Model comparison using AIC shows the education type model to be a better fit for the data than the residence model (Education Type: 6342.6; Residence: 6356.6; relative likelihood: 0.0009).
The available quantitative evidence suggests that in this sample, there is a difference in thought production based on the type of high school that speakers attended. It is important to note, that this finding is in no small part based on the language use of one speaker. If STLWFCB2 had a lower thought vowel, there may well have been a significant effect of current residence, and AIC may not have so clearly distinguished between the two models in terms of fit. Nonetheless, in the absence of further evidence we tentatively conclude the education type effect to be real for this vowel.
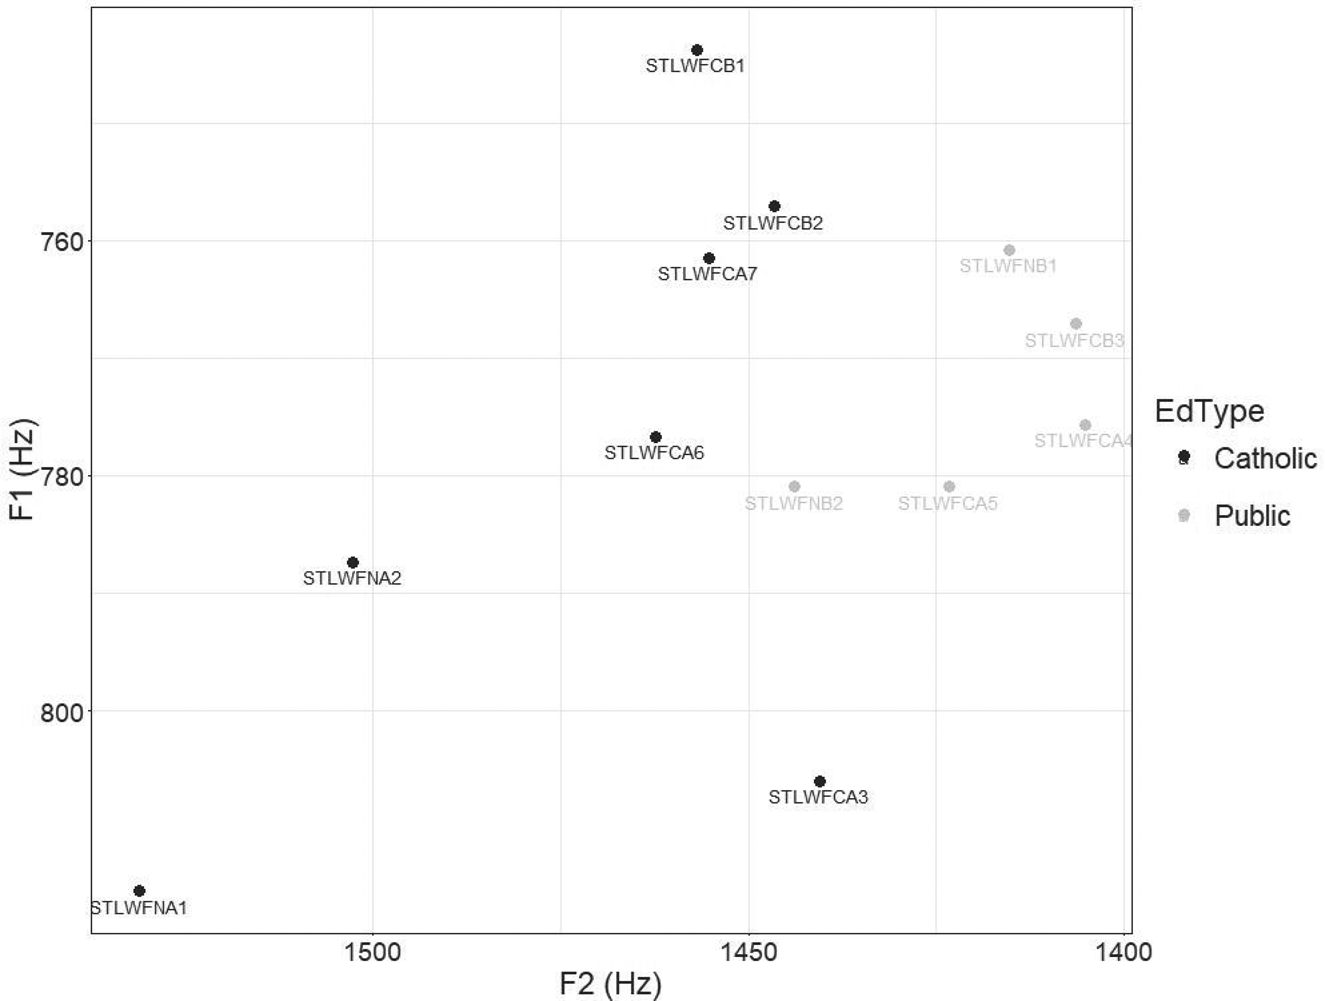
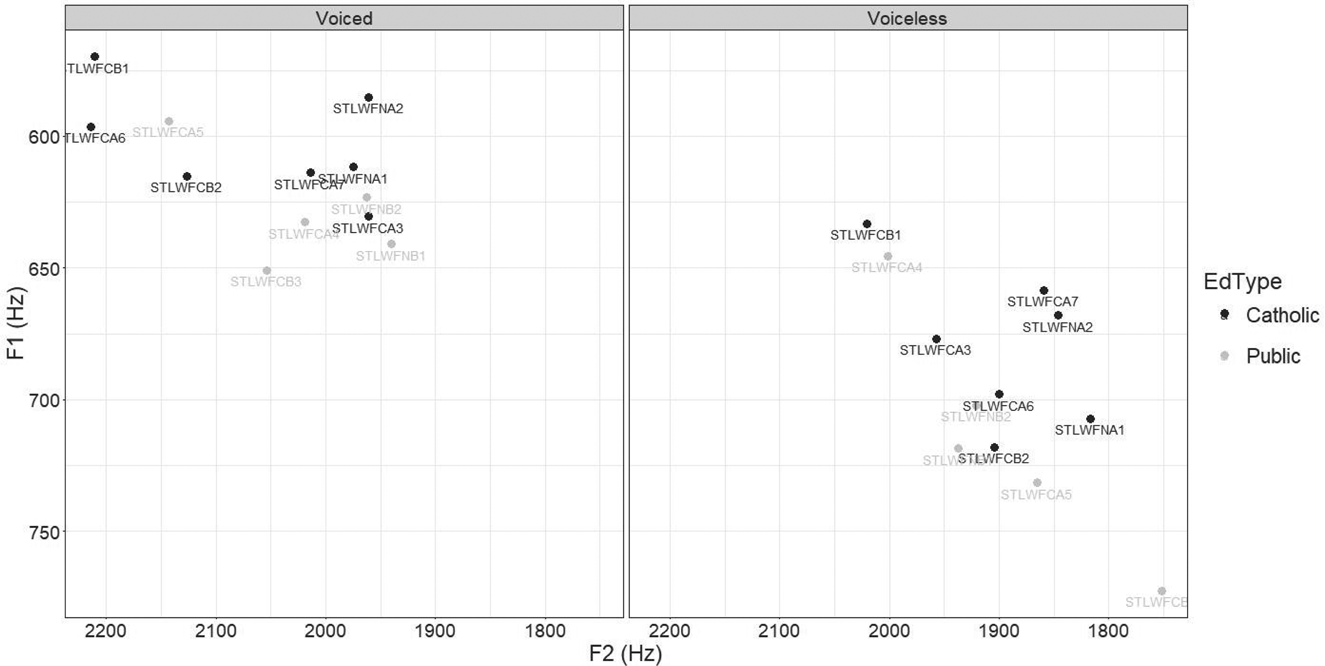
Unlike the thought vowel, the other NCS vowels under consideration do not conclusively point to an education type effect. Figures 8 and 9 illustrate this. In Figure 8, we see that Catholics may have a fronter vowel (higher F2 value) than Publics do. However, STLWFCB2, the Catholic who moved to the suburbs, has the second-backest lot among Catholics, and could conceivably be grouped together with the Publics based on current residence. Figure 9, which shows trap production when preceding a voiced or voiceless consonant, is similar. Catholics may have a higher vowel (lower F1 value) than Publics in prevoiced contexts, but STLWFCB2 could again be potentially grouped with the Publics based on current residence. Visual inspection is thus inconclusive as to whether an education type effect or residence effect is a better fit for the data.
lot-fronting by education type.

Catholics’ and Publics’ trap vowel by voicing.

Unsurprisingly, models including either education type or current residence are quite similar for both vowels. For lot, step selected speaker and lexical item as random effects, and education type/current residence alone as a fixed effect. Again, occupation level and speaker age were eliminated, suggesting that they do not play a role in lot-fronting in this sample. Education type and residence both have significant effects on production (β = -46.06, p = 0.0480; β = -49.80, p = 0.0252, respectively), but AIC does not distinguish between the two models (Education Type: 9635.9; Residence: 9634.6; relative likelihood: 0.522). Therefore, we are not able to quantitatively show one model to be a better fit for the data than the other.
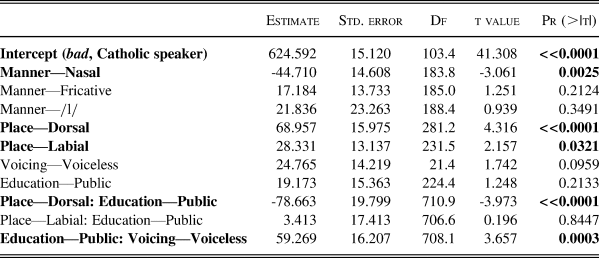
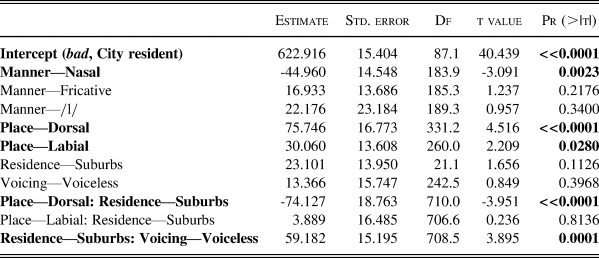
For trap, exploratory visual inspection suggested that the voicing and place of articulation of the following consonant may interact with social factors. As such, the initial models submitted to step included both phonological environments and social factors as main effects and interactions between voicing/social factors and place of articulation/social factors. The function selected speaker and lexical item as random effects; manner of articulation, place of articulation, and voicing of the following consonant as fixed language-internal effects; and education type/current residence and their interaction with voicing and place of articulation as additional fixed effects. As in the case of thought and lot, occupational level and speaker age were eliminated from the final model. Tables 3 and 4 show that the models are quite similar, and AIC suggests the same (Education Type: 8550.3; Residence: 8548.4; relative likelihood: 0.387). It is again inconclusive whether an education type effect or residence effect is a better interpretation of the data.
Education type effect and linguistic factors conditioning F1 of trap, South St. Louis speakers born 1935–1952.

Current residence effect and linguistic factors conditioning F1 of trap, South St. Louis speakers born 1935–1952.

In sum, we find an effect of education type for all three of the vowels under consideration. In total, these effects are surprising; evidently Catholics are more advanced in two NCS stages, while Publics are more advanced in the other. However, only in the case of the thought vowel does all of the quantitative evidence point to a conclusion that education type conditions variation. Rather than speculate as to the reason for the ‘surprising’ pattern, I set it aside as a potential artifact of the unfortunate confound between education type and current residence. The ‘surprising’ result instead indicates the need for the intentional sampling of a larger group of speakers that clearly targets the Catholic/Public divide. That said, the results we have obtained with the small sample here are still suggestive of an education effect for thought, and those results are worthy of discussion. Moving forward, I focus on the thought vowel as a single feature that does appear to show this effect.
Catholic/Public divide in South St. Louis over time
Given that education type is correlated with production in a relatively synchronic sample, we are interested in whether this pattern holds over time. I test this on thought production in a larger sample of speakers. All (n = 17) are white women raised in South St. Louis and born between 1935 and 1992. This larger sample has an increased token count (n = 776). The sample maintains a relatively even distribution of Catholics and Publics across occupational levels (Table 5), although n's per cell are still low.
Distribution of speakers by occupational level and education type, expanded sample.

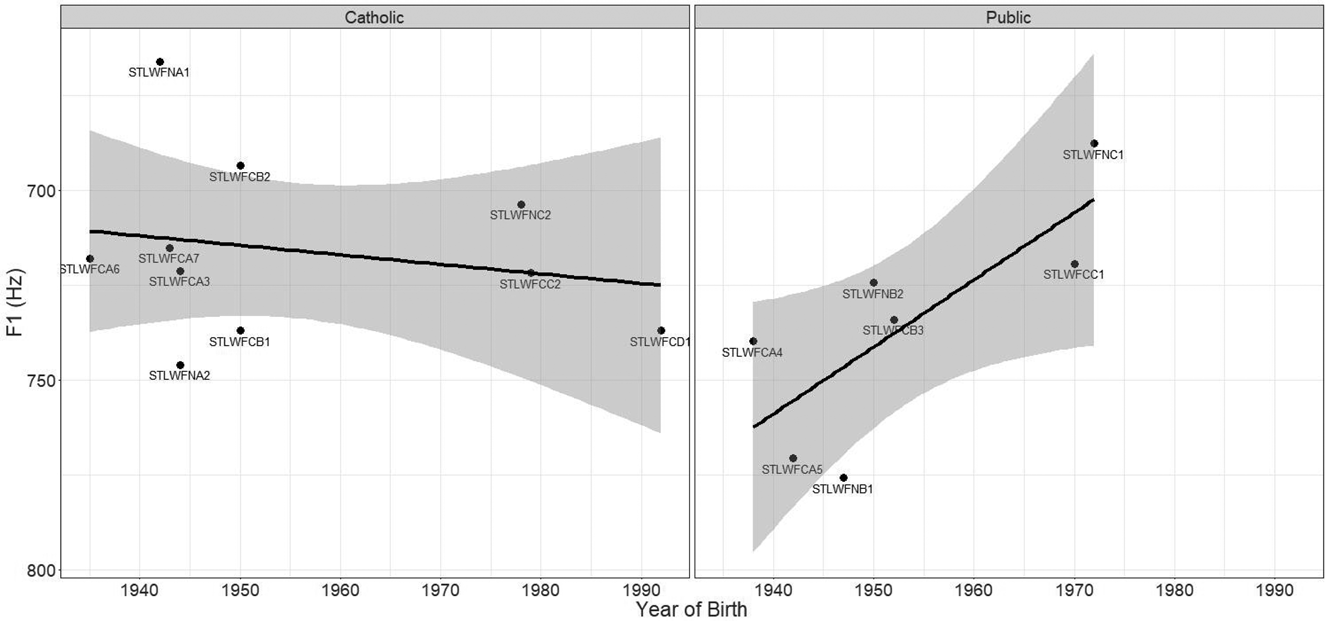
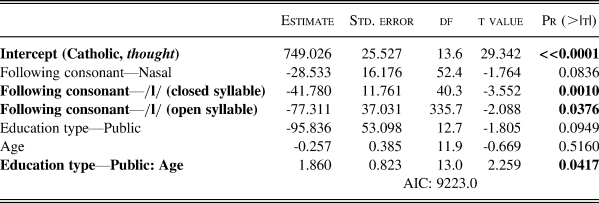
Figure 10 shows that the difference between Publics and Catholics disappears in apparent time. While production of thought appears to be stable for Catholics, Publics appear to raise the vowel in apparent time to match the production of the Catholics. This finding is maintained in our regression model. The initial model submitted to step for this expanded sample included speaker and lexical item as random effects, and following phonological environment, education type, occupational level, speaker age, and an interaction between speaker age and education type as fixed effects.
Change over time of Catholics and Publics’ thought vowel, expanded sample.

The final model selected by step included all factors except for occupational level (Table 6). As seen, the intercept has a higher value (representing a lower vowel) than in the synchronic sample (749.03 Hz vs. 732.31 Hz). The finding of a higher vowel when preceding /l/ in closed syllables is maintained, while /l/ in open syllables now also corresponds to a higher vowel. The main effect of education type is no longer significant in the expanded sample, but there is a significant interaction between speaker age and education type such that older Catholics and Publics have a larger difference in F1 than younger Catholics and Publics. The data is thus consistent with a historical effect of education type that has been subsequently lost. Important to note is that the education type effect was lost by Publics raising their vowel to match the Catholics, rather than the other possibility of the Catholics lowering their vowel to match the Publics.
Education type effect and linguistic factors conditioning F1 of thought, expanded sample.

DISCUSSION
That we find an effect of education type in a sample of older interviewees, but not the larger sample of South St. Louis interviewees, should raise concerns that the result is a false positive. I do not believe this is the case; as illustrated previously, the Catholic/Public divide was most salient for precisely the speakers who display linguistic differences based on that divide. It is not problematic to find that if a category loses its salience for speakers it will cease to be a social factor that influences variation.
The question, then, is how to explain the effect that we find. Because Publics have a lower, and therefore more NCS-like, thought vowel than Catholics, we may expect that they were leading the Catholics in change. This would possibly be in line with what Labov et al. (Reference Labov, Fisher;, Gylfadottír;, Henderson; and Sneller2016) find with the Philadelphia short-a system; the groups have differing social networks, and the group with the more diffuse social network leads change. However, a key difference between this study and that of Labov et al. (Reference Labov, Fisher;, Gylfadottír;, Henderson; and Sneller2016) is that the older Publics in this study attended neighborhood public schools with open admissions. To claim that the school system with the more diffuse social network led change is thus to claim that any public school will have a more diffuse social network than a parochial Catholic school. This does not strike me as inconceivable—a parochial school may draw from a smaller geographical footprint than a neighborhood public school and any network within it would theoretically be multiplex—but I do not believe we have enough information to know this for sure. There are additional reasons why a conclusion of Catholics lagging is problematic. For one, there was no age effect in the sample of older speakers. If one group was leading the other in thought-lowering, we would expect to find a main effect of speaker age. Instead, this variable was eliminated entirely from our model by step. Furthermore, if Catholics were lagging in change, we would expect to find our apparent time loss of the education type effect to be caused by Catholics lowering the vowel. We instead find the opposite. For these reasons, it does not appear that our finding can be entirely attributed to the role of social networks in language change.
I argue that the variation we see between Catholics and Publics rather represents the use of linguistic features to index social practice (Eckert Reference Eckert2008). I see the disappearance of the education type effect among younger speakers as evidence of this. Speakers only used linguistic production to index a social identity while that identity was highly salient, and when the salience lessened, such use lessened. This means, as Hall-Lew (Reference Hall-Lew2017) argues, that changes in societal structure are reflected in changes in linguistic variation patterns. A useful way to think about this is Brubaker's approach to groups not as fixed categories, but as a ‘contextually fluctuating conceptual variable’ (Reference Brubaker2004:11). For Brubaker, groups are constituted not as categories, but rather through events, actions, and the like. These lead to a sense of groupness crystallizing among members. In this sense, while we can categorize speakers by which secondary institutions they attended, these categories do not in and of themselves constitute groups that bear social meaning. Rather, speakers attending Catholic schools and speakers attending public schools become ‘Catholics’ and ‘Publics’ through events and actions that crystallize a feeling of groupness. We encountered this sense of groupness among older St. Louisans, and found that synchronic variation indexed the social meaning of such groupness. This means that the weakening of the education type effect would reflect a weakened sense of groupness; we still have the categories of speakers attending Catholic schools and speakers attending public schools, but they are no longer ‘Catholics’ and ‘Publics’ in the same way as before. The question, then, is what events or actions have contributed to diminished groupness in St. Louis.
I suggest that two processes contributed to diminished groupness among Catholics and Publics in St. Louis. The first is Vatican II. This was a series of meetings between 1962 and 1967 which resulted in the Catholic Church making several liberal reforms. Such reforms paved the way for interfaith work with Protestant sects, and enabled the integration of Catholics and Protestants, including in schools. For example, when Catholics and Protestants married prior to Vatican II, the ceremony was required to occur in a Catholic Church and the couple was required to raise their children in the Catholic faith. This practice declined after Vatican II. Could this liberalization have actually resulted in changes in linguistic practice in St. Louis? Stern's (Reference Stern1979) study of Catholic parish bulletins suggests that it is possible. Stern found that compared to usage before Vatican II, Catholics after Vatican II used religious lexical items that more approximated Protestant lexical items.
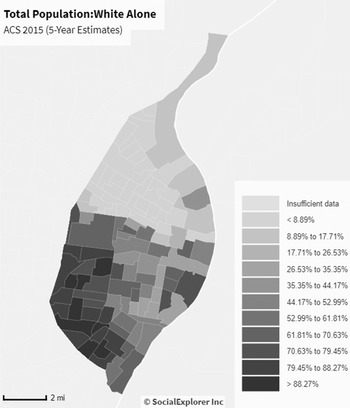
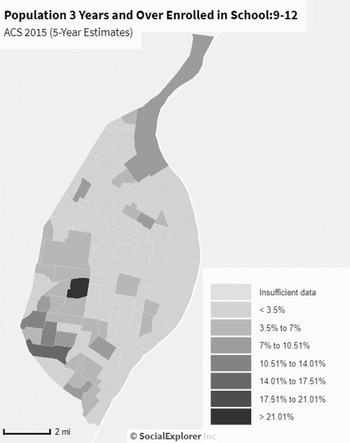
Vatican II by itself does not seem sufficient for decrystallizing the groupness of education type in St. Louis, as the question of where one attended high school still reveals religion and speakers still carry stereotypes about Catholic schools. Vatican II has thus not eliminated speakers’ attention to religion. I suggest that a more important role was played by White Flight to postwar suburbs. While race has always carried a high degree of groupness in Greater St. Louis, prior to WWII the St. Louis Real Estate Exchange created a ‘steel ring’, within which realtors would sell or rent houses to African Americans and outside of which realtors faced censure for renting or selling to African Americans. The ‘steel ring’ kept the city segregated (C. Gordon Reference Gordon2008) and schools too were segregated as a result of the residential segregation. During the same period that school desegregation created the potential for mixed social networks, massive White Flight to the suburbs depleted the urban core. White Flight from St. Louis Public Schools was more dramatic. While the population of the city was 49.2% African American and 43.9% white in 2010 (United States Census Bureau 2010), SLPS students were 82.3% African American and 11.7% white in 2013. These numbers suggest that a large number of white students are missing from the public schools. This is in fact the case: if we look at the 2015 racial breakdown of the city by census tract, we see that the whitest tracts generally match the census tracts with the most students in private (including Catholic) schools (Figures 11–12). Figure 11 shows that the whitest census tracts are in southwest St. Louis, while Figure 12 shows that the census tracts with the most students enrolled in private schools are also in southwest St. Louis. It is likely that many of these white students are in Catholic schools; archdiocesan schools were 87.0% white in 2012 (Phillips & Delaney Reference Phillips and Delaney2017).
White population by census tract in City of St. Louis.Footnote 7

Private high school enrollment by census tract in City of St. Louis.Footnote 8

These demographic changes mean that to the extent that there is a Catholic/Public divide in St. Louis, it falls along racial lines now. As such, by emphasizing the groupness of race, White Flight resulted in the decrystallization of the groupness of Catholics and Publics. This mirrors Lipsitz's (Reference Lipsitz1995) argument that white ethnics in suburbs gave up ethnic distinctions in order to exclude African Americans from their neighborhoods. We see in St. Louis that this is the case for religious groups as well. Strikingly, this is the case not just for suburban development, but for the depleted urban core left behind. This suggests that postwar suburbanization affected patterns of linguistic variation in the city that residents left behind.
Brubaker's view of groupness as crystallized by events and actions additionally makes predictions about which speakers will use a particular variant. While at a neighborhood level groupness may be crystallized for the entire population, individuals have their own experience of events and actions. It follows that some individuals will have experiences that lead them to develop a heightened sense of belonging to a group, while others’ experiences will lead to a lessened sense of belonging. When using a linguistic feature that indexes social identity, we would thus predict that individuals with a higher sense of groupness will use the feature more than speakers with a lesser sense of groupness.
We found exactly that in our data. Recall that for many speakers, the Catholic/ Public divide was simply a function of attending different schools. Of the speakers included in this study, Mindy S. and Emily T. spoke the most of events and actions like fights that crystallized a distinction between Catholics and Publics. Qualitatively, we can therefore describe them as the Catholic and Public with the most heightened senses of groupness. The prediction would thus be that Mindy S. will have quite a high thought vowel, while Emily T. will have quite a low one. We previously found this to be the case; Mindy S. is the speaker with the highest thought vowel, while Emily T. has the second-lowest vowel, which is well lower than any Catholic's vowel. This means that the speakers for whom the Catholic/Public divide is most extremely crystallized are the speakers who have the most extreme production of the thought vowel. This is further evidence of the utility of Brubaker's concept and, more specifically, that the variation we see in the thought vowel reflects the use of linguistic features to index social identity.
CONCLUSION
The high school one attends is important for social identity and social interactions in Greater St. Louis. One large divide that arose from that for older speakers in South St. Louis was into Catholics and Public. This divide has lessened in recent decades, although the school rivalries and stereotypes persist. Linguistic practice matches this social history, as older South St. Louis speakers, but not younger speakers, vary in production of the thought vowel based on the type of education they received. I attribute this shift to a combination of influences from the Vatican II reforms, as well as postwar suburbanization in the form of White Flight from public schools in St. Louis and the city more generally.