Introduction
There is compelling evidence that physical activity in advanced age is associated with both mental health (Netz et al., Reference Netz, Wu, Becker and Tenenbaum2005; Heesch et al., Reference Heesch, Burton and Brown2011) and cognitive functioning (Lautenschlager et al., Reference Lautenschlager2008; Xu, et al., Reference Xu, Jiang, Lam, Zhang, Thomas and Cheng2011). It may have physiological effects, such as changes in endorphin and monoamine levels or reduction in the levels of the stress hormone cortisol (Duclos, Reference Duclos, Gouarne and Bonnemaison2003), which all may improve mood. It may also increase neurotransmitters and growth factors (Tang et al., Reference Tang, Chu, Hui, Helmeste and Law2008), which improve cognitive functioning.
However, it is not clear to what extent this association is dose-dependent. For example, a meta-analysis exploring the effect of physical activity on well-being in older adults concluded that moderate exercise intensity was more beneficial than high intensity, and the impact of frequency was not consistent across the well-being measures (Netz et al., Reference Netz, Wu, Becker and Tenenbaum2005). Inconsistent results were also demonstrated in an epidemiological study examining the interaction between amount and intensity of physical activity and quality of life in old age. While significant dose–response relationships were indicated for vitality and mental health, these relationships were not significant for general health, social functioning, and emotional limitations (Aoyagi et al., Reference Aoyagi, Park, Park and Shephard2010).
On the other hand, two epidemiological studies indicated a dose–response relationship between physical activity and mental health – one in older women (Heesch et al., Reference Heesch, Burton and Brown2011), and the other in a Scottish national survey of adults of all ages, including older adults (Hamer et al., Reference Hamer, Stamatakis and Steptoe2009). Concerning cognition, two intervention studies examined the effect of physical activity on the rate of cognitive decline among older adults with mild cognitive impairment. One study informed modest improvement in cognition following a moderate-intensity program of home-based physical activity (Lautenschlager et al., Reference Lautenschlager2008), and the other showed significant improvement, especially in women, following high-intensity aerobic exercise (Baker et al., Reference Baker2010). Another intervention study conducted on healthy older adults indicated that intensive aerobic training may reduce the progression of age-related cognitive decline (Muscari et al., Reference Muscari2010). In epidemiological studies, one study indicated a clear dose–response relationship between physical activity and cognitive functioning (Xu et al., Reference Xu, Jiang, Lam, Zhang, Thomas and Cheng2011). Another study demonstrated an association between physical activity and a lower likelihood of cognitive impairment; however, this association was dose-independent (Middleton et al., Reference Middleton, Barnes, Lui and Yaffe2010).
Official health organizations, that felt it was necessary to establish clear guidelines in terms of the dose of physical activity needed for preserving both physical and psychological health in old age, determined an optimal, single dose of physical activity, claiming that “It is not yet possible to describe in detail exercise programs that will optimize physical functioning and health in all groups of older adults” (American College of Sports Medicine – ACSM, 2009, p.1523). Briefly, they recommend moderate-intensity activity for at least 150 min or 75 min of vigorous-intensity aerobic activity, or an equivalent mix of moderate- and vigorous-intensity aerobic activity, per week (for details see ACSM, 2009).
In this study we explored to what extent physical activity, as recommended by these guidelines, is associated with mental health and cognitive functioning. Mental health in the present study was assessed by the 12-item General Health Questionnaire (GHQ; Goldberg et al., Reference Goldberg1997) and cognitive functioning by the Mini-Mental State Examination (MMSE; Folstein et al., Reference Folstein, Folstein and McHugh1975). Both questionnaires have been widely used for assessing mental health (Hamer et al., Reference Hamer, Stamatakis and Steptoe2009) and cognitive functioning (Muscari et al., Reference Muscari2010) in relation to physical activity. Our study is innovative in examining, in a national population study, whether the differentiation of people based on the recommended single gross criterion was associated with mental health and cognitive functioning. More specifically, we explored whether differentiating people on that single criterion of physical activity accounted for the variance of mental health and cognitive functioning, independently of demographic and health variables known to be associated with physical activity in this population (see Netz et al., Reference Netz, Goldsmith, Shimony, Ben-Moshe and Zeev2011). Our study is also innovative in relating physical activity to two separate dimensions of mental health – positive and negative, as was suggested in previous studies analyzing the use of the GHQ (Duncan-Jones et al., Reference Duncan-Jones, Grayson and Moran1986; Andrich and Van Schoubroeck, Reference Andrich and Van Schoubroeck1989).
Methods
Participants
The study is a part of the Israel National Health and Nutrition Survey (“Mabat Zahav”), which included Israeli citizens from both the Jewish and Arab sectors, aged 65 years and over, living in the community (e.g. their own homes or sheltered housing), and residing in the country for at least one year. The study was approved by the Ethics Committee of the Chaim Sheba Medical Center and the Ministry of Health. More details on the sampling procedure, recruitment of interviewees, and data collection have been described previously (Netz et al., Reference Netz, Goldsmith, Shimony, Ben-Moshe and Zeev2011).
Exclusion criteria
Older adults with significant cognitive reduction were excluded. Cognitive assessment was carried out using the MMSE (Folstein et al., Reference Folstein, Folstein and McHugh1975). Previous studies indicated that persons with a score of 12 or more are able to respond consistently to questions about preferences or choices, and to provide accurate and reliable responses to questions about demographics (Feinberg and Whitlatch, Reference Feinberg and Whitlatch2001). Moreover, a recent study indicated that cognitively impaired individuals with a mean score of 20.2 (±2.5) on the MMSE were able to provide reliable and valid information on their physical activity habits (Hauer et al., Reference Hauer, Lord, Lindemann, Lamb, Aminian and Schwenk2011). Nevertheless, because of doubt as to the reliability of the answers, for the purposes of the present study, participants with a score of less than 17 on the MMSE, which is considered the cut-off point between mild and severe cognitive impairment (Tombaugh and McIntyre, Reference Tombaugh and McIntyre1992), were excluded from the study.
Assuming that functional limitations may cause difficulties in performing certain physical activities, for the purposes of the present study, elderly persons with significant functional limitations were also excluded from the study. Significant functional limitations were determined as the inability to perform one or more of the following activities of daily living (ADL): dress, shower/bathe, sit down and rise from a chair, eat, and go to the bathroom (Katz et al., Reference Katz, Ford, Moskowitz, Jackson and Jaffe1963). Participants who were unable to perform one or more of the above were excluded.
Of those who were interviewed (1,852 participants), 189 were excluded based on their cognitive functioning (N = 46) or physical functioning (N = 136), or for missing data (N = 7), leaving a total of 1,663 participants. Due to administrative reasons, scores for the GHQ were missing for another 248.
Demographic and health evaluation
A face-to-face personal interview was conducted in the interviewee's home using a structured questionnaire. The questionnaire was written in Hebrew and translated into Russian, Arabic, and English. Education was coded as the number of school years, and level of religiosity as religious or secular. Income was given in Israeli currency (NIS – New Israeli Shekels). Medications were coded using the Anatomical Therapeutical and Chemical (ATC) system, developed by the World Health Organization (WHO, 2011), and the number of medications (prescriptions) was recorded. The chronic illnesses list included nine illnesses/conditions: heart disease, lung disease, stroke, renal disease, cancer, diabetes, hypercholesterolemia, hypertension, and osteoporosis. The number of illnesses/conditions for each participant was recorded.
Assessment of mental health
The GHQ (Goldberg et al., Reference Goldberg1997) is a measure devised for population studies. The questionnaire enquires about the general level of happiness, experience of depressive and anxiety symptoms, and sleep disturbance in recent times. It consists of 12 items, each assessing the intensity of the symptoms/feelings on a four-point Likert-type scale, as follows: not at all = 1, same as usual = 2, more than usual = 3, and much more than usual = 4.
The GHQ is a highly validated instrument and has been strongly associated with various psychological disorders, such as depression and anxiety (Goldberg et al., Reference Goldberg1997). The research literature has provided support for a one- (Hankins, Reference Hankins2008) or two-factor structure underlying the GHQ items (Andrich and Van Schoubroeck, Reference Andrich and Van Schoubroeck1989; Kalliath et al., Reference Kalliath, O'Driscoll and Brough2004). In Israel, it has been used in epidemiological studies assessing mental health of different ages including older adults (Shemesh et al., Reference Shemesh, Kohn, Blumstein, Geraisy, Novikov and Levav2006). In these studies, it was measured as a single dimension of psychological health.
Assessment of cognitive functioning
The MMSE is a 30-point test of global cognitive status that evaluates orientation to time and place, registration and recall of three words, attention/calculation, language ability, visuospatial ability, and the ability to follow instructions (Folstein et al., Reference Folstein, Folstein and McHugh1975). It has proved to be a reliable and valid indicator of cognitive impairment (Tombaugh and McIntyre, Reference Tombaugh and McIntyre1992), including in Israeli population (Werner et al., Reference Werner, Heinik, Mendel, Reicher and Bleich1999). While originally the MMSE was created for clinical use or as a screening test, it has also been widely used as an outcome measure, including in studies assessing the relationship between physical activity (Middleton et al., Reference Middleton, Barnes, Lui and Yaffe2010; Muscari et al., Reference Muscari2010) and cognitive function.
Assessment of physical activity
Participants were asked, in two sets of questions, about their physical activity habits during their leisure time, in the past year: one set referred to intensive activity (energetic physical activity that “makes you breathe harder or puff and pant”), and the other to any type of physical activity (moderate activity) that lasts at least 10 min. Participants reported the frequency, duration (months), and average length of their activities. As the recommended amount of aerobic activity is in addition to routine light-intensity activities of daily living (e.g. self-care, cooking, shopping, and casual walking) or moderate-intensity activities lasting less than 10 min in duration (e.g. walking around home or office and walking from the parking lot), it did not specify household, transport, or other routine activities of daily living of light intensity. On the other hand, if a person walked routinely at least 10 min to see his/her family or to a community center, he/she was able to specify this under “any type” of (moderate) activity. Based on recommendations (ACSM, 2009) regarding physical activity, participants were divided into groups reflecting three levels of exercise.
Group 1: Sufficiently active. Those who were involved in moderate physical activity for at least 150 min a week, or in intensive activity for at least 75 min a week, or a combination of the two.
Group 2: Insufficiently active. Those who were involved in physical activity, but a lesser amount than the above.
Group 3: Inactive. Those who report no activity, or activity less than once a week.
Data analysis
The GHQ was calculated as follows:
-
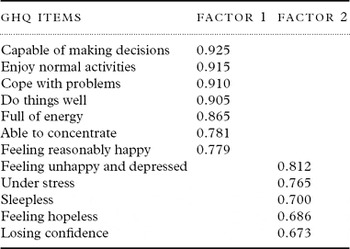
1. We performed an exploratory (principal component extraction with varimax rotation) factor analysis on the GHQ (Table 1). In support of previous studies (Duncan-Jones et al., Reference Duncan-Jones, Grayson and Moran1986; Andrich and Van Schoubroeck, Reference Andrich and Van Schoubroeck1989), our results clearly indicated two factors, with the seven positively oriented items forming one factor (the positive factor) and the five negatively oriented items another (the negative factor). The two factors jointly accounted for 67.34% of the variance.
Table 1.Factor structure of the GHQ-12 using principal component extraction with varimax rotation

-
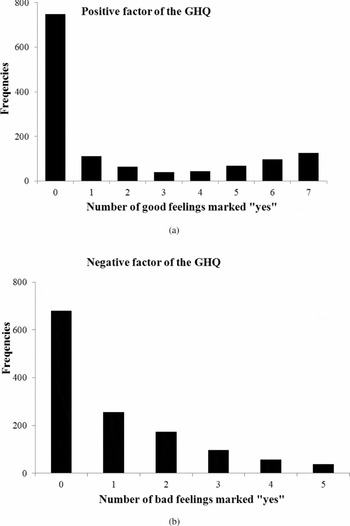
2. At that point we reduced the four-point Likert-type model into a bimodal (yes/no) method, as follows: symptom/feeling present: not at all = no, same as usual = no, more than usual = yes, and much more than usual = yes. This dichotomous model of the GHQ has been used in previous studies (e.g. Shemesh et al., Reference Shemesh, Kohn, Blumstein, Geraisy, Novikov and Levav2006; Hamer et al., Reference Hamer, Stamatakis and Steptoe2009). The frequencies of marking “yes” on good feelings in the positive factor and on bad feelings in the negative factor are presented in Figures 1(a) and (b), respectively. As demonstrated in Figure 1(a), most people (748 participants) did not mark “yes” on any good feeling on the positive factor (nothing is “good” for them). On the other hand, in the negative factor, most people (679 participants) did not mark “yes” on any bad feeling (nothing is “bad” for them).
-
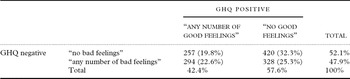
3. In the light of the distribution revealed, we created a dichotomous variable (Table 2) separately for the positive factor (those who marked any number of good feelings vs. those who did not mark any good feeling) and for the negative factor (those who marked any number of bad feelings vs. those who did not mark any bad feeling). As shown in Table 2, the distribution of participants in the four possible cells was similar – 19.8%, 22.6%, 32.3%, and 25.3%, indicating, to a large extent, an independency (χ2 (3) = 1.66; p = 0.65), between the positive and negative factors (maximal independency would have been 25% of the participants in each cell). The meaning of this is that the two factors assess two unrelated attributes. These positive and negative factors were therefore assessed separately in the present study.

(a) Frequencies of people marking “yes” on 1–7 good feelings. (b) Frequencies of people marking “yes” on 1–5 bad feelings.

Frequency of good and bad feelings across the positive and negative factors of the GHQ

GHQ = General Health Questionnaire (mental health).
As the MMSE was not distributed normally, we divided the participants into two groups: participants with cognitive impairment – MMSE ≤ 27, and without cognitive impairment – MMSE≥ 28 (Zaudig, Reference Zaudig1992). We then assessed the differences between the groups on demographic and health variables as well as on physical activity.
Group differences were examined as follows:
-
1. We conducted two-way (3×2) Analyses of Variance (ANOVAs) for assessing differences for each of the following demographic or health variables (measured by continuous data) as dependent variable – age, number of years of education, income, number of chronic illnesses, and number of medications. The two independent variables were: (a) three groups of physical activity, (b) the two groups created for the positive factor (people marking “yes” to any number of good feelings vs. those who did not mark “yes” to any good feeling), or the two groups created for the negative factor (people marking “yes” to any number of bad feelings vs. those who did not mark “yes” to any bad feeling), or the two MMSE groups. Means and SDs are presented in Table 3.
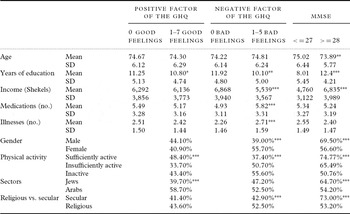
Table 3.Good and bad feelings (GHQ) and MMSE scores as related to demographic and health variables and physical activity (N = 1,663a)
*p < 0.05; **p ≤ 0.01; ***p < 0.001. aAnalyses are based on data availability.
-
2. Chi-squares were performed for assessing group differences (between activity groups, genders, Jews and Arabs, and secular and religious people) in the percentage of people marking good feelings on the positive factor, in the percentage of people marking bad feelings on the negative factor, and in the percentage of people with a high MMSE score. Percentages are presented in Table 3.

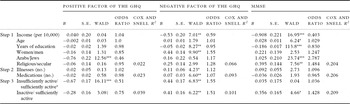
In order to assess whether physical activity contributes to the explanation of the GHQ factors or the MMSE level after adjustment for demographic and health variables, logistic regressions in three steps were performed (separately for the positive factor, the negative factor, and the MMSE). Initially, the demographic variables (age, income, years of education, gender, Arabs vs. Jews and secular vs. religious) were entered (step 1). Income was divided by 10,000 in order to adjust for the range of the other variables in the regression. In step 2, the health variables (number of illnesses and number of medications) were included, and finally, in step 3, the level of activity was entered (see Table 4). The sufficiently active was chosen as a reference group, since the most desired situation should be to perform regular activity; the other two groups are evaluated against the preferred activity group (sufficiently active).
Logistic regressions explaining the variance of the GHQ factors and the MMSE

*p < 0.05; **p ≤ 0.01; ***p < 0.001; †p < 0.08.
aThe sufficiently active was chosen as a reference group, since the most desired situation should be to perform regular activity; the other two groups are evaluated against the preferred activity group (sufficiently active).
Results
Out of the 1,663 participants, 48% (N = 799) were males, 81% Jews, and the rest Arabs, 48.6% were secular and the rest religious. Their mean age was 74.31 (+6.05), and their mean education was 10.78+5.16 years. While 33.4% were classified as sufficiently active, 39.4% were labeled as inactive, and the rest were characterized as active but insufficiently.
Group differences on demographic and health variables measured by two-way ANOVAs
Main effect of the psychological variables
Means and SDs of the demographic and health variables for the GHQ (positive and negative factors) and the MMSE are presented in Table 3. No differences between people who marked good feelings and those who did not were observed in age (F (1,1293) = 0.63), income (F (1,1016) = 0.18), medications (F (1,1293) = 1.97), or illnesses (F (1,1293) = 0.92). The differences were significant for education (F (1,1287) = 4.75; p < 0.05). People marking bad feelings were significantly more educated (F (1,1290) = 28.64; p < 0.001), had a higher income (F (1,1017) = 23.28; p < 0.001), and fewer illnesses (F (1,1296) = 25.05; p < 0.001), and used less medications (F (1,1296) = 20.01; p < 0.001) than people who did not mark bad feelings. Differences on age were not significant (F (1,1296) = 1.64). On the MMSE, people with a higher score were younger (F (1,1657) = 11.72; p < 0.01), more educated (F (1,1648) = 235.37; p < 0.001), and had a higher income (F (1,1298) = 66.24; p < 0.001) than people with a lower score. No differences were found on medications (F (1,1657) = 0.20) or illnesses (F (1,1657) = 0.72) between the groups.
Main effect of physical activity
There was a significant main effect for physical activity on education, income, medications, and illnesses, with the sufficiently active individuals having more favorable scores (being more educated, having a higher income, having fewer illnesses, and using less medications), followed by the insufficiently active, and with the inactive having the least favorable scores. Details on the relationship between physical activity and demographic and health variables were reported in a previous study (Netz et al. Reference Netz, Goldsmith, Shimony, Ben-Moshe and Zeev2011).
Interactions between physical activity and the psychological variables
The only significant interaction observed was on education. The interaction was between physical activity and the MMSE (F (2,1648) = 8.36; p < 0.001). While among people with a higher score on the MMSE (≥28) the level of activity was associated with a higher level of education, this association was not clear among people with a lower MMSE score (≤27).
Group differences on demographic and health variables assessed by Chi-squares (Table 3)
Positive factor of the ghq
Significant differences (χ2 (2) = 18.12; p < 0.001) were found between the activity groups, with a larger percentage of people in the sufficiently active group marking good feelings than the percentage in the insufficiently active group (χ2 (1) = 17.87; p < 0.001), a larger percentage in the inactive than in the insufficiently active (χ2 (1) = 8.22; p = 0.004) group, and marginally significant differences between the percentage of people in the sufficiently active and the inactive groups (χ2 (1) = 2.28; p = 0.074). A larger percentage of Arabs marked good feelings than Jews (χ2 (1) = 22.67; p < 0.001). Differences between males and females χ2 (1) = 1.41 or religious and secular people χ2 (1) = 0.68 were non-significant.
Negative factor of the ghq
A larger percentage of women than men (χ2 (1) = 36.38; p < 0.001) and religious people than secular (χ2 (1) = 12.08; p < 0.001) marked bad feelings. Differences between the activity groups were significant (χ2 (1) = 32.86; p < 0.001), with a smaller percentage of the sufficiently active participants than the insufficiently active (χ2 (1) = 14.68; p < 0.001) and the inactive (χ2 (1) = 31.30; p < 0.001) marking bad feelings, and with marginally significant differences between the insufficiently active and the inactive (χ2 (1) = 2.04; p = 0.087). Also, the differences between Arabs and Jews were non-significant χ2 (1) = 1.73.
The mmse
A larger percentage of men than women (χ2 (1) = 29.40; p < 0.001), of Jews than Arabs (χ2 (1) = 11.76; p < 0.001), and of secular than religious people (χ2 (1) = 70.0; p < 0.001) had a high score on the MMSE.
The three-step logistic regressions (Table 4)
The incremental amount of the variance explaining the positive factor was quite low (Cox and Snell R 2 = 0.039). The contribution of physical activity in step 3, after adjusting for demographic and health variables, raised the explained variance significantly from approximately 2% to 4%. The contribution of physical activity was also significant for the negative factor, with all variables jointly contributing 10% to its variance (Cox and Snell R 2 = 0.101). It was also significant for explaining the variance of the MMSE after adjustment for the demographic and health variables, but its contribution was quite small, increasing the variance from 20.6% to 20.9% (Cox and Snell R 2 = 0.209).
Discussion
Our results indicated that adherence to the recommended guidelines of physical activity in older adults in Israel is a small but significant contributor to the explanation of psychological functioning in addition to, and independent of, demographic and health variables. While lending support to the already existing evidence regarding the relationship between physical activity and psychological functioning in advanced age (e.g. Netz et al., Reference Netz, Wu, Becker and Tenenbaum2005; Lautenschlager et al., Reference Lautenschlager2008; Heesch et al., Reference Heesch, Burton and Brown2011; Xu, et al., Reference Xu, Jiang, Lam, Zhang, Thomas and Cheng2011), our study is innovative in examining this relationship in terms of adherence to a single standardized dose of exercise recommended by official bodies (ACSM, 2009), as well as in investigating how this relationship applies to both mental health and cognitive functioning.
Based on our findings, people who adhere to this single optimal dose of exercise demonstrate higher psychological functioning – emotionally as well as cognitively – than those who do not meet the recommended dose. However, the additional variance explained by physical activity after controlling for demographic and health variables was found to be rather small for all psychological variables. This may be attributed to the gross single-dose measurement of physical activity. It is possible that if the guidelines had been more sensitive, providing more levels of intensity among the sufficiently active, the correlation between physical activity and psychological functioning would have been stronger. Indeed, according to the ACSM (2009), participation in physical activity above the minimum recommended amounts has been shown to provide additional health benefits. The low explained variance may also be attributed to the gross psychological measures used in this study, which may not have been sensitive enough to the complexity of mental health and cognitive functioning. In addition, we studied Israelis only. Perhaps some of the variations in psychological functioning are also culturally or environmentally specific.
Our study is also innovative in exploring separately the positive and negative aspects of mental health in relation to physical activity. In a study exploring the effect of age on positive and negative affects, it was argued that positive and negative affects should be viewed as distinct and independent dimensions, not just opposite ends of a continuum (Mroczek and Kolarz, Reference Mroczek and Kolarz1998). The two clear dimensions extracted in the present study differentiating between positively and negatively oriented items support previous studies exploring the dimensionality of the GHQ (Duncan-Jones et al., Reference Duncan-Jones, Grayson and Moran1986; Andrich and Van Schoubroeck, Reference Andrich and Van Schoubroeck1989). Duncan-Jones et al. reported a low correlation between the observed scores for the subtests formed from the positive and negative items, arguing that the two parts of the test measure different facets of psychological distress.
It should be noted that other studies exploring the dimensionality of the GHQ viewed the two dimensions as psychological constructs, such as “depression/anxiety” and “social dysfunction” (Kalliath et al., Reference Kalliath, O'Driscoll and Brough2004). This view was criticized (see Hankins, Reference Hankins2008), maintaining that the difference in variance between the negative and positive items is largely due to the ambiguous response frame used for the negatively phrased items. It was argued that respondents wishing to indicate an absence of a negative mood state are faced with two possible choices: “Not at all” or “‘No more than usual,” and either of these options reflects the status of respondents not suffering from psychiatric problems. This argument supports our reduction of these two choices into one (“no” vs. “yes” for “more than usual” and “much more than usual”), thus reducing the ambiguity of these choices.
Based on our findings, the negative factor was more sensitive to demographic and health variables than the positive factor. These findings corroborate a previous study claiming that positive affect declines steadily throughout life, irrespective of socioeconomic status or nationality, while negative affects remain the same or decrease with increased aging (Diener and Suh, Reference Diener, Suh, Schaie and Lawton1997). In our study, greater income and more years of education, as well as fewer illnesses and medications, were associated with fewer bad feelings on the negative factor, with men marking fewer bad feelings than women. On the other hand, in support of Diener and Suh (Reference Diener, Suh, Schaie and Lawton1997), these differences were not indicated on the positive factor (no general age decrease on the good feelings was indicated, possibly because only aged people were included in our study). In terms of demographic or health variables, the only difference on the positive factor was indicated between Jews and Arabs, with Arabs marking more good feelings than Jews. Then again, Arabs in the present study were significantly younger, which may explain this difference.
With respect to physical activity, the findings on the negative factor support previous studies observing a dose–response relationship between physical activity and mental health (Hamer et al., Reference Hamer, Stamatakis and Steptoe2009; Heesch et al. Reference Heesch, Burton and Brown2011), which was not the case of the positive factor. While the negative factor was linearly correlated with physical activity, with fewer of the insufficiently active than the inactive marking bad feelings, more people in the inactive than the insufficiently active group indicated good feelings. This finding deserves further exploration. On the other hand, the sufficiently active – those who met the recommended guideline of physical activity – were superior to both the insufficiently active and inactive groups in both the negative and positive factors.
In light of the criticism on the scarcity of studies examining positive affect in mental health (see Netz et al., Reference Netz, Wu, Becker and Tenenbaum2005), of special interest is the variance accounted for the positive factor by physical activity, which doubled the variance accounted for by demographic and health variables. It is possible that exercise would be much more appealing to older adults if they were told it could make them feel “good” rather than “less poorly.”
In terms of cognitive functioning, a clear dose–response relationship was indicated between adherence to the recommended dose of physical activity and the likelihood of cognitive impairment. Previous studies (Middleton et al., Reference Middleton, Barnes, Lui and Yaffe2010) reported a dose-independent association between physical activity and lower rate of cognitive impairment, and in that sense the present study supports the study by Xu, et al. (Reference Xu, Jiang, Lam, Zhang, Thomas and Cheng2011) describing the dose–response relationship. However, after controlling for demographic and health variables, the additional variance of cognitive functioning explained by physical activity is quite small. Furthermore, only the difference between the two extreme groups – the inactive and the sufficiently active participants – contributed to the explained variance, while the difference between the sufficiently and insufficiently active individuals was insignificant (Table 4). This finding makes the dose–response relationship observed in our study questionable. Long-term studies are needed in order to further explore the dose–response relationship between adherence to the specific recommended guidelines of physical activity in old age and the likelihood of cognitive impairment.
The major limitation of our study is obviously its inability to attribute the power of altering psychological functioning to physical activity. It is possible that our findings reflect “reverse causation,” such that a pre-existing psychological status caused an increase or a reduction in physical activity. Alternatively, another hypothesis suggests a reciprocal causation, so that physical activity causes changes in positive and negative feelings and in cognitive functioning, and these changes in turn reinforce adherence to habitual physical activity (Knab and Lightfoot, Reference Knab and Lightfoot2010). An adequately powered randomized controlled trial should be performed to further evaluate this hypothesis.
Conflict of interest
None.
Description of authors’ roles
Y. Netz was responsible for the initial concept of the study, as well as for analyzing and interpreting the data, and preparing and reviewing the manuscript during every stage of its development. A. Dunsky contributed her ideas to the interpretation of the data, and reviewed the drafts of the paper for intellectual content. S. Zach contributed her ideas to the analysis of the data and critically reviewed the paper. R. Goldsmith assisted in obtaining Ethics Committee approval, coordinated the collection of the data; critically reviewed the paper in terms of both intellectual content and language, and approved the final version. T. Shimony prepared the data for statistical analysis, contributed her ideas to the interpretation of the data, and critically reviewed the paper for intellectual content. U. Goldbourt contributed his ideas and expertise to the analysis and interpretation of the data. A. Zeev formulated the statistical design, analyzed the data, critically reviewed the results section, and reviewed the drafts of the paper for intellectual content.
Acknowledgments
The authors wish to acknowledge the support of the Israel National Institute for Health Policy and Health Services Research (NIHP 2002/15/A), the Israel Hypertension Society, and the Association for the Planning and Development of Services for the Aged in Israel, ESHEL.