In academia, citation is the sincerest form of flattery.—A Wuffle (1986)
This essay is the first of a planned three-part series dealing with quantitative indicators of continuity and change in the political science discipline, focusing on the period since 1960. The series is inspired by the work of Somit and Tanenhaus (1967) which presented reputational rankings of both departments and individuals. For this series of essays, we created a unique database in which we recorded cumulative citation counts between 1960–2005 for all regular faculty members of U.S. Ph.D.-granting institutions ca. 2002. In addition to identifying the department at which the individuals in this data set are presently employed, we have also collected information on their date of Ph.D. and the institution from which their Ph.D. was awarded.
In this essay, we identify the 400 most-cited scholars who (ca. 2002) were teaching in political science graduate departments in the U.S., breaking down this data by subfield, by cohort, and by gender. In the next paper of the series, to be published in the April 2007 issue of PS, we explore the history of the discipline in quantitative terms by examining the changes in departmental Ph.D. production and placement rates over the last century and look at patterns of cross-departmental hiring. Paper three of the series, to be published in the July 2007 issue of PS, compares various ranking approaches in order to examine the visibility and impact of Ph.D.-granting departments. In that essay, we incorporate both the citation count data presented in this current paper and the placement data from the second paper into a multivariate model to predict departmental reputation.
Identifying Measures of Individual Impact and Prominence
There are various ways to measure a scholar's impact or academic contributions.1
Somit and Tanenhaus (1967, 67–70), for example, distinguish five different significant contributors: those who are innovators and contribute a major “new” idea, those who systematize and organize the ideas in a subfield, those who function as a catalyst and encourage experimentation, those who have written an influential textbook, and those who have provided a critical role in the organization of the discipline through professional service.
In one of the early reputational studies, Somit and Tanenhaus (1967) compiled a list of the most influential scholars in political science by sending a questionnaire to all members of the American Political Science Association in which they asked respondents to list the scholars who have made the “most significant contribution” to the discipline for two periods: pre-1945 and 1945–1963. Although Somit and Tanenhaus ultimately identified a core group of the profession's “notables,” they found a significant degree of disagreement among their respondents. These differences were especially apparent when the authors disaggregated the respondents by their respective disciplinary subfields. Roettiger (1978) updated the Somit and Tanenhaus study, but also included reputational rankings of political scientists considered as public intellectuals.
An alternative measure of scholarly impact might define rankings based on a scholar's total number of publications in the discipline's most prestigious academic journals (e.g., Robey 1979; Morgan and Fitzgerald 1977; Bayard and Mitchell 1998; and McCormick and Rice 2001).2
Studies which focus only on publications in top journals justify this limitation by observing that the peer-review process is much more competitive at the top journals, and that top journals are more likely to be read by a wide audience. Thus, the number of publications in the discipline's top journals may provide a good indicator of academic contribution and impact. A practical reason for focusing on top journals is that it makes the data collection process much more manageable.
The most recent work dealing with scholarly visibility and impact (especially that on the sociology of the natural sciences) makes use of the citation data from the Web of Science data set whose compilation began in 1973. A number of scholars in political science (e.g., Klingemann 1986; Klingemann, Grofman, and Campagna 1989; Miller, Tien, and Peebler 1996) have made use of the Social Sciences Citation Index (SSCI) component of the Web of Science.3
Miller, Tien, and Peebler (1996) also count publications in the American Political Science Review, and then combine this data with citation count data to devise a composite ranking scheme.
In this article, we rely on citation count data to measure an individual's scholarly impact on the profession. Rather, like the Fortune 500 which ranks corporations by their total gross revenue, we identify the “notables” of our time by ranking individual scholars based on their cumulative citation counts. We agree with Miller, Tien, and Peebler (1996, 73–4) that citations provide “a useful and valid measure for determining standing in the profession.” Citation data can be preferable to publication data in that many publications, even ones in prestigious journals, have little or no impact or visibility in the field. Moreover, work published in less-prestigious journals may nonetheless come to be highly visible and influential. Perhaps even more importantly, judging visibility only by article publication discriminates against those scholars whose publications come as books. In contrast, while it is true that the SSCI only lists citations that are found in articles, all citations in those articles, whether to books, to other articles, or even to unpublished materials, are tallied in the SSCI counts. Of course, as all authors who use citation data acknowledge, we recognize that such data have their limitations, and in an extensive methodological appendix we address some of the particular problems that arise with using citations for ranking purposes in political science.4
In the Appendix we look at methodological issues such as data availability and reliability. We also consider the implications of limiting ourselves to regular faculty at U.S. Ph.D.-granting institutions, and problems in delineating that set of faculty.
The Political Science 400
This paper updates the work by Klingemann (1986) and Klingemann, Grofman, and Campagna (1989). The latter work identifies the 400 most-cited U.S. scholars in the profession by tallying the citations to lifetime bodies of work in all journals included in the SSCI database during the five-year period: 1981–1985.5
There is certainly nothing sacred abut the number “400.” Indeed, we understand that the number may originally have been picked in error. Still, it has three attractions. First, with roughly 4,000 faculty in our data set, it corresponds roughly to the top 10%. Second, the 400th member of the list has about 400 citations. Third, and not insignificantly, if allows us to make direct comparisons with the data compiled by Klingemann, Grofman, and Campagna (1989).
The size and other characteristics of our data set are described in the Appendix.
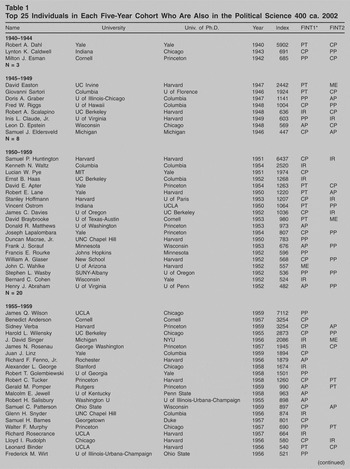
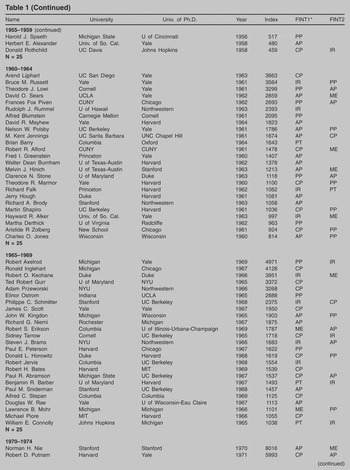
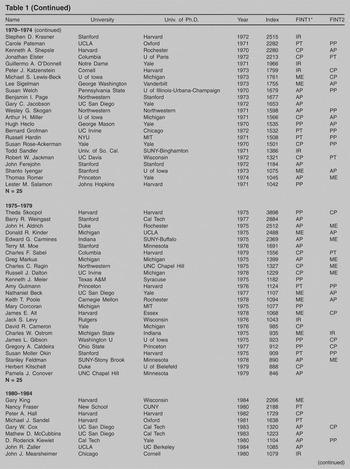
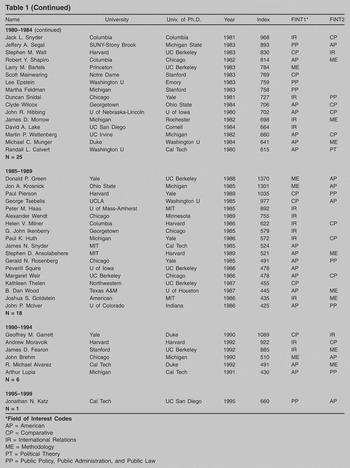
In Table 1 (which parallels Table 1 in Klingemann, Grofman, and Campagna 1989) we identify by name the top 25 scholars from that list of 400 in each five-year cohort.7
Some cohorts will have more than 25 scholars, some will have less, so that Table 1 only contains the names of 206 of the 400 most-cited scholars teaching (ca. 2002) at U.S. Ph.D.-granting institutions. The full list is posted here: www.socsci.uci.edu/∼bgrofman/.
See Appendix.
Top 25 Individuals in Each Five-Year Cohort Who Are Also in the Political Science 400 ca. 2002

Continued.

Continued.

Continued.

Breakdown of the Political Science 400 by Ph.D. Cohort
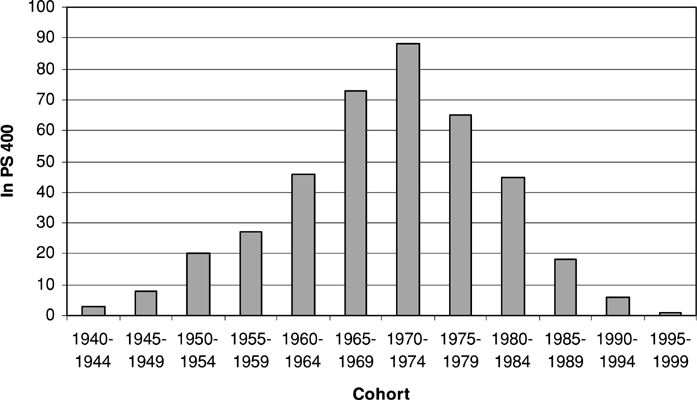
In Figure 1, we show the distribution of scholars in the top 400 by five-year Ph.D. cohort. As we see in this figure, older cohorts make up a larger proportion of the Political Science 400. The largest number of top scholars comes from the 1970–1974 cohort.

Cohort Distribution of Political Science 400
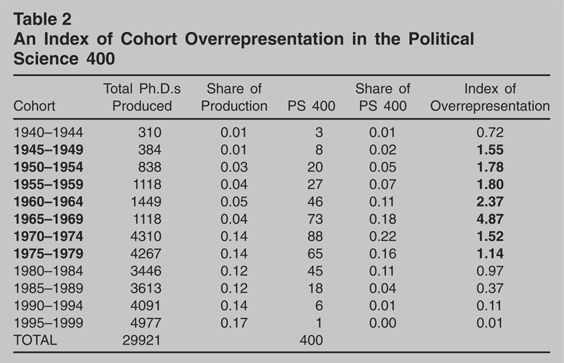
However, the slight overrepresentation of older cohorts may be simply a reflection of the cohort distribution in the profession as a whole. To better understand the patterns seen in Figure 1 we need to take into account relative cohort sizes. We can generate an index of overrepresentation by dividing each cohort's share of the Political Science 400 by its share of total Ph.D.s produced over the corresponding decades. For this index, values that are above 1 indicate overrepresentation. Table 2 (which parallels Table 5 in Klingemann, Grofman, and Campagna 1989) shows the values of this index for each cohort.
An Index of Cohort Overrepresentation in the Political Science 400

We see from Table 2 that older cohorts are much more overrepresented in the Political Science 400 than younger cohorts. However, the 1965–1969 cohort is the most overrepresented (with an index value of nearly 5), while the oldest cohort, 1940–1944, is underrepresented (with an index value of only 0.72). Highly cited scholars appear to remain in the academy longer than their peers, but factors such as retirement and death limit the length of their careers, thereby eventually weakening the dominance of older cohorts. The underrepresentation of younger cohorts speaks to the time-lag of publishing and citing. But, of course, as more time passes, we expect these younger cohorts and new rising scholars to dominate the top 400.
The Distribution of Citation Counts
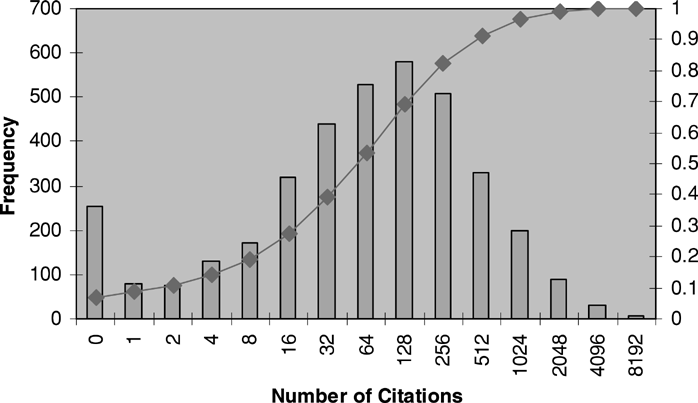
As shown in Figure 2, overall citation data has a nearly lognormal distribution, but with a fat left tail at zero. In other words, those with very high citation counts have exponentially more citations than those with few citation counts, and there are a non-trivial number of faculty teaching at Ph.D.-granting universities who, over the course of their careers to date, have garnered zero citations to their work (at least in terms of the citations to their work found in the very large set of journals [1,000+] included within the SSCI).

Cumulative Citations for Faculty at U.S. Ph.D. Granting Departments 1960–2005
We might expect, however, that some of this difference is due to cohort effects. In particular, we might think that most of those with zero citations would be recently minted Ph.D.s. But after disaggregating the data for the 1940–1949, 1950–1959, 1960–1969, 1970–1979, 1980–1989, and 1990–1999 cohorts (figures not shown), we continue to find zero cumulative citations to some scholars within each cohort even for publications published long enough ago to have had a considerable time to attract citations. Of course, not surprisingly, the proportion is at its highest in the most recent cohort, with 10% in that cohort having zero citations to their work. Within each cohort, except for the 1990–1999 cohort, we also find similar lognormal distributions of cumulative citations to the work done within each decade,9
However, because we have only limited data for the 1990–1999 cohort, we would expect it, too, to eventually exhibit a near lognormal distribution of cumulative citation counts.
Breakdown of the Political Science 400 by Disciplinary Subfields
Klingemann (1986, Table 3, 657) breaks down the most highly cited faculty according to subfields, creating a five-fold breakdown of subfields (Political Theory/Political Thought, American Politics/Political Behavior, Comparative Politics, International Relations, and Public Policy/Public Administration/Public Law). In Table 3, we provide a parallel analysis by subfield for our more recent data, but here use a six-fold typology involving the same five categories as in Klingemann (1986), but with one additional category, Methodology, that has recently risen to greater prominence. We use the first listed subfield in the 2002 APSA Membership Directory to define faculty member subfield identification.
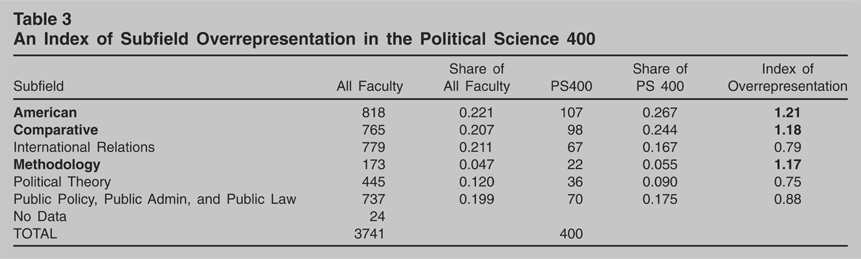
An Index of Subfield Overrepresentation in the Political Science 400

We might expect that the Political Science 400 might not reflect all the subfields equally, since, as previously noted, some subfields may be larger than others, and also because the subfields may differ in their citation practices with respect to citation of work by still-living political scientists. Analogous to what we did in Table 2, we can generate an index of overrepresentation by dividing each of the five subfield's share of the Political Science 400 by its share of all faculty teaching in U.S. Ph.D.-granting departments. As before, values on the index that are above 1 indicate overrepresentation. Table 3 also shows the values of this index for each cohort.
We see from Table 3 that three out of the six subfields are slightly overrepresented in the Political Science 400: American Government, Comparative Politics, and Methodology. American Government and Comparative Politics are also two of the larger subfields in the discipline, so if size effects are non-linear that might explain their overrepresentation. However, the overrepresentation of our added sixth category, Methodology, demonstrates the rise of a new subfield in political science. And, the relative underrepresentation of scholars in International Relations, despite the size of that subfield, may suggest that this area is more separated from the others, and thus attracts fewer cross-citations across subfields.
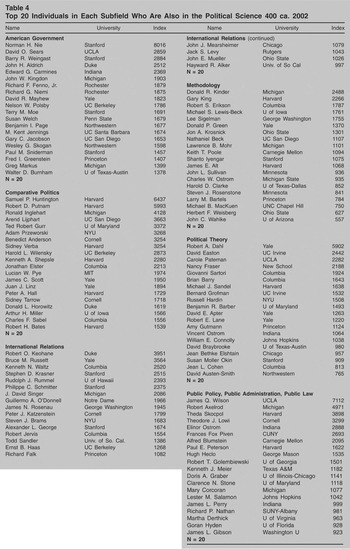
We have also used Klingemann's five-fold typology to identify the 25 most highly cited scholars in each subfield, as shown in Table 4 (paralleling Klingemann 1986, Table 3, 657). Unfortunately, there is no way to break down a scholar's citations by subfield of the paper which is being cited (not to speak of the fact that many individual papers may cross subfield lines). Thus we have no real choice but to use the scholar's own first-listed subfield in the 2002 APSA Membership Directory to create our subfield specific lists, despite the fact that many scholars publish in multiple subfields.10
We recognize that although we classify scholars by the subfields listed in the APSA directories, there are a number of scholars on our list who may publish or have reputations for published work in fields outside their listed subfield. For example, a scholar such as Sidney Verba has written highly cited works in both American Government and Comparative Politics, yet we list him as one of the top 20 Comparative Politics scholars in the profession. Although certainly not all citations to Verba will be in Comparative Politics, we choose to honor the first subfield specialization he chose to list for himself in the APSA Directory. Moreover, given the way in which published works are listed in the SSCI, it would be too difficult to classify a scholar's citations by subfield.
Top 20 Individuals in Each Subfield Who Are Also in the Political Science 400 ca. 2002

Gender Representation in the Political Science 400
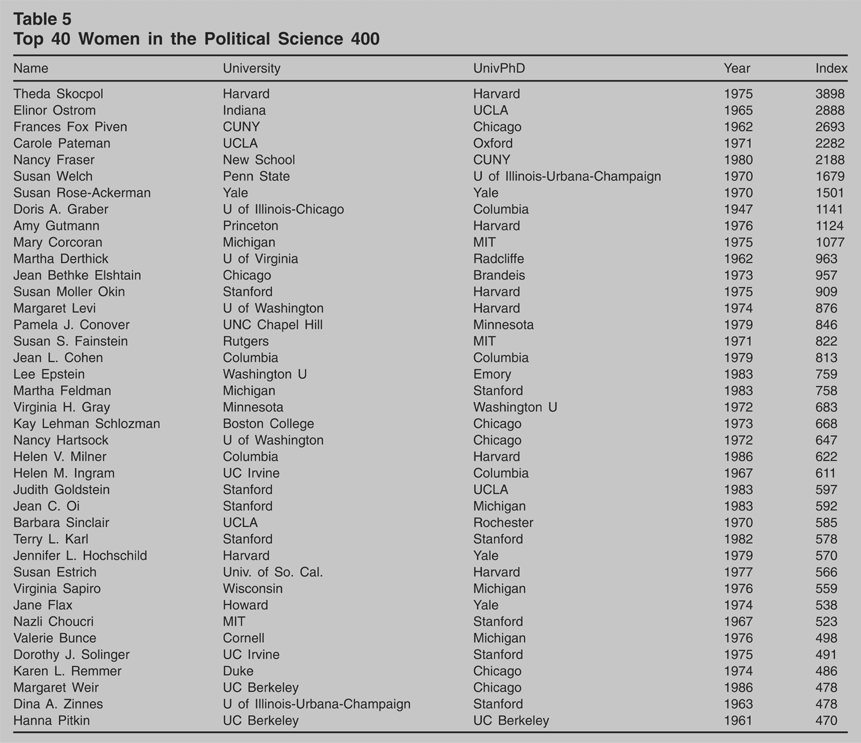
We show in Table 5 the top 40 women in the profession (as judged by citation counts) teaching at U.S. Ph.D.-granting departments of political science.11
We would also like to note that, as with gender, racial and ethnic minority scholars are clearly underrepresented in the Political Science 400. In particular, scholars of Latino/Hispanic or Asian heritage, at least those whom we can identify using surnames, account for a little over 1% of the top 400 list: R. Michael Alvarez, Steve Chan, Guillermo O'Donnell, Jean Oi, and Arturo Valenzuela.
Since Martha Feldman has recently moved from the University of Michigan to UC Irvine, Irvine would join Stanford in having three of the top 40 women on its faculty had we used a later APSA Directory. But, of course, there may also be other recent changes of which we are unaware.
Top 40 Women in the Political Science 400

Approximately one fifth of all faculty members in Ph.D.-granting institutions are female, while 23% of political science Ph.D.s conferred between 1966 and 2001 have been awarded to women. When we calculate an index of representation for gender representation (i.e., number of women in the Political Science 400 divided by number of women in the database) we find an index of representation far below 1, namely .539. Of course, since the proportion of women in the profession has been steadily rising, we might think that some of the underrepresentation is due to cohort effects in which younger cohorts may have higher proportions of female faculty. We can generate the index of gender representation for each five-year cohort separately. When we do so, we find, contrary to our expectations, that it is the women in earlier cohorts who are better represented in the Political Science 400 relative to their share of jobs than women in later cohorts. In the Political Science 400, the proportion of women peaks in the 1970–1974 cohort (20% of that cohort is female) and then decreases in the younger cohorts. Moreover, the only two cohorts where women are overrepresented as compared to their share of all faculty in Ph.D.-granting institutions are the 1960–1964 and 1970–1974 cohorts (index scores of 1.50 and 1.15, respectively).13
The overrepresentation of women only in the earlier cohorts may be due to the fact that the more distinguished female scholars are more likely to stay in the profession longer than their less distinguished female peers to an even greater extent than is true for men.
Discussion
There are three points we wish to emphasize in looking at both continuities and changes in citation patterns and other aspects of the political science profession since the Klingemann, Grofman, and Campagna (1989) study.
First, despite an elapsed time period of a full 20 years from the data relied upon by Hans-Dieter Klingemann and his coauthors, we find a variety of evidence for continuity at the levels both of individual scholarship and of cohorts. In terms of cohorts, there has been a remarkably slight shift in the composition of the Political Science 400. Whereas Klingemann, Grofman, and Campagna found the 1965–1969 cohort to dominate the Political Science 400 in 1989, we find that the 1970–1974 cohort is at the apex of its prominence today. At the level of individual scholars, we also find a remarkable degree of continuity in the Political Science 400's makeup. For example, of the top 25 scholars from the 1970–1974 cohort identified on the basis of their 1980–1985 citations, 18 are still among the top 25 in that cohort today, and most of those who are not have either taken jobs outside political science Ph.D.-granting departments (e.g., Michael Cohen, in a public policy school), are no longer employed in the academy (Walter Laqueur), are teaching outside the U.S. (Douglas Hibbs), or are dead (Richard McKelvey), and thus no longer in our database. If we look at the top 25 scholars in a still earlier cohort, that of 1960–1964, while only 11 of those who, on the basis of their 1980–1985 citations were in the Top 400, are in our present top 400 list, only one of those still in our database would not retain membership in this select group. The rest are no longer in the top 400 because of deaths, retirements, and having jobs outside of academia.14
One person in this cohort in the Klingemann list would no longer be eligible under our stricter requirement that the person's current primary affiliation be in political science.
Second, women (and minorities) continue to be underrepresented in the Political Science 400 relative to their numbers, and the problem does not appear to be diminishing as we look at younger cohorts.
Third, there have been some changes in the profession in terms of relative size of subfields, including the rise of a new subfield, methodology.
This article presents rankings of individual scholars through the use of total lifetime citations. However, we believe that individual-level citation data presents only a partial picture of the change and continuity of the political science profession. To understand the role of institutions on the profession, we must also consider the departments at which these individual faculty members are employed. In the next paper of this series, we will turn to departmental-level data and analyze Ph.D. production and placement rates of U.S. Ph.D.-granting institutions between 1902–2000 in order to determine how departmental prestige has changed over time. In the third paper, we will combine the data presented in this article and the second series paper to create a more comprehensive ranking of Ph.D.-granting departments.
Author Bios
Natalie Masuoka is a Ph.D. candidate at the University of California, Irvine. Her dissertation examines the impact of mixed race identities on racial minority political participation and attitudes.
Bernard Grofman, whose past research has dealt with mathematical models of group decision making, legislative representation, electoral rules, and redistricting, has been at the University of California, Irvine since 1976 and professor of political science at UCI since 1980. He is co-author of four books, published by Cambridge University Press, and co-editor of 16 other books; he has published over 200 research articles and book chapters. Grofman is a past president of the Public Choice Society and in 2001 he became a fellow of the American Academy of Arts and Science.
Scott L. Feld, professor of sociology at Purdue University, continues his investigations into systematic causes and consequences of patterns in social networks, including academic placement networks. He is also continuing to study how collective decision making processes are affected by social structures in the forms of group memberships, norms, and social networks.
Appendix
In using citation data as we have, numerous caveats are required:
Data Limitations in the SSCI Data
While some problems earlier identified with SSCI (see e.g., Cnudde 1986) have been fixed, there remain a number of limitations in using the SSCI data available online from the Web of Science web site. The most important of these is that of coping with identical last names, further compounded by the following: (a) the Web of Science does not give author's first names but only initials; (b) some authors are not consistent in how they list themselves (for example, one of the present authors used his middle initial for publications early in his career, but subsequently dropped it); (c) marriage or divorce (or simply choices about reclaiming heritage) may lead to changes in professional name; and (d) inconsistencies in how SSCI handles compound and hyphenated names make it especially hard to do reliable citation counts for scholars with multiple or hyphenated names (for example, citations to Bruce Bueno de Mesquita are listed under four different variants of his name). In order to cope with such difficulties we physically reviewed the SSCI listings for each of the 4,000+ scholars who taught at U.S. Ph.D.-granting institutions ca. 2002 and tried to use our knowledge of the profession to distinguish work by the scholar we were interested in from work by his or her namesakes. We recognize that mistakes have inevitably been made. We ask the forgiveness of any scholar whom we may have inadvertently slighted.
A second major problem with the SSCI data is how limited the information we have on co-authorships is. The SSCI has been fully updated to now identify co-authors for journal publications. These updates have not been applied to books; therefore first-authors continue to receive sole credit for co-authored (or co-edited) books. However, although the SSCI officially documents co-authors for journal articles, we have found that not every journal entry has been updated. Thus, while scholars now receive some credit for co-authored work, citations to co-authored work are still undoubtedly undercounted. (This point was made by a reviewer, and by others who read a draft of our paper.) This problem of course, has its greatest impact on authors who frequently co-author, and among those, on ones which use the alphabetical order convention and whose last names begin with letters later in the alphabet. Unfortunately, given the size of the data set we are dealing with, there is simply nothing we can do to remedy this problem. (For co-authors aggrieved by what they have just read, we might simply note that they are not alone. For example, one of the authors of this paper co-edited a 1994 book which received some 80 citations on which he was the second-listed co-editor. The first-listed scholar's last name begins with the letter D, and all citations went to that scholar.)
In sum, using the SSCI requires human ingenuity. We have tried very hard to clean the data, but we ask the reader's understanding of the limits of what is possible.
Using the SSCI Data to Create Rankings
One issue with use of the SSCI data is that, even when a full set of co-authors does get citation credit, an argument can be made that this overweights co-authored work, since multiple authors are getting credit for the same work. In this view, work which is co-authored should not yield full citation counts to each of the co-authors, and credit should be normalized so that the sum of the author citation counts is one for each co-authored article. Moreover, it has also been suggested to us that the relative credit awarded to each might depend in some fashion on the order of authorship. However, because of the form in which citation data comes on the Web of Science it is essentially impossible to use any rule for fractional weighting of co-authored work (even if one wanted to do so) without recoding each and every citation by hand to separate out singly-authored and co-authored work, and to distinguish second, third, fourth, etc. authors. We have thus, of necessity, treated a citation as a citation as a citation, despite the fact that this leads to inconsistencies in how earlier and later citations involving co-authorship are being treated.15
Earlier work such as Klingemann (1986) and Klingemann, Grofman, and Campagna (1989) used the hardcopy SSCI annual volumes, which only list citations to the first-named author.
Also, for the really highly cited authors in the Political Science 400, we are skeptical that taking self-citations into account would matter much, whereas counting or not counting self-citations certainly could affect relative rankings for less highly cited scholars.
There are other issues related to assigning weights to citations in addition to the issue of whether to weight co-authored articles differently than singly authored articles.
One reviewer suggested that we ought to weight citations in “major” journals more heavily than citations in “minor” journals. In principle, we agree and, as noted in the text, there have been a number of ranking schemes that, at least in part, do limit themselves to citations (or publications) in “major” journals or seek to combine information about citations with information about where an author is published or cited (see e.g., Miller, Tien, and Peebler 1996). But, once we get past the APSR and perhaps the top two regional U.S. journals, we see great difficulties in getting agreement across subfields (and, especially across different methodological approaches) about what are the “top” journals. While there are rankings of political science journals that identify factors such as visibility in the political science community, reputation among those familiar with the journal, and various measures of journal impact, (a) these measures tap different dimensions, and it is not obvious how to combine and weight them for ranking purposes, and (b) if we limit ourselves to a citations in a relative handful of journals, this makes it harder to assess the overall impact of a scholar—especially since that may extend beyond citations in just political science journals. The bottom line is that the SSCI list of journals is a very extensive one (1,000+ in the social sciences as a whole) and it seemed a reasonably “neutral”—although far from perfect—way to identify the set of journals in which citations would “count.”17
For example, while there are complaints that the SSCI database inappropriately includes some non-academic journals (Klein and Chiang 2000), the blips this might cause are far too minor to affect the structure of rankings for the most highly cited scholars and, in any case, we have excluded all mainstream journal and news magazines such as Time, Newsweek and the New Yorker.
A second additional issue in using citations to rank individual scholars is raised by advocates of the “h index” (Hirsch 2005) who propose to rank scholars not by their total citations but by the number of papers they have that are highly cited, where “highly cited” gets defined in a precise way reminiscent of the Lorenz curve. To use the “h index,” we take an author's publications and list them in order of their citation count. Then, counting down from the top, if the kth most cited publication has a citation count of hk, then the h score equals k for the largest value of k such that hk is greater than or equal to k. For example, if an author had written 30 papers or books and the first 20 most cited of these each received anywhere from 30 citations to 21 citations (i.e., the author's most cited paper or book had 30 citations while the 20th most cited paper or book had only 21 citations), and also the 21st most frequently cited article had only 19 citations, then the h score would be 20. Indeed, the h score would remain 20 if the author's most cited item had received 300 citations; or 3,000 citations; or 30,000 citations. We strongly prefer simple summation to using h scores. These scores have very strange properties, e.g., someone who published only three books, each of which had citations in the thousands, but who had done nothing else, would receive an h score of 3 whereas someone who had published, say, exactly 20 articles, each of which got 20 citations, would receive an h score of 20. Such a ranking rule would tend to underrate the Karl Marx's of the world.
A third additional issue in using citations for ranking is whether to use cumulative citation data over the course of a scholar's lifetime, or to confine oneself to citations received in some more recent period. In preparing this paper, we generated data on cumulative citation counts broken down by decades,18
The breakdown by decades we did was in terms of the year of the publication being cited. We did not have time to further break down the data by the year of citation. Ideally, we would like to do both, and we hope to do so in follow-up work looking at citation patterns over the course of scholars' careers.
Russell Dalton (personal communication, April 2006) has suggested that we might create a (normalized) measure of citations per year to control for date of Ph.D. effects. This seems like a very sensible thing to do, although for space reasons, we did not take up his suggestion here.
There are other potential problems with using SSCI citations for rankings. For example, the SSCI makes use of the citations that appear in academic journals, and does not include citations that appear in books or edited volumes. It is possible that this restriction might lead to some bias against particular styles of work which tend to be published as books rather than as journal articles, but that is a question that goes beyond the scope of the present work. (We suspect, however, that the books or articles which are heavily cited in books are roughly the same books or articles which are heavily cited in articles.) Additionally, some citations are to textbooks or computer manuals or to computer packages (or articles explaining them) while others are to more substantive research monographs and, in principle, we might want to distinguish those different types of references. But that is essentially impossible given our database limitations without attempting an impossibly huge task of classification. Thus, citations to each of these types of works are included in our counts. Finally, since not all citations are positive, and some may involve harsh criticism of an author's work, it might be nice to distinguish positive from negative citations. Still, the fact that some author bothers to criticize a piece is an indication that it is being taken seriously. In any case, whatever we might like to be able to do, given the size of the database we are dealing with and the limitations of the automated features of the SSCI online database, we are not in a position to make such distinctions even if we wished to do so. Thus, in sum, and of pragmatic necessity, is why we stick to the one citation equals one citation rule.
Data Issues in Identifying Who is to be Included
We take our data of who is eligible to be in the Political Science 400 from Graduate Faculty and Programs in Political Science (APSA 2000), supplemented by the 2002–2004 Directory of Political Science Faculty (APSA 2002) and the APSA Centennial Biographical Directory of Members (APSA 2000). As of 2002, there were 4,103 regular faculty members in the 132 Ph.D.-granting departments in political science in the U.S. For analyses in terms of departmental Ph.D. production, there were 362 (8%) faculty members for whom we did not have complete information regarding their educational background. Among those we identify as members of the Political Science 400 we are missing data on educational background for only one scholar.
The most important thing to note about our selection choice is who it excludes. While the faculty in the list of 400 include a few political science faculty trained outside the U.S., and even a few whose degrees are in a discipline other than political science, for reasons of manageability and consistency, the only faculty who were eligible for inclusion were those who have their primary affiliation in a U.S. Ph.D.-granting political science department (ca. 2002).
These restrictions can be very important ones.
They exclude all faculty who teach at a department which is not one of the 132 Ph.D. political science-granting departments in the U.S. (e.g., those who teach at a purely undergraduate-institution or whose highest degree is a masters), and those with jobs outside of academia (e.g., president of the World Bank), or jobs outside the U.S. Indeed, even, political science faculty teaching exclusively in professional schools are not included in our list. Thus, we know that some political science faculty teaching in the U.S. with whose citation visibility we are otherwise familiar, such as Pippa Norris (Kennedy School) or Michael Cohen (School of Information, University of Michigan), are not included in the current Political Science 400 list even though their citation counts would entitle them to this honor. Similarly, there are no doubt political scientists teaching at European universities (or in Canada or elsewhere) whose citation counts would put them into the top 400 ranks, but who are excluded because they are not teaching in graduate programs in the U.S.
The eligibility rules for the Political Science 400 also excluded those with adjunct or lectureship appointments, and faculty who are emeritus if they are no longer listed on faculty rosters. However, as several of those who have been kind enough to read an earlier draft of this essay have reminded us, the way departments treat emeriti is not at all consistent. Some departments continue to list faculty on their masthead long after they are no longer participating members of the department; indeed, perhaps long after they have left the state or even moved to teach at other institutions. We have used the simple rule that emeriti still treated as faculty members on the list provided by departments to APSA are eligible to be in the Political Science 400 regardless of when they might or might not have officially retired or where they might have retired to. In the third essay of this series, where we rank departments by the citations to their members, the decision to include emeriti still listed on departmental faculty lists provided to the APSA has some further implications for department rankings which we will discuss.
Perhaps the next most important problem in trying to decide eligibility has to do with scholars with joint appointments. Since we are interested in later using the citation counts to evaluate the success of Ph.D.-producing institutions in turning out Ph.D.s who go on to be highly cited, in cases of joint appointments, we have usually not counted as eligible someone whose Ph.D. was in a discipline other than political science (or whose other appointment is in a law school). In particular, we have tried to exclude courtesy appointments of faculty who are not really part of the host department. On the other hand, if there are faculty trained in other disciplines whose principal home appears now to be political science, we have tried to leave them eligible for membership in the Political Science 400.
We have tried to be consistent in our standards for inclusion and exclusion but, in many instances, deciding who should be in and who out has required a judgment call (sometimes based on looking at departmental or personal home pages and sometimes based on the personal knowledge of one or more of the present authors). For example, a faculty member at our home institution with a Ph.D. in political science and whose work is exclusively in political science who holds an appointment in our department that gives her departmental voting rights but whose primary appointment is in another interdisciplinary department was considered eligible for the list. But we also wish to acknowledge that our decisions do have major consequences for who was excluded. For example, after having done a preliminary version of the Political Science 400, we looked in more detail at those on this preliminary list, and faculty with J.D.s whose primary appointment appears to be in a discipline other than political science (e.g., law school faculty with public law interests such as Bruce Ackerman, Sanford Levinson, and Cass Sunstein; or economists such as Gordon Tullock) were excluded from eligibility, even though their citation count would otherwise entitle them to inclusion in the list.