Lameness is a departure from normal gait, caused by disease or injury in some part of limbs or trunk, usually accompanied by pain (Boden, Reference Boden1998). The aetiology can be broadly classified as either genetic, congenital, physical injury or infection (Coulon et al. Reference Coulon, Lescourret and Fonty1996; Green et al. Reference Green, Hedges, Schukken, Blowey and Packington2002; Winter, Reference Winter2004). The notion is that lameness is one of the most important health problems in sheep, related not only to impaired animal welfare but to production losses, as well. Most of the available information on sheep lameness relates to meat/wool producing breeds, with well documented evidence of the causes, prevalence, incidence and economic consequences (Green & George, Reference Green and George2008; Kaler & Green, Reference Kaler and Green2008), which include weight loss, reproductive failure and reduced wool production (Stewart et al. Reference Stewart, Clark and Jarrett1984; Marshall et al. Reference Marshall, Walker, Cullis and Luff1991; Eze, Reference Eze2002). However, it is dairy sheep production that is the major industry in Greece and most Mediterranean countries (De Rancourt et al. Reference De Rancourt, Fois, Lavín, Tchakérian and Vallerand2006; Gelasakis et al. Reference Gelasakis, Valergakis, Arsenos and Banos2012), with its renowned culinary specialties, like Feta and Roquefort cheeses. Therefore, detailed information regarding the effect of lameness on sheep milk production is warranted.
In dairy sheep, lameness incidence has been found to show high variability depending on both physiological and environmental factors (Gelasakis et al. Reference Gelasakis, Oikonomou, Bicalho, Valergakis, Fthenakis and Arsenos2013). Moreover, in the majority of cases and irrespective of the magnitude of the problem within the flocks, farmers underestimate lameness incidence and tend to disregard the negative effects of lameness on milk production (Gelasakis et al. Reference Gelasakis, Arsenos, Valergakis, Fortomaris and Banos2010). This attitude bears a striking resemblance to that of dairy cow farmers (Espejo et al. Reference Espejo, Endres and Salfer2006; Leach et al. Reference Leach, Whay, Maggs, Barker, Paul, Bell and Main2010). It is well established, however, that lameness is associated with a significant reduction in milk yield in this species (Warnick et al. Reference Warnick, Janssen, Guard and Gröhn2001; Green et al. Reference Green, Hedges, Schukken, Blowey and Packington2002; Bicalho et al. Reference Bicalho, Warnick and Guard2008). Further research is expected to facilitate a better understanding of the significance of the problem in dairy sheep as in the case of dairy cows (Huxley, Reference Huxley2013).
Besides the welfare issues, one factor that could raise dairy sheep farmers’ awareness of lameness is to demonstrate its cost. In this respect, the quantification of the impact of lameness on milk production is a prerequisite. Moreover, as with all diseases, early detection is crucial for timely intervention and successful treatment; visual identification (locomotion scoring) of lame ewes is a subjective, time-consuming and difficult method to apply (Kaler et al. Reference Kaler, Wassink and Green2009; Phythian et al. Reference Phythian, Cripps, Grove-White, Jones, Michalopoulou and Duncan2013) considering the natural tendency of most sheep to congregate at the sight of humans observing or approaching them. An objective variable would be very useful, especially if it could alert farmers early in the course of the disease.
Hence, the objective of the present study was twofold: first, to quantify the differences in daily milk yield (DMY) and total milk yield (TMY) between lame and non-lame ewes; and secondly, to determine the shape of lactation curves around the lameness incident in order to explore the possibility of using milk recording data as an early diagnostic tool.
Materials and methods
Two intensively reared flocks of purebred Chios ewes were used for the study. Flock monitoring and data collection pertained to the period 2008–2009. The study was approved by the ethics review committee of the School of Veterinary Medicine, Aristotle University of Thessaloniki.
Animals and management
A total of 170 and 113 ewes that lambed from October through December 2008, on Farms A and B, respectively, were considered for the study. Both farms were located in Northern Greece (Farm A: 20 m above sea level, latitude 40°17′18″, longitude 23°09′29″ and Farm B 107 m above sea level, latitude 39°22′43″, longitude 22°51′37″). A sheep shed providing a floor area of 2 m2/ewe and a volume of about 10 m3/ewe was available on Farm A, but ventilation was moderate. On Farm B, a shed providing a floor area of 2 m2/ewe and a volume of 12 m3/ewe was available while ventilation was adequate in this case; fans were installed and operated when necessary. Barley straw was used as bedding on both farms. During winter, fresh bedding was added every other day; in spring and summer periods this interval was extended to 5–10 d, depending on bedding condition. Bedding was removed and premises were disinfected twice a year on Farm A and three times a year on Farm B, using a combination of commercial disinfectants and lime. Ewes had access, year round, to an earthen exercise paddock (2·5 m2/ewe).
On Farm A lambing started at the end of October and peaked in late November. Lambs were kept with their dams for about 8 weeks. On Farm B, oestrus synchronisation with intravaginal sponges resulted in a short lambing period of about 10 d in mid-November. Lambs were artificially reared for 8 weeks.
Ewes were machine-milked 3 times a day for 3 months and thereafter, twice a day until the end of the milking period, which lasted about 8 months. Milking parlours were equipped with automatic milk recording systems for individual ewes (SAE Afikim – Afimilk and Alpro – De Laval, for Farms A and B, respectively).
On Farm A, feeding of ewes during the experimental period was based on alfalfa hay (1·0–1·6 kg/d per ewe), barley straw (0·2–0·5 kg/d per ewe) and concentrates (0·7–1·5 kg/d per ewe) comprising corn grain (35·0%), barley grain (32·5%), soybean meal (30·0%) and a mineral/vitamin supplement (2·5%). The amount of ration offered was adjusted to group milk yield and pasture availability. Rations were offered in troughs allowing sufficient space (0·3 m/ewe), to enable access of all ewes at the same time. A 5-ha sown irrigated pasture (Lolium perenne + Trifolium repens) was available for grazing from March until September. On Farm B, feeding of ewes was based on alfalfa hay (0·8–1·4 kg/d per ewe), barley straw (0·1–0·4 kg/d per ewe), corn silage (1·0–2·0 kg/d per ewe) and concentrates (0·7–1·3 kg/d per ewe) comprising corn grain (37·0%), barley grain (23·0%), soybean meal (16·0%), wheat bran (10·0%), sunflower cake (10·0%) and a mineral/vitamin supplement (4·0%). The amount of ration offered was adjusted to group milk yield. Rations were offered on a feeding belt (0·33 m/ewe) which enabled access of all ewes at the same time.
A well-designed vaccination protocol against Brucellosis (Brucella melitensis vaccine, strain Rev. 1), Clostridial diseases (Covexin 8A; Schering-Plough Animal Health), Contagious agalactia (Agalax; CEVA), Chlamydial abortion (Enzovax; Intervet International B.V.) and Paratuberculosis (Gudair Vaccine; Provet) was strictly followed in both flocks. Regarding parasites, ewes were treated with ivermectin (0·2 mg/kg Valaneq; Merial) and fenbendazole (Farm A, 10 mg/kg Panacur; Intervet) or netobimin (Farm B, 10 mg/kg Hapadex; Schering-Plough Animal Health) at the third month of gestation and at lambing, respectively. All ewes were treated with an intramammary antibiotic preparation (Nafpenzal Dry Cow; Intervet International) at dry-off (extra-label use). Routine foot trimming was carried out once a year, at lambing. After the diagnosis of lameness, lame ewes were treated using a single intramuscular injection of long-acting Oxytetracycline (Alamycin LA; Norbrook) at a dose rate of 20 mg/kg.
Experimental design
The overall study was a prospective study of lameness for the surveyed sheep population. For the implementation of the study, the same veterinarian visited the farms once a week throughout the entire milking period resulting in a total of 34 visits per flock. Milk yield was electronically recorded daily for individual ewes in both flocks. For the subsequent statistical analyses 7-d average milk yields were used representing the average DMY for the week of visit. Average DMY also enabled the calculation of lactation curves and enabled comparisons between lame ewes and the selected controls regarding milk yield for the pre- and post-lameness period.
Ewes were observed twice daily (in the milking parlour) by the farm owners or the personnel for any abnormal behaviour. On both farms, a passageway that allowed ewes to enter the milking parlour in single line was constructed to allow observation of gait of individual ewes. Ewes showing signs of disease or a sudden reduction in DMY were clinically examined by the veterinarian at the next visit. When a ewe was found to be lame, then a healthy one of the same age, same number and stage of lactation, similar milk potential (previous lactation records) and average DMY at the beginning of current milking period was chosen as a control. The selection was based on data from the farm's electronic records. Both animals were colour-marked to help identify them after milking for further testing. Clinical examination, microbiological examination of milk samples and parasitological examination of faeces were performed both on lame and control ewes in order to identify and exclude from the study ewes either showing clinical signs of diseases or with subclinical mastitis and/or high levels of parasitic infestation. The examinations and tests performed are summarised below:
(i) Clinical examination: This comprised inspection (head, body, limbs, feet and conjunctivae), palpation of udder and joints, as well as auscultation of lungs and heart. Heart rate, breathing rate and body temperature were recorded. Also, body condition score (BCS) was assessed using the 5-point scale, from 1 (emaciated) to 5 (obese), proposed by Russel et al. (Reference Russel, Doney and Gunn1969).
(ii) Locomotion Score (LS) and lameness: Locomotion assessment was based on the following 4-point scale scoring system (Hill et al. Reference Hill, Murphy, Nelson, Mouttotou, Green and Morgan1997): 1 = normal gait, 2 = no obvious lameness when standing, abnormal gait when walking, 3 = shifting stance and obvious lameness when walking, 4 = unwilling to bear weight on one foot when standing or walking. Ewes with a locomotion score higher than 1 at least once throughout the milking period were considered to be lame. All other ewes were considered non-lame for the purposes of this study. The cause of lameness was assessed during the clinical examination by an experienced veterinarian. Lame feet were inspected through observation and palpation in order to localise possible abnormalities, injuries, lesions or painful sites. Afterwards, a detailed foot-trimming was performed in order to reveal any lesions underneath the hoof wall; final diagnosis of foot lameness was set on the basis of the lesions and the clinical manifestation of the hoof disease.
(iii) Milk sampling and assessment: Milk samples were taken for California Mastitis Test (CMT, Bovi-Vet; Kruuse) and bacteriological examination, to test for subclinical mastitis (Fthenakis et al. Reference Fthenakis, El-masannat, Booth and Jones1991).
(iv) Parasitological examination: Faecal samples were collected directly from the rectum and were examined for faecal egg counts (FEC) using the modified McMaster method (Ministry of Agriculture, Fisheries and Food, 1986).
Examination and testing of case and control animals continued throughout the milking period. On Farm A, 21 out of 170 ewes were found to be lame due to foot lesions; four of them were excluded from the analysis owing to subclinical or clinical mastitis of either the lame or the control ewe, at some point of the study. On Farm B, lameness was diagnosed in 19 out of 113 ewes. Seven of them were excluded from analysis due to health problems (subclinical mastitis, metritis, hernia) or insufficient data. Finally, 17 and 12 lame ewes from Farms A and B, respectively, were used in the subsequent statistical analysis.
Data management and statistical analysis
(i) Descriptive statistics: Initially, descriptive statistics were calculated including means and sem for DMY and for TMY of the first 210 d of the milking period, of lame ewes and their selected controls.
(ii) Lactation curve calculation: A general linear model was developed for the calculation of lactation curves of lame and non-lame ewes across the milking period using ASReml (Model 1). In each flock, the first lameness event during milking period was used for each ewe.
 $$TDM_{abcdkghj} = m + F_a + YM_b + LA_c + MY_d + W_k + E_g W_k + L_h + S_j + e_{abcdkghj}$$
where: TDM abcdkghj = average DMY for the gth ewe of the ath flock measure on the kth week of milking period (kg), m = overall mean, F a = fixed effect of the ath flock (2 levels), YM b = fixed effect of the bth interaction between lambing year and lambing month, LA c = fixed effect of the cth interaction between the number of lactation and age at lambing (in months), MY d = fixed effect of the dth interaction between the month and the year DMY was calculated, W k = fixed effect of the kth week of milking period when DMY was assessed (a second order polynomial was used in order milk yield curves and covariances for repeated measures of the same ewe to be considered), E gWk = random effect of the interaction between the gth ewe and the kth week of milking period when DMY was assessed (a second order polynomial was, also, used for the same reasons described above), L h = fixed effect of the hth lameness status (2 levels, 1 = non-lame ewes, 2 = lame ewes), S j = fixed effect of the jth week postlambing, e abcdkghj = random residual.
DMYs of lame ewes and their selected controls (adjusted for number and week of lactation) were compared using one-way analysis of variance (one-way ANOVA); comparisons were performed per week for the period initiated 4 weeks before lameness onset and were completed 8 weeks after it.
Effect of lameness on TMY
TMY was calculated for all ewes based on the average weekly DMY solutions produced by Model 1. Moreover, one way ANOVAs were used in order to compare TMY between lame ewes and their controls.
Results
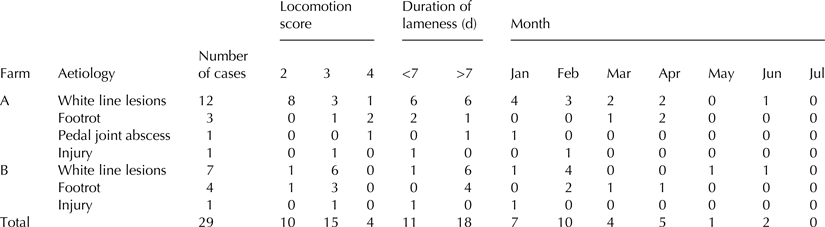
Lameness incidence on Farms A and B was 12·4 and 16·8%, respectively. The majority of lameness cases were diagnosed during the first 4 months of lactation both on Farm A (82·4%) and B (66·7%). Aetiology and duration of lameness are presented in Table 1. White line abscesses (WLA) were the major causes of lameness (70·6 and 58·3% of cases on Farms A and B, respectively) followed by footrot, pedal joint abscesses (PJA) and injuries. Locomotion score was equal to 2 for most of the WLA cases (66·7%) on Farm A and footrot and PJA were associated with severe lameness (LS = 4). On Farm B, the majority of cases were assigned a locomotion score equal to 3, regardless the cause of lameness. Duration of lameness was longer than a week in 83·3 and 47·1% of cases on Farms A and B, respectively (Table 1). In the same table, it is obvious that irrespective of the aetiology, most of the lameness cases occurred from January to April. In particular, white line lesions were most prevalent in January and February, whereas all of the footrot cases were observed between February and April. At the end of the lactation period (in July) no cases of lameness were observed.
Aetiology and characteristics of lameness

1, normalgait; 2, No obvious lameness when standing, abnormal gait when walking; 3, Shifting stance and obvious lameness when walking; 4, Unwilling to bear weight on one foot when standing or walking
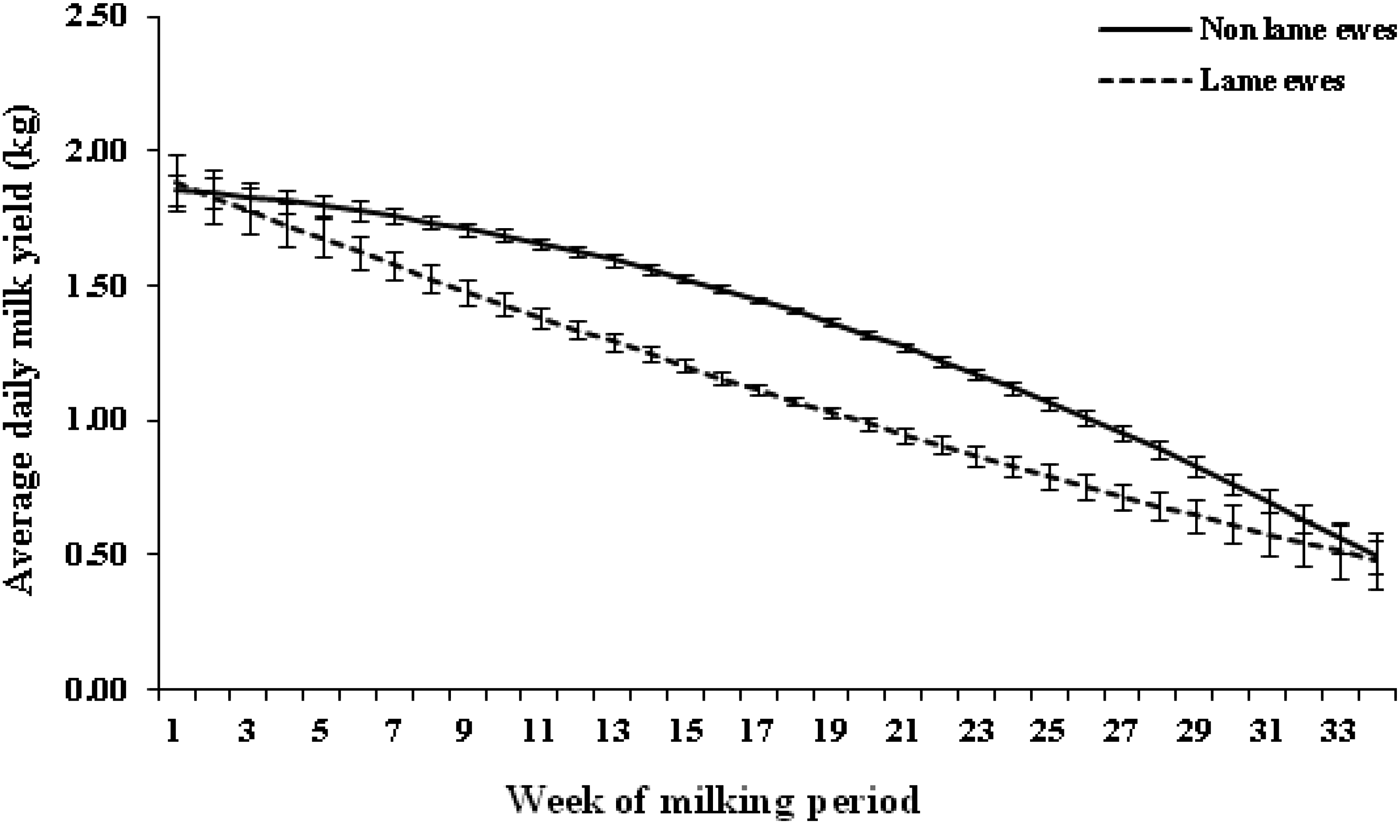
All factors fitted in Model 1, including lameness, had a significant effect on DMY (P < 0·05). Average DMY in lame ewes was significantly lower (213·8 g, P < 0·001) compared with the rest of the flock, where DMY averaged 1·340 kg (a reduction of about 16%). Figure 1 shows the DMY curves for non-lame and lame ewes across the milking period. Mean DMY was 1·89 ± 0·107 kg and at 1·86 ± 0·061 in the beginning of the milking period for lame and non-lame ewes, respectively (P > 0·05). Afterwards, DMY reduction rate tended to be higher in lame ewes, which finally resulted in a significantly reduced DMY during the sixth (P < 0·05, 1·78 ± 0·034 and 1·63 ± 0·063 kg of DMY for non-lame and lame ewes, respectively) and the seventh week of milking period (P < 0·01, 1·76 ± 0·029 and 1·58 ± 0·055 kg of DMY for non-lame and lame ewes, respectively). The highest DMY reduction was observed during week 16 of milking period (P < 0·001, 1·49 ± 0·013 kg vs. 1·16 ± 0·020 kg of DMY for non-lame and lame ewes, respectively). The reduction of DMY for lame ewes remained significant at P < 0·001 level from weeks 8 to 28 of milking. The reduction of DMY slowed down from week 29 of the milking period (P < 0·01, 0·83 ± 0·034 and 0·65 ± 0·063 kg of DMY for non-lame and lame ewes, respectively) to week 34 of the milking period (end of lactation), when the differences were not significant (0·49 ± 0·061 and 0·48 ± 0·107 kg of DMY for non-lame and lame ewes, respectively).
Average lactation curves for non-lame and lame ewes (ewes diagnosed lame at least once across milking period) (95% confidence interval for the mean is used as measure of dispersion).
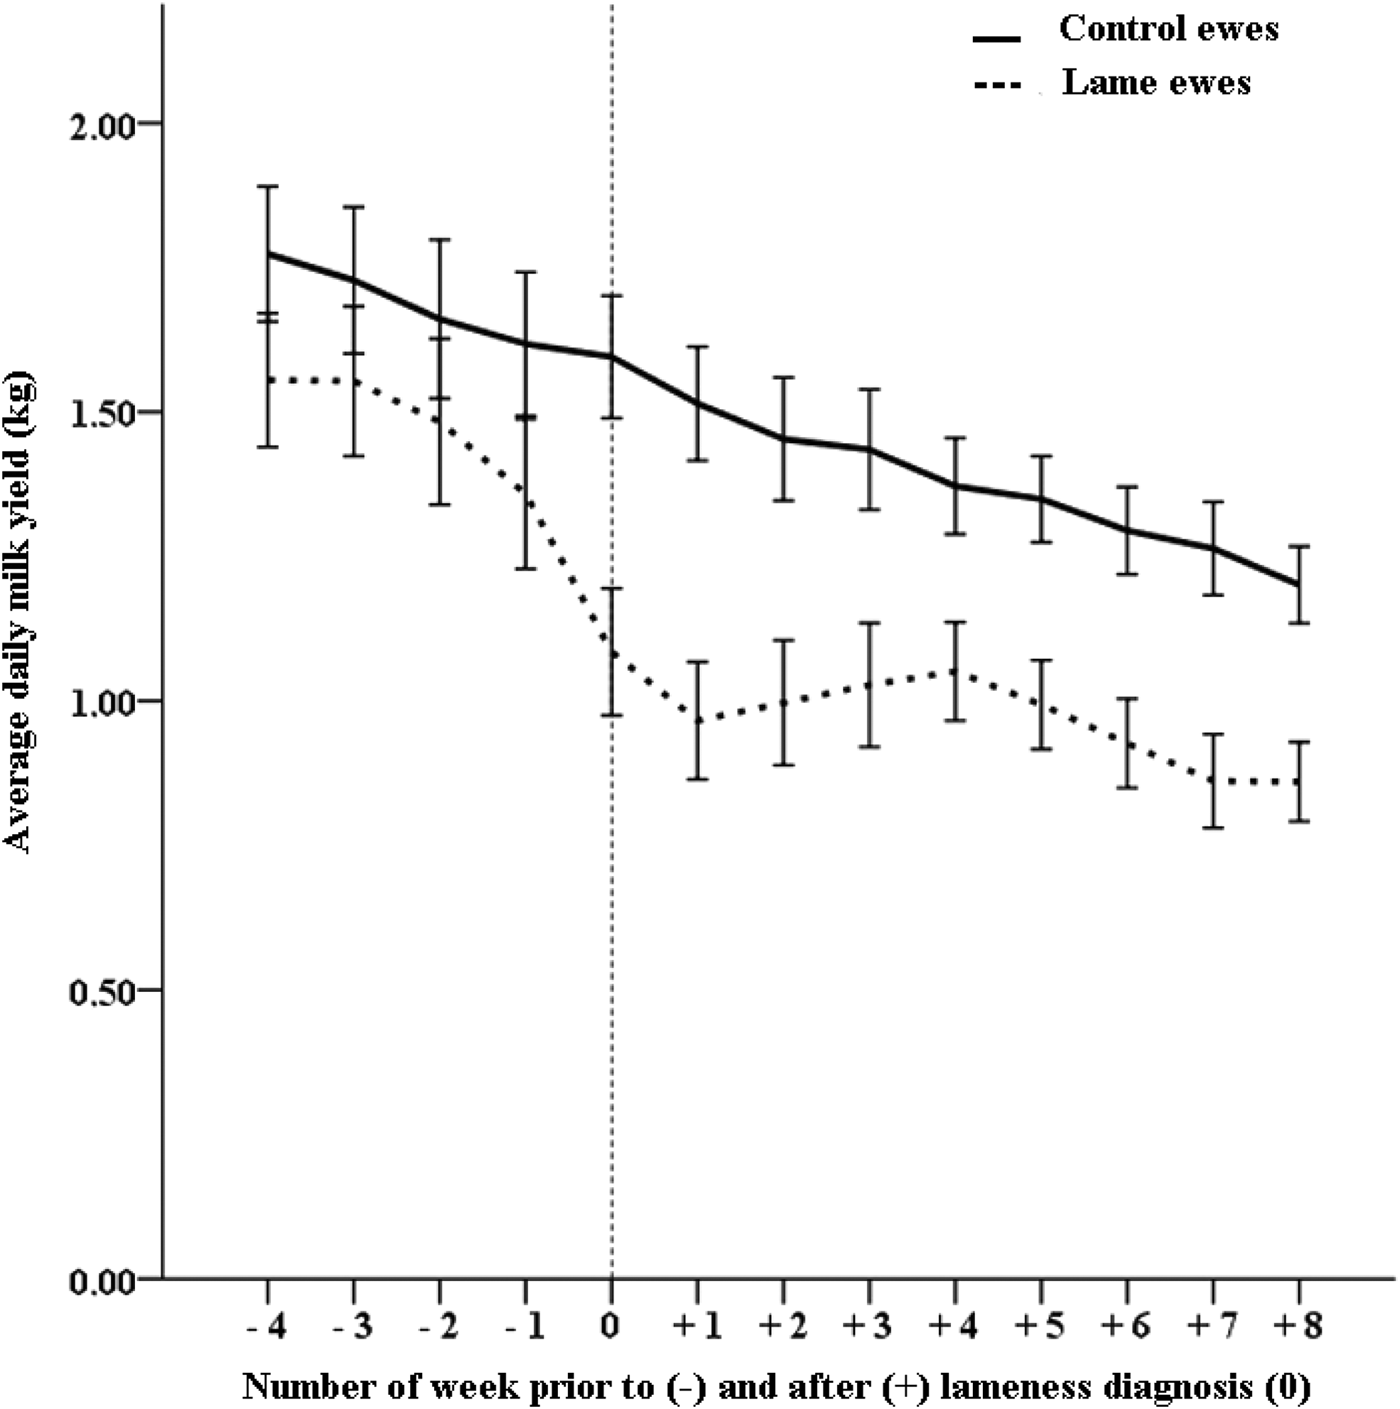
Figure 2 shows the mean DMY of lame ewes and their controls per week, after adjusting for number and week of lactation, starting from the fourth week before onset of lameness up to the eighth week afterwards. DMY tended to be lower for lame ewes, 2 weeks before lameness diagnosis (10·8%, P = 0·052, 1·66 vs. 1·48 kg for control and lame ewes, respectively) and 16·1% lower one week before lameness diagnosis (P ≤ 0·001, 1·62 kg vs. 1·36 kg for control and lame ewes, respectively). At the week of lameness diagnosis a significant milk yield reduction (P ≤ 0·001) was observed in lame ewes (about 32·5%) which was maximised one week later (35·8%, P ≤ 0·001). Figure 2 shows that for 8 successive weeks after lameness diagnosis, DMY of lame ewes continued to be significantly lower compared with controls at the P ≤ 0·001 level.
Mean daily milk yield (DMY) and lactation curves (adjusted for stage and number of lactation) of lame and control ewes for the period between 4 weeks before lameness diagnosis and 8 weeks after it.
TMYs for non-lame and lame ewes, as calculated by the weekly solutions of DMY produced by Model 1, were 318·9 and 268·0 kg, respectively (a reduction of about 16% for lame ewes). TMY for the first 210 d of the milking period, was 53·7 kg lower (19·3%) in lame ewes compared with controls (P < 0·01, Table 2).
Milk production per milking period for lame and control ewes
† Milk yield adjusted for 210 d of the milking period
Discussion
This is a follow-up study of a previously published work (Gelasakis et al. Reference Gelasakis, Arsenos, Valergakis, Fortomaris and Banos2010). In the aforementioned study, part of the data from Farm A was forced into a different general linear model in order to calculate the effect of lameness on total milk production; a reduction of about 20% was found. In the present study, a significant decrease in DMY of lame ewes was observed when comparison was made both at flock level on the prospective study and on individual ewe level (nested case-control study). This is not surprising as a reduction on milk yield has also been reported in meat sheep breeds (Winter, Reference Winter2004) but research is limited.
Milk yield in dairy cows has been found to be lower (Rajala-Schultz et al. Reference Rajala-Schultz, Grοhn and McCulloch1999; Warnick et al. Reference Warnick, Janssen, Guard and Gröhn2001; Bicalho et al. Reference Bicalho, Warnick and Guard2008), equal (Martin et al. Reference Martin, Aziz, Sandals and Curtis1982) or even higher (Dohoo & Martin, Reference Dohoo and Martin1984) in cases of lameness. In lame high-yielding cows, although a significant reduction in milk yield is expected, the latter remains at the same or higher levels compared with the herd average (Green et al. Reference Green, Hedges, Schukken, Blowey and Packington2002), making it difficult to accurately assess the effect of lameness on milk yield (Huxley, Reference Huxley2013). This problem can be overcome by calculating lactation curves of lame cows and comparing them both with the average herd lactation curve and with those of appropriately selected controls (Barkema et al. Reference Barkema, Westrik, van Keulen, Schukken and Brand1994). A similar approach was used in our study.
The present study revealed that DMY reduction started about 4 weeks before lameness diagnosis. The difference between lame ewes and their controls (Fig. 2) became significant the week preceding diagnosis and continued for several weeks after recovery, which is in accordance with the long-term effect of lameness on milk yield in cows as reported by Green et al. (Reference Green, Hedges, Schukken, Blowey and Packington2002). This finding provides a reasonable explanation for the significant reduction both on DMY and on TMY observed in lame dairy ewes, even when the duration of lameness is short (less than a week). A loss of 50 kg of milk per lactation represents an income loss of about 45 € per case (mean price for sheep milk was 0·9 €/kg during the 2013–2014 milking period in Greece). A treatment cost of 15–20 € per case must also be added. Obviously, depending on lameness incidence, losses can add up quickly and represent a significant financial burden for farmers.
Most cases of lameness in the present study were attributed to white line abscesses for which the aetiopathology remains unclear (Winter & Arsenos, Reference Winter and Arsenos2009), although some evidence of genetic influences on the occurrence of white line lesions have recently been reported by Conington et al. (Reference Conington, Nicoll, Mitchell and Bünger2010). Generally, increasing parity and herd size are considered probable risk factors of white line lesions (Barker et al. Reference Barker, Amory, Wright, Mason, Blowey and Green2009); nutrition and other predisposing factors or stressors (for example, inadequate housing conditions) can have a direct effect on milk production but at herd or flock level, these are usually common to all animals. Farm-specific epidemiologic investigation is needed to reveal differences related to management issues that pertain mainly to lame ewes. Moreover, the seasonal pattern of lameness occurrence within dairy sheep flocks needs to be further investigated and specified for the different causes of lameness. This could facilitate hypotheses making procedures regarding possible risk factors associated either with the productive cycle of dairy sheep or with the environmental conditions.
Is high milk production predisposing dairy ewes to lameness? The majority of cases in this study were diagnosed during the first 4 months post-lambing, when milk yield was highest. However, owing to the seasonal pattern of milk production the high lameness incidence coincided with the season in which environmental humidity levels were also high (January–April). This is a major predisposing factor (Gelasakis et al. Reference Gelasakis, Valergakis and Arsenos2009) and may confound our results. Results reported in Table 2 imply that ewes selected as controls had higher milk production than the other non-lame ewes; they had an advantage of 53·7 kg of milk over lame ewes in the first 210 d of the milking period whereas all non-lame ewes (controls included) had an advantage of 50·9 kg for the entire milking period (34 weeks). This is an indication that high milk production is indeed associated with lameness which is also supported by results from research on cows (Oikonomou et al. Reference Oikonomou, Cook and Bicalho2013).
The partial effects of different causes of lameness on milk yield could not be estimated owing to the low number of cases per causative agent. Estimating the latter effects forms an interesting research topic for future studies on dairy sheep. However, the notion is that the negative effect of lameness on milk production could be due to the fact that stress and pain result in lower feed consumption. This is considered the major factor associated with decreased milk yield in meat sheep breeds, where chronic lameness has been proved to have a significant negative effect on body condition (Stewart et al. Reference Stewart, Clark and Jarrett1984; Marshall et al. Reference Marshall, Walker, Cullis and Luff1991). Lame ewes may be underfed at pasture consuming a low quality and quantity of grass. This situation is certainly prevalent in animals covering their nutritional demands partially or totally from grazing. In our study, this scenario does not seem viable as the nutritional demands were covered by daily provision of an adequate ration in the shed. On Farm A, the grazing ground was very close to the shed and pasture quality was always very good. In any case, the highest prevalence of lameness and the subsequent reduction in milk yield were mainly observed during the winter months, when ewes did not graze. A more reasonable hypothesis would be that lame ewes are not able to compete for a place at the feeding trough, which results in the consumption of a lower quantity and, eventually, quality of feed. This scenario seems more viable in our case, even though feeding troughs provided, in theory, sufficient space for each ewe. In order to prove it though, the behavioural pattern of intensively reared lame ewes should be assessed, using observational techniques, which forms an important subject of future research. Lower feed consumption could also result from the presence of inflammatory factors (e.g. cytokines interleukin-1 and interleukin-6); some of these factors are known to cause anorexia in laboratory animals (Harden et al. Reference Harden, Du Plessis, Poole and Laburn2008).
The fact that milk production is already significantly lower one week prior to lameness diagnosis is a very promising observation. If it is confirmed in future studies it could become the basis for the development of an algorithm that could potentially warn farmers very early in the course of the disease. Similar approaches have already been investigated in dairy cows (Machado et al. Reference Machado, Caixeta and Bicalho2011; Van Hertem et al. Reference Van Hertem, Maltz, Antler, Romanini, Viazzi, Bahr, Schlageter-Tello, Lockhorst, Berckmans and Halachmi2013). Of course, automated milk recording is still an exception on dairy sheep farms but they are expected to become more common in the future. Early disease diagnosis is one potential way to justify the investment. In any case, however, the specificity of monitoring milk yield as an early diagnostic tool for the identification of specific diseases needs to be assessed.
Conclusion
The results of this study demonstrate evidence of significant financial losses in dairy sheep due to lameness which, however, need to be accurately estimated in further, more detailed, analyses. A large-scale survey should now be considered in order to assess the effects of different causes of lameness, on different breeds of sheep, raised under different environments and management schemes.
The first author acknowledges financial support from the Greek State Scholarships Foundation (Athens, Greece). Participating farmers are acknowledged for their collaboration.